. 2024 Feb 6:14:1251351.
doi: 10.3389/fendo.2023.1251351. eCollection 2024.

The TRPM2 ion channel regulates metabolic and thermogenic adaptations in adipose tissue of cold-exposed mice

Affiliations

The TRPM2 ion channel regulates metabolic and thermogenic adaptations in adipose tissue of cold-exposed mice

Andrea Benzi et al. Front Endocrinol (Lausanne). .

Abstract

Introduction: During thermogenesis, adipose tissue (AT) becomes more active and enhances oxidative metabolism. The promotion of this process in white AT (WAT) is called "browning" and, together with the brown AT (BAT) activation, is considered as a promising approach to counteract obesity and metabolic diseases. Transient receptor potential cation channel, subfamily M, member 2 (TRPM2), is an ion channel that allows extracellular Ca2+ influx into the cytosol, and is gated by adenosine diphosphate ribose (ADPR), produced from NAD+ degradation. The aim of this study was to investigate the relevance of TRPM2 in the regulation of energy metabolism in BAT, WAT, and liver during thermogenesis.

Methods: Wild type (WT) and Trpm2-/- mice were exposed to 6°C and BAT, WAT and liver were collected to evaluate mRNA, protein levels and ADPR content. Furthermore, O2 consumption, CO2 production and energy expenditure were measured in these mice upon thermogenic stimulation. Finally, the effect of the pharmacological inhibition of TRPM2 was assessed in primary adipocytes, evaluating the response upon stimulation with the β-adrenergic receptor agonist CL316,243.

Results: Trpm2-/- mice displayed lower expression of browning markers in AT and lower energy expenditure in response to thermogenic stimulus, compared to WT animals. Trpm2 gene overexpression was observed in WAT, BAT and liver upon cold exposure. In addition, ADPR levels and mono/poly-ADPR hydrolases expression were higher in mice exposed to cold, compared to control mice, likely mediating ADPR generation.

Discussion: Our data indicate TRPM2 as a fundamental player in BAT activation and WAT browning. TRPM2 agonists may represent new pharmacological strategies to fight obesity.

Keywords: ADPr; TRPM2; brown adipose tissue; browning; cold exposure; thermogenesis; white adipose tissue.


Conflict of interest statement

The authors declare that the research was conducted in the absence of any commercial or financial relationships that could be construed as a potential conflict of interest.

Figures

Figure 1
Figure 1
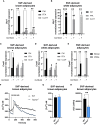
Lack of TRPM2 impairs cold exposure-induced iBAT activation and iWAT browning. iBAT and iWAT were collected from WT and Trpm2−/− mice kept at 30°C (black bars), or at 6°C (blue bars). qPCR analyses were performed to measure mRNA levels of: Pgc-1α in iBAT (A) and iWAT (B); Ucp1 in iBAT (C) and iWAT (D). Results are mean ± SD of determinations on tissues from different animals (n= 4). (E), Western blot analyses were performed in iBAT of WT and Trpm2-/- mice to evaluate UCP1 protein levels (n= 3): values were normalized on the respective Vinculin levels and mean ± SD of the ratios are shown. (F) Sections of paraffin-embedded iBAT and iWAT, processed as described in Material and Methods, were stained with the anti-UCP1 antibody, followed by the anti-rabbit Cy3 secondary antibody. (G) Hematoxylin/Eosin (HE) staining was performed on sections of paraffin-embedded tissues using standard procedures. Representative images are shown in F and G. Data were analyzed by ANOVA followed by Tukey’s test: *, p<0.05, **, p<0.01, ***, p<0.001, ****, p<0.0001; #, p<0.05, ##, p<0.01, ###, p<0.001, compared with the corresponding WT.
Figure 2
Figure 2
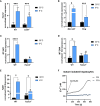
Lack of TRPM2 impairs Creb1 expression, Akt activation and mitochondriogenesis in response to cold in adipose tissues. iBAT and iWAT were collected from WT and Trpm2−/− mice kept at 30°C (black bars), or at 6°C (blue bars). qPCR analyses were performed to measure mRNA levels of: Creb1 in iBAT (A) and iWAT (B); MT-ND1 in iBAT (E) and in iWAT (F). The mitochondrial/nuclear DNA ratio was evaluated by qPCR in iBAT (G) and iWAT (H). (C, D), Western blot analyses were performed in iBAT and iWAT of WT and Trpm2-/- mice to evaluate level of phosphorylated Akt (n = 3): values were normalized on the respective Akt levels and mean ± SD of the ratios are shown. Data were by ANOVA followed by Tukey’s test: *, p<0.05, **, p<0.01, ***, p<0.001, ****, p<0.0001; #, p<0.05, ##, p<0.01, ###, p<0.001, ####, p<0.0001, compared with the corresponding WT.
Figure 3
Figure 3
Cold exposure determines the increase in Trpm2 and Creb1 in adipocytes. (A, B), qPCR were performed on iBAT and iWAT collected from WT (A) and Cd38−/− (B) mice kept at 30°C (black bars), or at 6°C (blue bars) and Trpm2 mRNA levels were evaluated. (C), Trpm2 and Creb1 expression were measured by qPCR on mature brown adipocytes freshly isolated from iBAT of WT mice kept at 30°C (black bars), or at 6°C (blue bars). Results are mean ± SD of determinations on tissues from different animals (n = 4). Data were analyzed by ANOVA followed by Tukey’s test: *, p<0.5, **, p<0.01, ***, p<0.001, ****, p<0.0001.
Figure 4
Figure 4
Enhanced degradation of PAR polymers is a source of ADPR during cold exposure in WT and Cd38-/- mice. ADPR levels were measured by mass spectrometry analyses: (A), on iBAT and iWAT of WT and Cd38-/- mice kept at thermoneutrality (30°C, black bars), and mice exposed to cold temperature (6°C, blue bars) and results are mean ± SD of determinations on tissues from different animals (n = 6); (B) on mature brown adipocytes isolated from WT mice, and exposed to 1 μM CL for 4 h. (C, D), Levels of PARylated proteins revealed by Western blot analyses performed in iBAT of WT (C) and Cd38-/- (D) mice housed at 30°C (black bars) or at 6°C (blue bars) using an antibody against ADPR polymers; values were normalized on the respective Vinculin and presented as mean ± SD (n=3). (E), Expression level of the genes encoding for the main cellular mono/poly-ADPR hydrolases (MacroD1, MacroD2, Oard1, Parg, Adprs) was measured by qPCR on iBAT of WT and Cd38-/- . Results are mean ± SD of determinations on tissues from different animals (n=4). Data were analyzed by ANOVA followed by Tukey’s test: *, p<0.5, **, p<0.01, ***, p<0.001, $, p<0.00001; #, p<0.05, ##, p<0.01, ###, p<0.001, &, p<0.00001 compared with the corresponding WT.
Figure 5
Figure 5
TRPM2 inhibitors hampered thermogenic response in CL316,243-treated primary adipocytes. SVF-derived cells were isolated from iBAT and iWAT and differentiated using a specific differentiation cocktail: mature adipocytes were stimulated (or not) with 100 nM CL316,243, in presence or absence of TRPM2 inhibitors. (A-D), qPCR analyses of Ucp1 (A, B) and Creb1 (C, D) expression in brown (A, C) and white (B, D) primary adipocytes pre-treated with 200 μM flufenamic acid (FFA), 100 μM clotrimazole (CLOT) or vehicle, prior to CL treatment. (E), Trpm2 expression in white and brown adipocytes upon CL treatment. Results are mean ± SD of at least 4 determinations. (F-H), SVF-derived brown adipocytes from WT and Trpm2 -/- mice were loaded with Fura2, rinsed twice and a Ca2+-containing buffer was added. The Fura2-loaded adipocytes were imaged on a Leica IRBE microscope and stimulated with 1 µM CL. The mean trace (F) is shown (n=49 for WT, n = 40 Trpm2 -/-), together with the calculated mean peak (G) and the area under the curve (H). Data were analyzed by ANOVA followed by Tukey’s test: *, p<0.5, **, p<0.01, ***, p<0.001; #, p<0.05, ##, p<0.01 compared with the corresponding WT.
Figure 6
Figure 6
Trpm2 is dispensable in the downregulation of glycolysis and in the upregulation of glucose release occurring in liver upon cold-exposure. Livers were collected from WT and Trpm2-/- mice kept at 30°C (black bars) or 6°C (blue bars). Phosphofructokinase 1 (Pfk1, (A), Glyceraldehyde-3-Phosphate Dehydrogenase (Gapdh, (B), Pyruvate Kinase (Pk, (C), Pyruvate dehydrogenase (Pdha1, (D) and Glucose 6-Phosphatase (G6pase, (E) gene expression in WT and Trpm2-/- mice. Results are mean ± SD of determinations on tissues from different animals (n = 4). Data were analyzed by ANOVA followed by Tukey’s test: *, p<0.5, ***, p<0.001, ****, p<0.0001, $, p<0.00001; #, p<0.05, ##, p<0.01, ###, p<0.001, &, p<0.00001 compared with the corresponding WT.
Figure 7
Figure 7
Trpm2 in liver during thermogenesis. Livers were collected from WT, Cd38−/− and Trpm2-/- mice kept at 30°C (black bars) or 6°C (blue bars). (A), Trpm2 gene expression was evaluated in WT and Cd38−/− by qPCR. (B, C, E), MacroD1 and Parg (B), MT-ND1 (C) and Fibroblast growth factor 21 (Fgf21, E) gene expression was evaluated in WT and Trpm2-/- mice by qPCR. (D) The mitochondrial/nuclear DNA ratio was evaluated by qPCR. (F) Hepatocytes were isolated from WT mice and loaded with Fura2. Cells were pre-incubated (or not) for 10 min with 200 μM FFA and [Ca2+]i measurements, upon 1 μM CL316,243 stimulation, were performed with a microfluorimetric system (Cairn Research, Faversham, Kent, UK). Results are mean ± SD of determinations on tissues from different animals (n = 4). Data analyzed by ANOVA followed by Tukey’s test: *, p<0.5, ***, p<0.001, ****, p<0.0001, $, p<0.00001; #, p<0.05, ###, p<0.0001, &, p<0.00001 compared with the corresponding WT.
Figure 8
Figure 8
Trpm2 deficiency reduced the thermogenic capacity in response to cold acclimation and adrenergic stimulation. (A-D), In vivo measurements (O2 consumption and CO2 production) performed on WT (black lines) and Trpm2-/- mice (blue lines) housed for 5 days to decreasing temperatures (from 30°C to 5°C) during the light time (Day; (A, B) and the dark time (Night; (C, D); mean ± SD (n=6 mice per group). (E, F), calculated EE at Day (E) and Night (F); mean ± SD (n=6 mice per group). (G), O2 consumption, (H), CO2 production, and (I), EE in WT (black lines) and Trpm2-/- mice (blue lines) mice housed at thermoneutrality upon CL administration. Monitoring started approximately 4 h before the treatment and stopped 5 h after the injection of CL; mean traces from n=6 mice per group are shown. (J), EE: mean ± SD (n=6) of calculated values at 1 h before and 5 h after CL injection in WT (black bars) and Trpm2-/- mice (blue bars). * p ≤ 0.05 and ** p ≤ 0.01 by two-tailed unpaired Student’s t test.

References

    1. Fenzl A, Kiefer FW. Brown adipose tissue and thermogenesis. Horm. Mol Biol Clin Investig (2014) 19:25–37. doi: 10.1515/hmbci-2014-0022 - DOI - PubMed
    1. Martínez-Sánchez N. There and back again: leptin actions in white adipose tissue. Int J Mol Sci (2020) 21:6039. doi: 10.3390/ijms21176039 - DOI - PMC - PubMed
    1. Hondares E, Iglesias R, Giralt A, Gonzalez FJ, Giralt M, Mampel T, et al. . Thermogenic activation induces FGF21 expression and release in brown adipose tissue. J Biol Chem (2011) 286:12983–90. doi: 10.1074/jbc.M110.215889 - DOI - PMC - PubMed
    1. Worthmann A, John C, Rühlemann MC, Baguhl M, Heinsen FA, Schaltenberg N, et al. . Cold-induced conversion of cholesterol to bile acids in mice shapes the gut microbiome and promotes adaptive thermogenesis. Nat Med (2017) 23:839–49. doi: 10.1038/nm.4357 - DOI - PubMed
    1. Hankir MK, Klingenspor M. Brown adipocyte glucose metabolism: a heated subject. EMBO Rep (2018) 19:e46404. doi: 10.15252/embr.201846404 - DOI - PMC - PubMed

Publication types