

Respiratory Syncytial Virus, Influenza and SARS-CoV-2 in Homeless People from Urban Shelters: A Systematic Review and Meta-Analysis (2023)
- PMID: 38390917
- PMCID: PMC10885116
- DOI: 10.3390/epidemiologia5010004
Respiratory Syncytial Virus, Influenza and SARS-CoV-2 in Homeless People from Urban Shelters: A Systematic Review and Meta-Analysis (2023)
Abstract
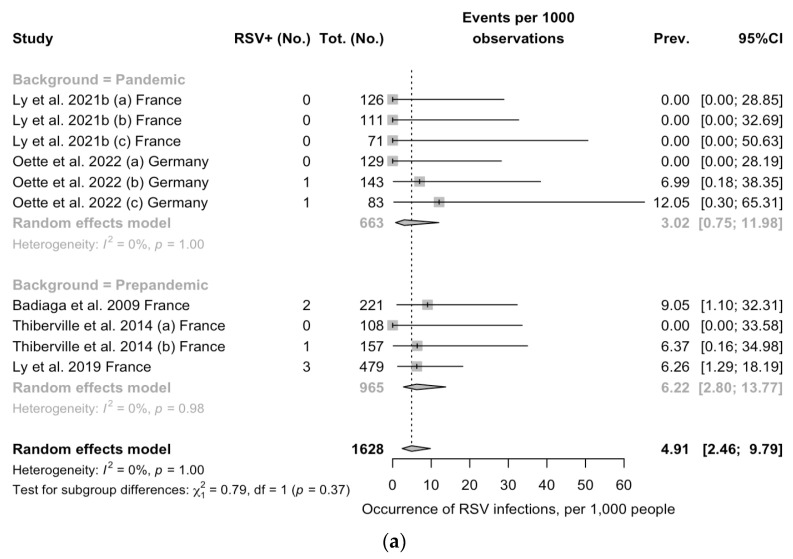
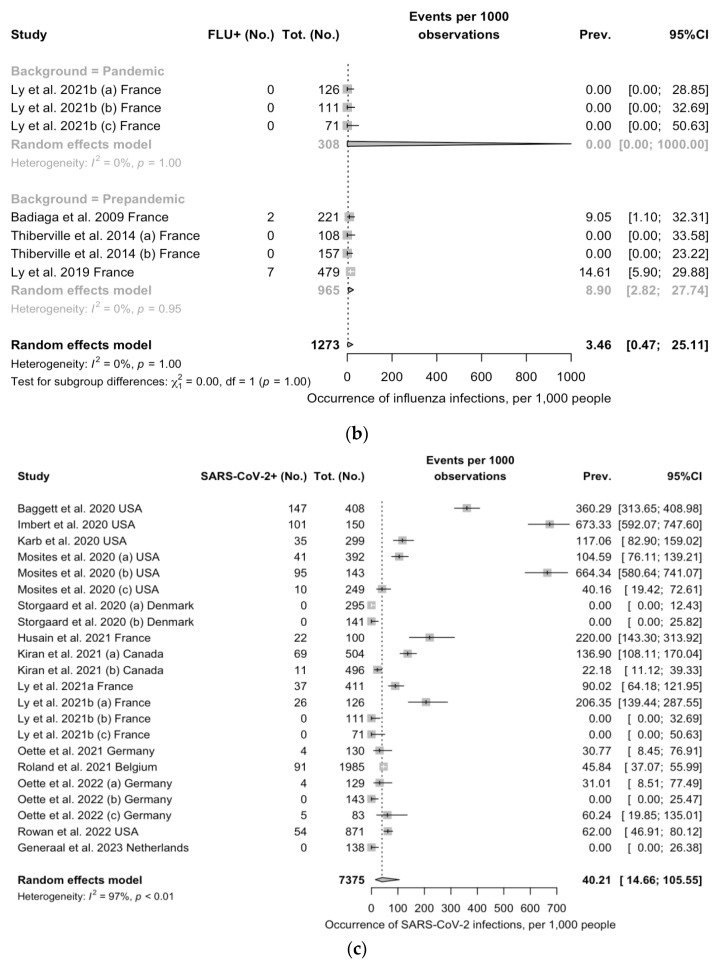
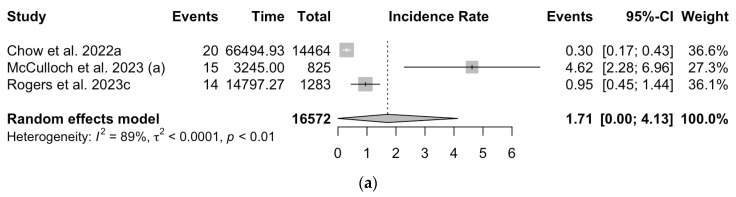
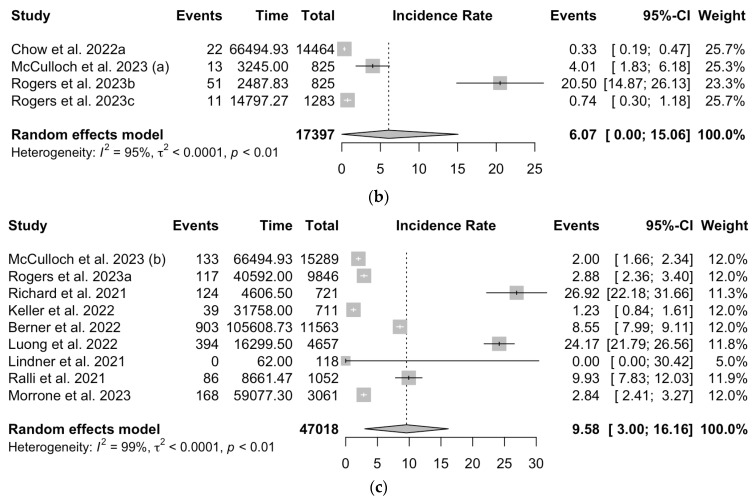
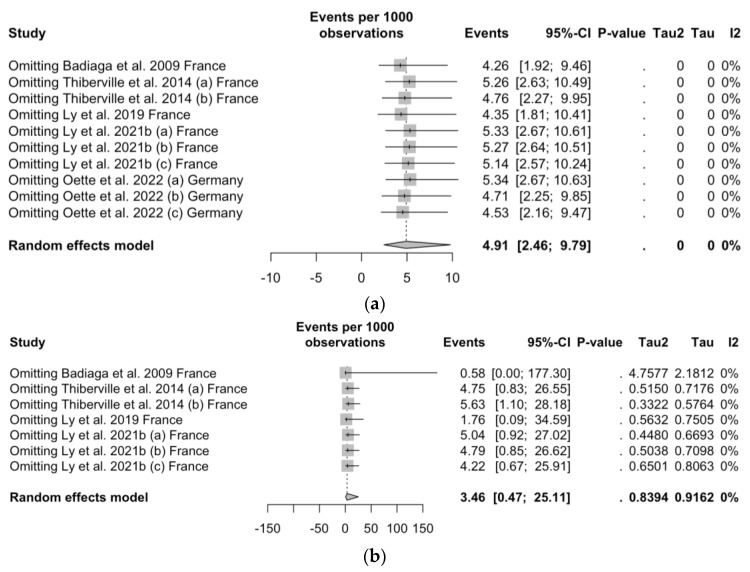
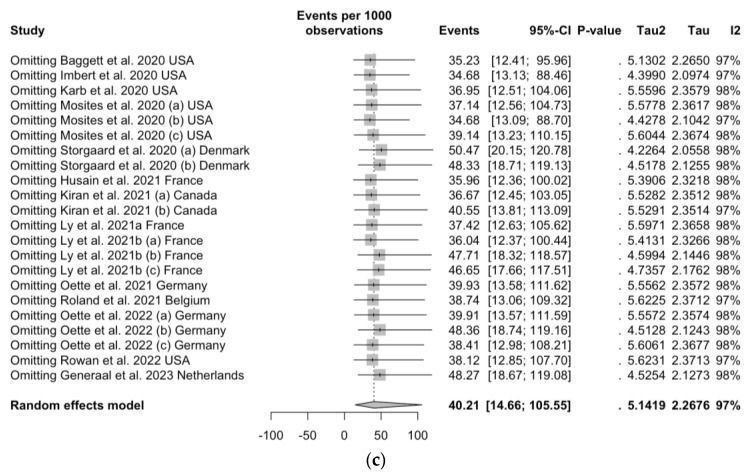
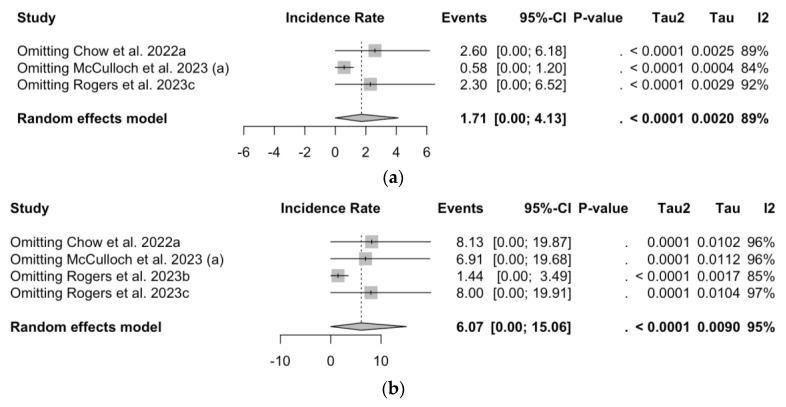
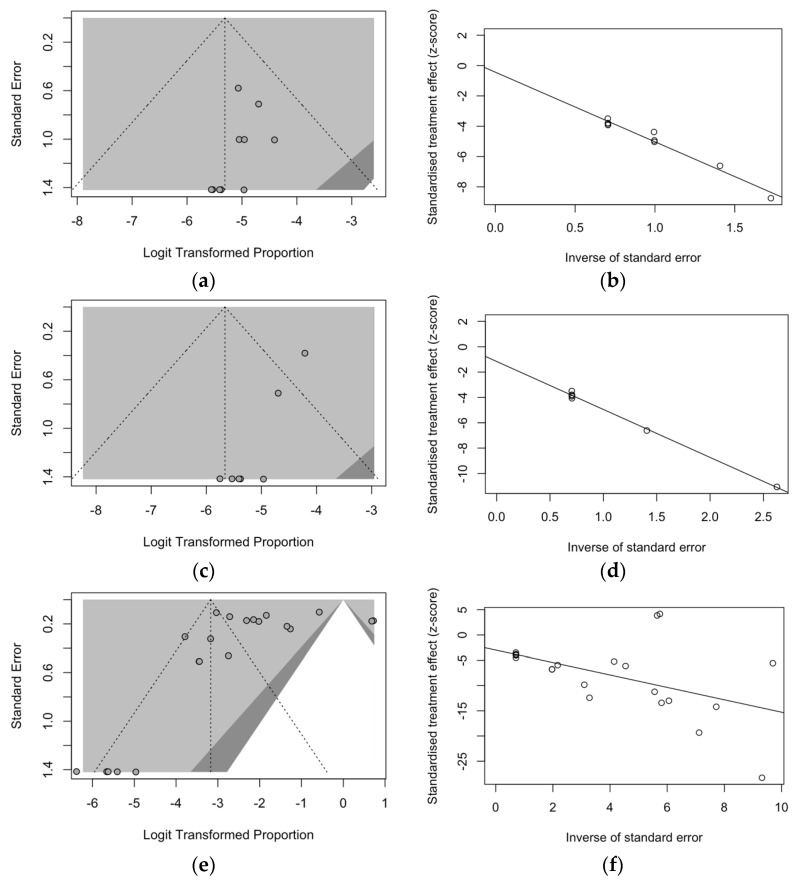
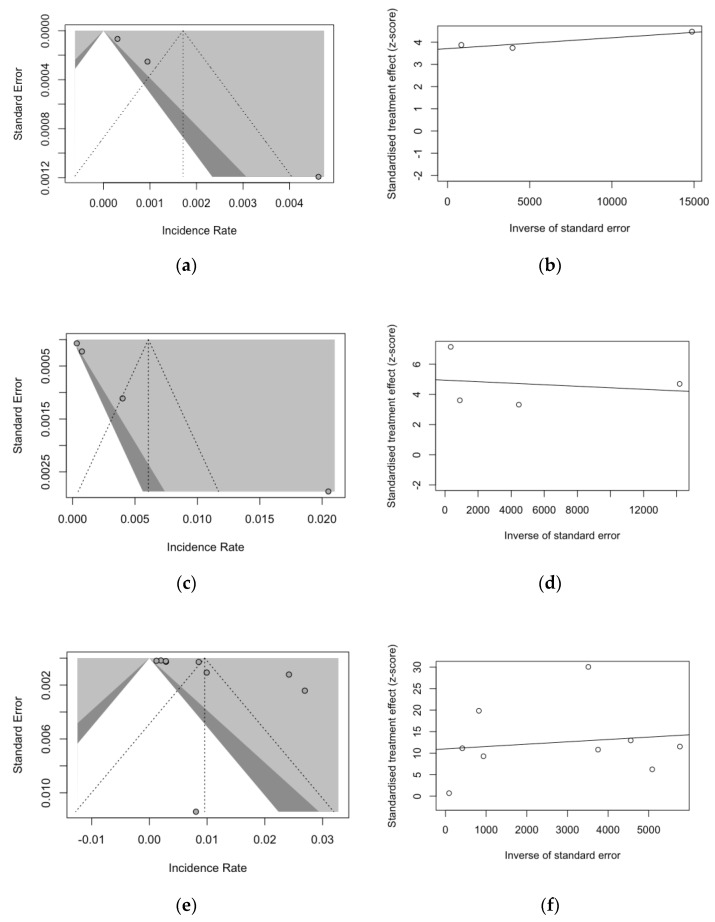
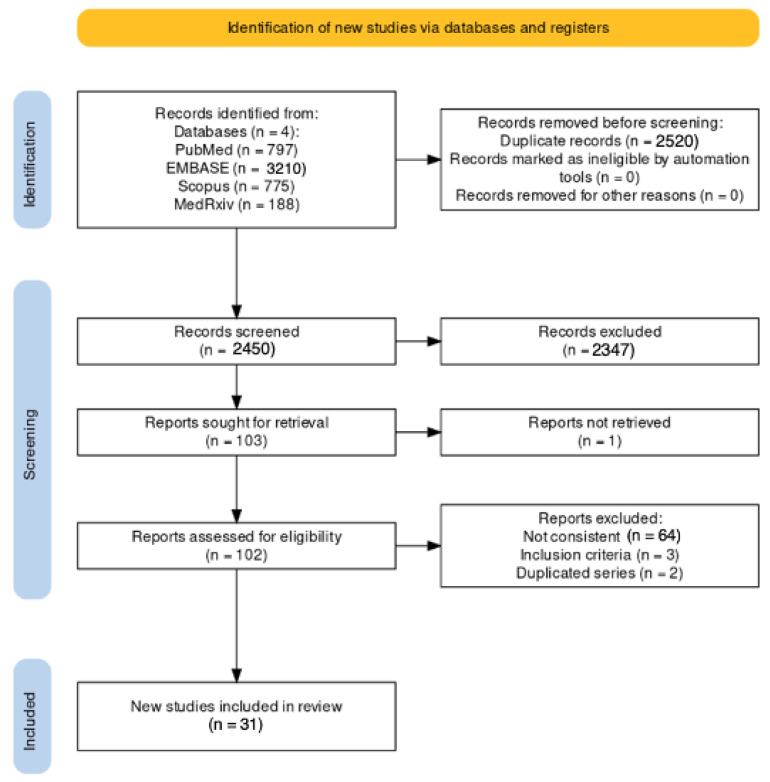
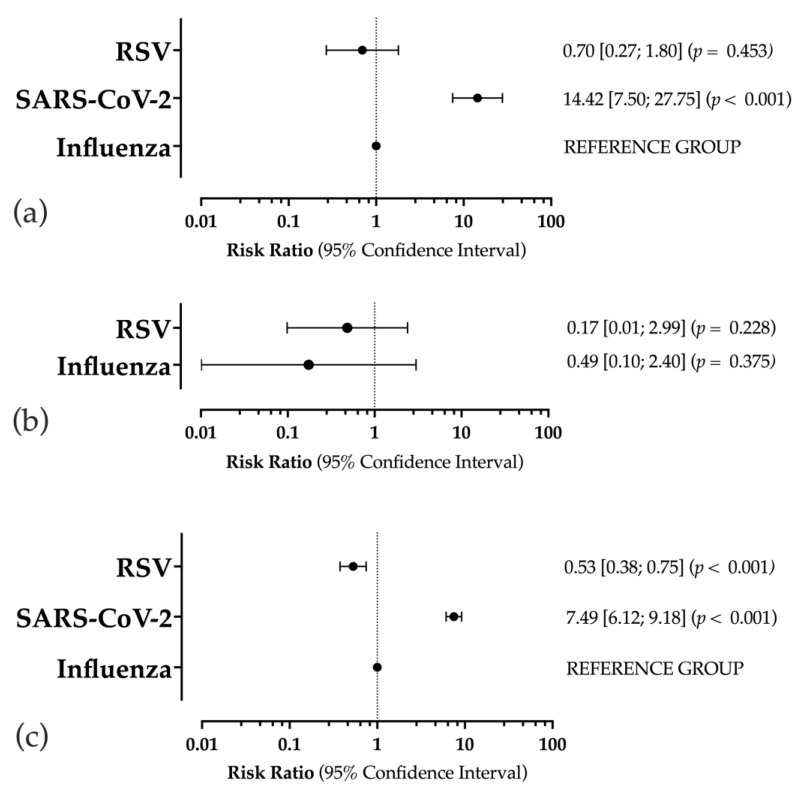
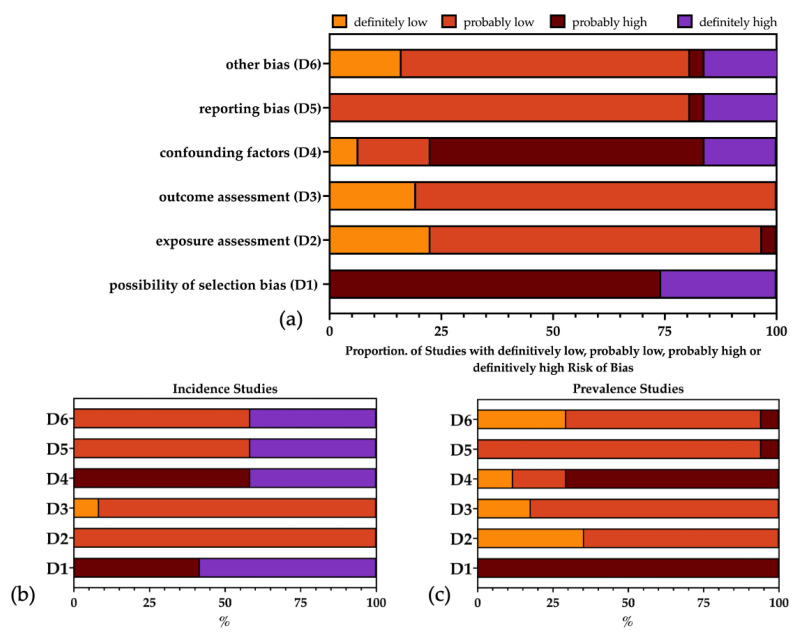
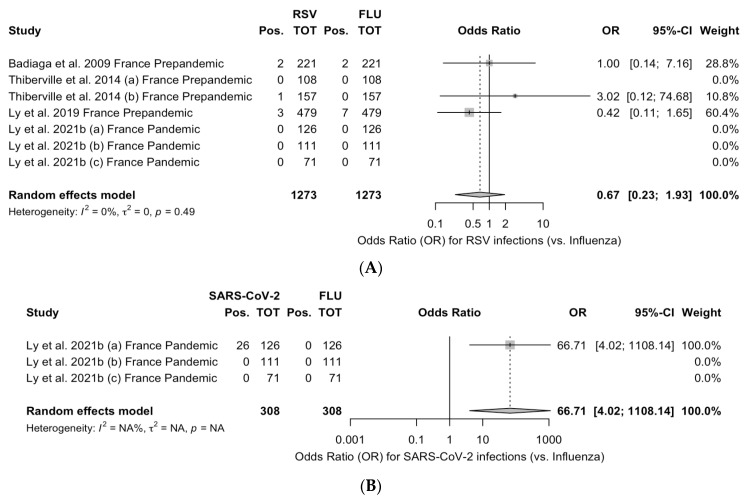
Homeless people (HP) are disproportionally affected by respiratory disorders, including pneumococcal and mycobacterial infections. On the contrary, more limited evidence has been previously gathered on influenza and severe acute respiratory syndrome coronavirus 2 (SARS-CoV-2), and very little is known about the occurrence of human respiratory syncytial virus (RSV), a common cause of respiratory tract infections among children and the elderly. The present systematic review was designed to collect available evidence about RSV, influenza and SARS-CoV-2 infections in HP, focusing on those from urban homeless shelters. Three medical databases (PubMed, Embase and Scopus) and the preprint repository medRxiv.org were therefore searched for eligible observational studies published up to 30 December 2023, and the collected cases were pooled in a random-effects model. Heterogeneity was assessed using the I2 statistics. Reporting bias was assessed by funnel plots and a regression analysis. Overall, 31 studies were retrieved, and of them, 17 reported on the point prevalence of respiratory pathogens, with pooled estimates of 4.91 cases per 1000 HP (95%CI: 2.46 to 9.80) for RSV, 3.47 per 1000 HP for influenza and 40.21 cases per 1000 HP (95%CI: 14.66 to 105.55) for SARS-CoV-2. Incidence estimates were calculated from 12 studies, and SARS-CoV-2 was characterized by the highest occurrence (9.58 diagnoses per 1000 persons-months, 95%CI: 3.00 to 16.16), followed by influenza (6.07, 95%CI: 0.00 to 15.06) and RSV (1.71, 95%CI: 0.00 to 4.13). Only four studies reported on the outcome of viral infections in HP: the assessed pathogens were associated with a high likelihood of hospitalization, while high rates of recurrence and eventual deaths were reported in cases of RSV infections. In summary, RSV, influenza and SARS-CoV-2 infections were documented in HP from urban shelters, and their potential outcomes stress the importance of specifically tailored preventive strategies.
Keywords: RSV; SARS-CoV-2; differential diagnosis; homelessness; influenza; viral pneumonia.
Conflict of interest statement
The authors declare no conflicts of interest.
Figures
Similar articles
-
RSV Infection in Refugees and Asylum Seekers: A Systematic Review and Meta-Analysis.Epidemiologia (Basel). 2024 May 27;5(2):221-249. doi: 10.3390/epidemiologia5020016. Epidemiologia (Basel). 2024. PMID: 38920751 Free PMC article. Review.
-
Occurrence of Central Nervous System Complications of Respiratory Syncytial Virus Infections: A Systematic Review with Meta-Analysis.Epidemiologia (Basel). 2024 Jul 19;5(3):421-455. doi: 10.3390/epidemiologia5030031. Epidemiologia (Basel). 2024. PMID: 39051211 Free PMC article. Review.
-
Respiratory Syncytial Virus Infections in Recipients of Bone Marrow Transplants: A Systematic Review and Meta-Analysis.Infect Dis Rep. 2024 Mar 29;16(2):317-355. doi: 10.3390/idr16020026. Infect Dis Rep. 2024. PMID: 38667752 Free PMC article. Review.
-
Respiratory Syncytial Virus: An Uncommon Cause of Febrile Seizures-Results from a Systematic Review and Meta-Analysis.Pediatr Rep. 2022 Nov 2;14(4):464-478. doi: 10.3390/pediatric14040055. Pediatr Rep. 2022. PMID: 36412662 Free PMC article. Review.
-
Focusing on severe infections with the respiratory syncytial virus (RSV) in adults: Risk factors, symptomatology and clinical course compared to influenza A / B and the original SARS-CoV-2 strain.J Clin Virol. 2023 Apr;161:105399. doi: 10.1016/j.jcv.2023.105399. Epub 2023 Feb 14. J Clin Virol. 2023. PMID: 36863135 Free PMC article.
Cited by
-
RSV Infection in Refugees and Asylum Seekers: A Systematic Review and Meta-Analysis.Epidemiologia (Basel). 2024 May 27;5(2):221-249. doi: 10.3390/epidemiologia5020016. Epidemiologia (Basel). 2024. PMID: 38920751 Free PMC article. Review.
-
Impact of Nirsevimab Immunization on Pediatric Hospitalization Rates: A Systematic Review and Meta-Analysis (2024).Vaccines (Basel). 2024 Jun 8;12(6):640. doi: 10.3390/vaccines12060640. Vaccines (Basel). 2024. PMID: 38932369 Free PMC article. Review.
-
Occurrence of Central Nervous System Complications of Respiratory Syncytial Virus Infections: A Systematic Review with Meta-Analysis.Epidemiologia (Basel). 2024 Jul 19;5(3):421-455. doi: 10.3390/epidemiologia5030031. Epidemiologia (Basel). 2024. PMID: 39051211 Free PMC article. Review.
-
Efficacy of Respiratory Syncytial Virus Vaccination to Prevent Lower Respiratory Tract Illness in Older Adults: A Systematic Review and Meta-Analysis of Randomized Controlled Trials.Vaccines (Basel). 2024 May 5;12(5):500. doi: 10.3390/vaccines12050500. Vaccines (Basel). 2024. PMID: 38793751 Free PMC article. Review.
-
Respiratory Syncytial Virus: A WAidid Consensus Document on New Preventive Options.Vaccines (Basel). 2024 Nov 25;12(12):1317. doi: 10.3390/vaccines12121317. Vaccines (Basel). 2024. PMID: 39771979 Free PMC article. Review.
References
-
- European Centre for Disease Prevention and Control . Guidance on the Provision of Support for Medically and Socially Vulnerable Populations in EU/EEA Countries and the United Kingdom during the COVID-19 Pandemic Key Messages. European Centre for Disease Prevention and Control; Stockholm, Sweden: 2020.
-
- Ly T.D.A., Dao T.L., Hoang V.T., Braunstein D., Brouqui P., Lagier J.-C., Parola P., Gautret P. Pattern of Infections in French and Migrant Homeless Hospitalised at Marseille Infectious Disease Units, France: A Retrospective Study, 2017–2018. Travel Med. Infect. Dis. 2020;36:101768. doi: 10.1016/j.tmaid.2020.101768. - DOI - PubMed
-
- Ly T.D.A., Edouard S., Badiaga S., Tissot-Dupont H., Hoang V.T., Pommier de Santi V., Brouqui P., Raoult D., Gautret P. Epidemiology of Respiratory Pathogen Carriage in the Homeless Population within Two Shelters in Marseille, France, 2015–2017: Cross Sectional 1-Day Surveys. Clin. Microbiol. Infect. 2019;25 doi: 10.1016/j.cmi.2018.04.032. - DOI - PMC - PubMed
-
- Ly T.D.A., Hoang V.T., Goumballa N., Louni M., Canard N., Dao T.L., Medkour H., Borg A., Bardy K., Esteves-Vieira V., et al. Variations in Respiratory Pathogen Carriage among a Homeless Population in a Shelter for Men in Marseille, France, March–July 2020: Cross-Sectional 1-Day Surveys. Eur. J. Clin. Microbiol. Infect. Dis. 2021;40:1579–1582. doi: 10.1007/s10096-020-04127-9. - DOI - PMC - PubMed
Publication types
LinkOut - more resources
Full Text Sources
Research Materials
Miscellaneous
