. 2024 Feb 1;14(1):193-213.
doi: 10.3390/jox14010012.

Early Developmental Exposure to Triclosan Impacts Fecal Microbial Populations, IgA and Functional Activities of the Rat Microbiome

Affiliations

Early Developmental Exposure to Triclosan Impacts Fecal Microbial Populations, IgA and Functional Activities of the Rat Microbiome

Mohamed Lahiani et al. J Xenobiot. .

Abstract

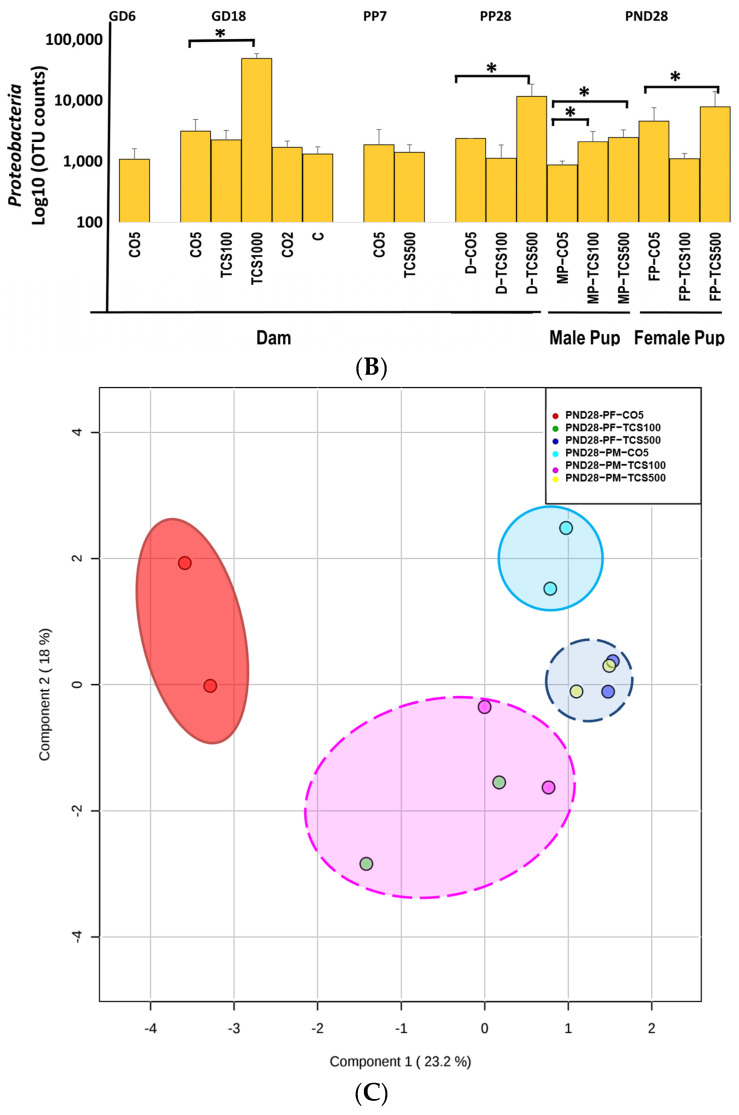
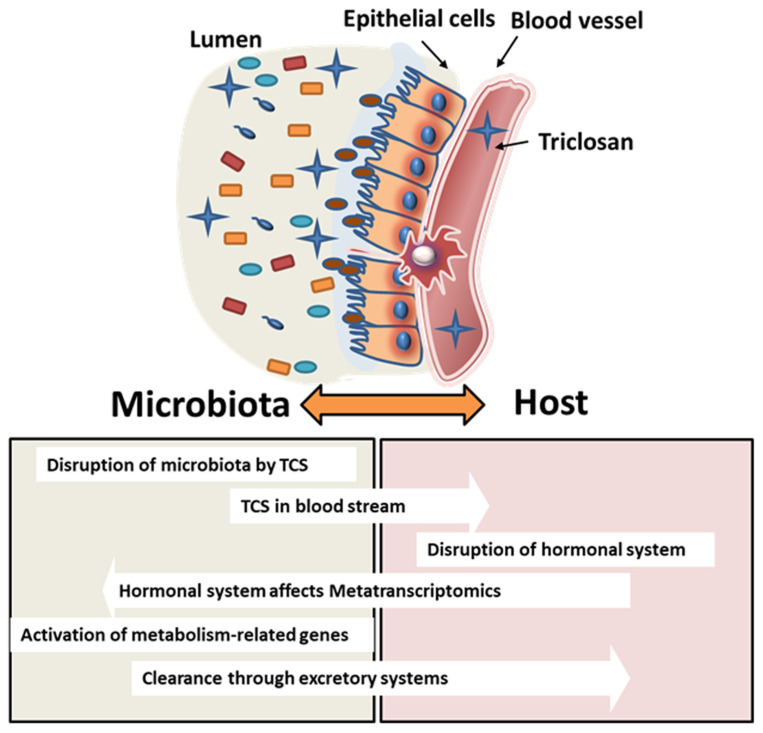
Triclosan (TCS), a broad-spectrum antibacterial chemical, is detected in human urine, breast milk, amniotic fluid, and feces; however, little is known about its impact on the intestinal microbiome and host mucosal immunity during pregnancy and early development. Pregnant female rats were orally gavaged with TCS from gestation day (GD) 6 to postpartum (PP) day 28. Offspring were administered TCS from postnatal day (PND) 12 to 28. Studies were conducted to assess changes in the intestinal microbial population (16S-rRNA sequencing) and functional analysis of microbial genes in animals exposed to TCS during pregnancy (GD18), and at PP7, PP28 and PND28. Microbial abundance was compared with the amounts of TCS excreted in feces and IgA levels in feces. The results reveal that TCS decreases the abundance of Bacteroidetes and Firmicutes with a significant increase in Proteobacteria. At PND28, total Operational Taxonomic Units (OTUs) were higher in females and showed correlation with the levels of TCS and unbound IgA in feces. The significant increase in Proteobacteria in all TCS-treated rats along with the increased abundance in OTUs that belong to pathogenic bacterial communities could serve as a signature of TCS-induced dysbiosis. In conclusion, TCS can perturb the microbiome, the functional activities of the microbiome, and activate mucosal immunity during pregnancy and early development.

Keywords: antimicrobial; endocrine disrupting chemical; fecal IgA; gastrointestinal tract; microbiome; oral exposure; perinatal exposure; postnatal exposure; risk assessment; toxicity; triclosan; xenobiotic.


Conflict of interest statement

The findings and conclusions presented in this manuscript are those of the authors and do not necessarily represent the views of the U.S. Food and Drug Administration or the National Institutes of Health. The authors declare no conflicts of interest.

Figures

Figure 1
Figure 1
Schematic diagram of the study design. Pups were orally gavaged from postnatal day (PND)12 through PND28 at the same dose (100 or 500 mg/kg/day) as that of their dam.
Figure 2
Figure 2
The analysis of intestinal bacterial composition at the phylum level. (A) The relative abundances of major bacterial phyla detected using the 16S rRNA sequencing method. (B) The number of OTUs of Proteobacteria in feces presented after Log10 transformation in dams (D) and pups (P). Error bars show standard error values. All abundance levels are expressed based on OTUs. Comparison is made within each experimental group (GD18, PP28 and PND28). *, p < 0.05 compared to control. (C) For the offspring, microbial assessments were conducted on PND28 pups exposed continuously via gestational, lactational and oral gavage daily from PND12 to 28 with TCS at two different concentrations (100 and 500 mg/kg/day) or control (corn oil 5 mL/kg/day). PCA depicting the differences between the microbiome of male pups (MP) and female pups (FP) before and after exposure to TCS and compared to corn oil control (CO5; 5 mL/kg corn oil). The solid outlines are control (CO5); dashed outlines are treatment groups [TCS100 (pink) or TCS500 (blue)].
Figure 2
Figure 2
The analysis of intestinal bacterial composition at the phylum level. (A) The relative abundances of major bacterial phyla detected using the 16S rRNA sequencing method. (B) The number of OTUs of Proteobacteria in feces presented after Log10 transformation in dams (D) and pups (P). Error bars show standard error values. All abundance levels are expressed based on OTUs. Comparison is made within each experimental group (GD18, PP28 and PND28). *, p < 0.05 compared to control. (C) For the offspring, microbial assessments were conducted on PND28 pups exposed continuously via gestational, lactational and oral gavage daily from PND12 to 28 with TCS at two different concentrations (100 and 500 mg/kg/day) or control (corn oil 5 mL/kg/day). PCA depicting the differences between the microbiome of male pups (MP) and female pups (FP) before and after exposure to TCS and compared to corn oil control (CO5; 5 mL/kg corn oil). The solid outlines are control (CO5); dashed outlines are treatment groups [TCS100 (pink) or TCS500 (blue)].
Figure 3
Figure 3
Heat map of the abundance of bacteria at the genus level based on OTUs. Each colored cell on the map corresponds to an OTU value, with genus in rows and samples in columns. Clustering was performed using Euclidean measurement. Only the top 36 genera that show significant ANOVA values are depicted here. Blue color means decrease in abundance and red color means increase in abundance. Heat map colors show the relative abundances of genera as shown in the scale at the right margin.
Figure 4
Figure 4
The analysis of bacterial composition at the species level. (A) Three-dimensional PCA plot based on OTU abundance levels. (B) Venn diagrams depicting numbers of common bacterial OTUs between different doses of TCS and controls in dams (top panel) and pups (lower panel).
Figure 5
Figure 5
The quantification of TCS in feces using HPLC. The levels of TCS in dams and pups are expressed as μg TCS/mg feces.
Figure 6
Figure 6
The quantification of IgA levels in maternal and offspring feces after exposure to TCS. The level of IgA in rat feces is expressed as ng per mg of feces. IgA U-secretory IgA (blue bars); IgA B = bacteria-bound IgA (orange bars). *, p < 0.05 compared to control. Error bars represent standard error values (n = 3/4).
Figure 7
Figure 7
Functional gene expression abundances of KEGG Level 2 pathways in the gut microbiome. Abundances of functional categories of intestinal bacteria as measured using the metatranscriptomic analysis are provided as the numbers of reads in each experimental group encoding (A) cellular processes, (B) human diseases, (C) genetic information processing, (D) environmental information processing, (E) organismal system and (F) metabolism depicted in the graph. *, p < 0.05 in comparison to corresponding control.
Figure 8
Figure 8
Schematic figure depicting the interaction between the microbiota and the host. TCS exposure may disrupt the microbial colonization on the intestinal mucosa. This may lead to intestinal epithelial cell–cell junction disruption that may lead to increases in TCS absorbed in the blood stream impacting further downstream processes.

References

    1. Food and Drug Adminnistration Safety and effectiveness of consumer antiseptics: Topical antimicrobial drug products for over-the-counter human use. J. Fed. Regist. 2016;81:61106–61130. - PubMed
    1. Weatherly L.M., Gosse J.A. Triclosan exposure, transformation, and human health effects. J. Toxicol. Environ. Health Part B. 2017;20:447–469. doi: 10.1080/10937404.2017.1399306. - DOI - PMC - PubMed
    1. Food and Drug Adminnistration Safety and Effectiveness of Consumer Antiseptics; Topical Antimicrobial Drug Products for Over-the-Counter Human Use; Proposed Amendment of the Tentative Final Monograph; Reopening of Administrative Record. Fed. Regist. 2016;21:42911–42937. - PubMed
    1. Savage J.H., Matsui E.C., Wood R.A., Keet C.A. Urinary levels of triclosan and parabens are associated with aeroallergen and food sensitization. J. Allergy Clin. Immunol. 2012;130:453–460.e7. doi: 10.1016/j.jaci.2012.05.006. - DOI - PMC - PubMed
    1. Ribado J.V., Ley C., Haggerty T.D., Tkachenko E., Bhatt A.S., Parsonnet J. Household triclosan and triclocarban effects on the infant and maternal microbiome. EMBO Mol. Med. 2017;9:1732–1741. doi: 10.15252/emmm.201707882. - DOI - PMC - PubMed

LinkOut - more resources