. 2024 Mar 4;40(3):btae106.
doi: 10.1093/bioinformatics/btae106.

Optimizing representations for integrative structural modeling using Bayesian model selection

Affiliations

Optimizing representations for integrative structural modeling using Bayesian model selection

Shreyas Arvindekar et al. Bioinformatics. .

Abstract

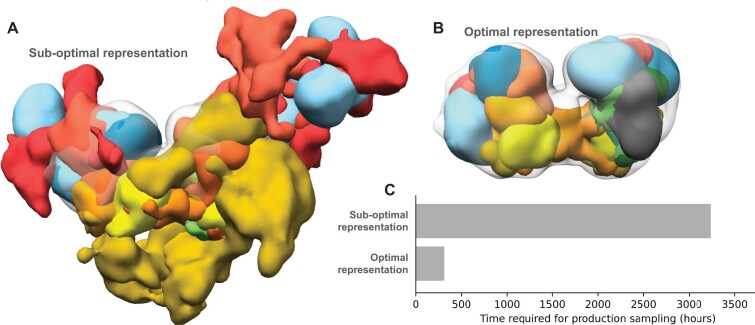
Motivation: Integrative structural modeling combines data from experiments, physical principles, statistics of previous structures, and prior models to obtain structures of macromolecular assemblies that are challenging to characterize experimentally. The choice of model representation is a key decision in integrative modeling, as it dictates the accuracy of scoring, efficiency of sampling, and resolution of analysis. But currently, the choice is usually made ad hoc, manually.

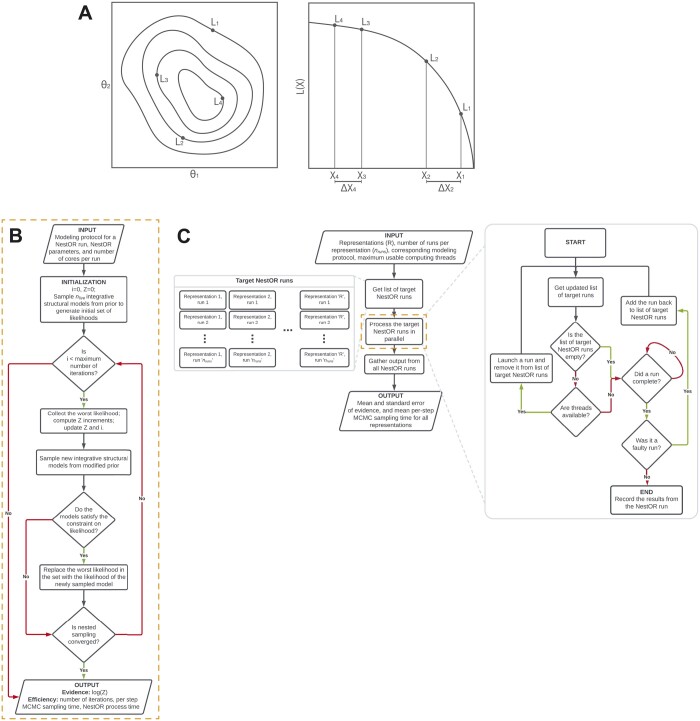
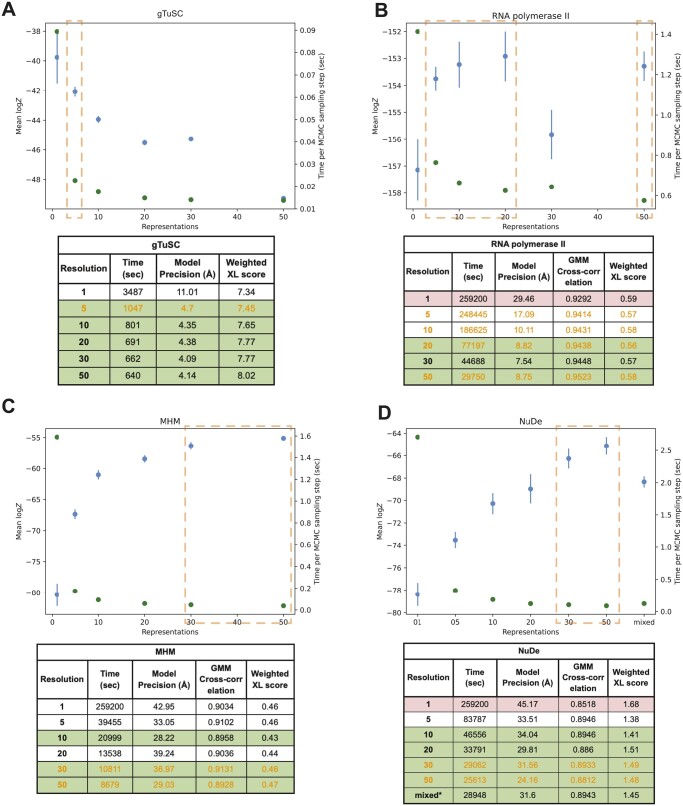
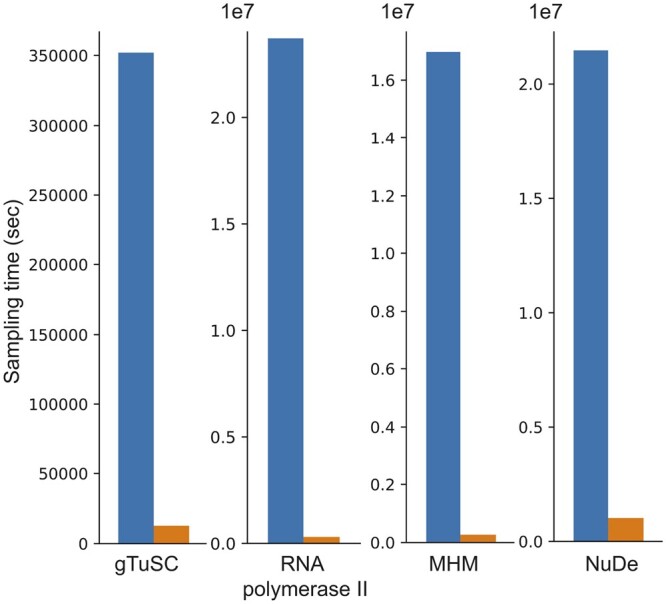
Results: Here, we report NestOR (Nested Sampling for Optimizing Representation), a fully automated, statistically rigorous method based on Bayesian model selection to identify the optimal coarse-grained representation for a given integrative modeling setup. Given an integrative modeling setup, it determines the optimal representations from given candidate representations based on their model evidence and sampling efficiency. The performance of NestOR was evaluated on a benchmark of four macromolecular assemblies.

Availability and implementation: NestOR is implemented in the Integrative Modeling Platform (https://integrativemodeling.org) and is available at https://github.com/isblab/nestor. Data for the benchmark is at https://www.doi.org/10.5281/zenodo.10360718.


Conflict of interest statement

None declared.

Figures

Figure 1.
Figure 1.
Effects of using sub-optimal representations for integrative modeling. Integrative models of the nucleosome deacetylase (NuDe) complex were produced using two coarse-grained representations, one comprising 1-residue per bead and another comprising 50-residues per bead. The former representation was sub-optimal based on the fit to EM map of the resulting models and the sampling efficiency. Localization probability densities (LPDs) of protein domains of the NuDe complex modeled using coarse-grained representations with (A) 1-residue beads (sub-optimal representation) and (B) 50-residue beads (optimal representation). The densities are superposed on the input EM map (grey, EMDB: 22904) contoured at the recommended threshold. The LPDs are contoured at 10% of their maximum threshold values. (C) Time for production sampling of models based on the two representations.
Figure 2.
Figure 2.
Schematic of nested sampling method for optimizing integrative model representation (NestOR). (A) A schematic representation showing the application of Nested Sampling (NS) to a 2D problem. The iso-likelihood contours for the points with likelihoods L1, L2, L3, and L4 are shown in the left panel. Their mapping to corresponding prior mass values, X1, X2, X3, and X4, respectively, is shown in the right panel. The panel to the right represents the L versus X plot for these points. (B) Flowchart describing an individual nested sampling run. Initialized with the modeling protocol, nested sampling parameters, and the number of cores per run, each NestOR run iteratively accumulates model evidence till nested sampling converges. Once converged, it returns the model evidence and measures of efficiency: time taken for a single MCMC step in IMP using the representation (per-step MCMC sampling time), and time taken by NestOR for the run (NestOR process time). (C) Flowchart describing the overall parallelized workflow of NestOR. Given an integrative modeling setup with candidate representations (R), their modeling protocol, the number of runs per representation (nruns), and maximum usable threads, NestOR computes the mean model evidence and the mean per-step model sampling time for all candidate representations in parallel. The results of each independent run per representation, computed in the orange box; described in panel B, are aggregated to produce the mean values from the overall workflow in panel C.
Figure 3.
Figure 3.
Performance of NestOR on the benchmark. Candidate coarse-grained representations of uniform resolutions (1-, 5-, 10-, 20-, 30-, 50- residues per bead) are compared for each system (A. gTuSC, B. RNA polymerase II, C. MHM and D. NuDe). In addition, a mixed resolution representation was evaluated for NuDe. The output of NestOR, i.e. the mean of log model evidence and its standard error (blue), and the mean time per Replica Exchange MCMC step (green) is plotted for each system. Based on these two criteria, the optimal representation(s) inferred from NestOR are highlighted in orange dashed boxes. The tables accompanying each plot show the results from full-length production sampling for each candidate representation for each system: the time required per independent sampling run, model precision, and fit to data based on the average crosslink score in the major cluster, and the cross-correlation of the EM map with the localization densities of the major cluster. The optimal representations based on the results from full-length production sampling are highlighted in green, whereas representations for which sampling was not exhaustive in the given time are in red. All times are on an AMD Ryzen Threadripper 3990X 64-Core Processor with 256 GB RAM and 2.2 GHz clock speed. Four computing threads were used for each system, except for gTuSC where six threads were used.
Figure 4.
Figure 4.
NestOR efficiency. The total time required for full-length production sampling of models using all candidate representations for each system (blue) is compared with the total time required by NestOR (orange). Production sampling consisted of 50 (28) independent Replica Exchange MCMC runs for gTuSC, MHM, and NuDe (RNA polymerase II). NestOR was run with previously set parameters (5 runs, 50 live points, 50 RE-MCMC steps per iteration) for each candidate representation till a convergence criterion was met. All times are on an AMD Ryzen Threadripper 3990X 64-Core Processor with 256 GB RAM and 2.2 GHz clock speed.
Figure 5.
Figure 5.
Robustness to the choice of prior. NestOR outputs, i.e. the evidence estimates and associated uncertainties, were compared for three different priors (orange, green, blue), on two systems, (A) MHM, and (B) NuDe. Each prior comprised a random subset of 30% of a set of input crosslinks, in addition to stereochemistry restraints.

Update of

Similar articles

Cited by

References

    1. Alber F, Dokudovskaya S, Veenhoff LM. et al. Determining the architectures of macromolecular assemblies. Nature 2007;450:683–94. - PubMed
    1. Armache K-J, Mitterweger S, Meinhart A. et al. Structures of complete RNA polymerase II and its subcomplex, Rpb4/7. J Biol Chem 2005;280:7131–4. - PubMed
    1. Arvindekar S, Jackman MJ, Low JKK. et al. Molecular architecture of nucleosome remodeling and deacetylase Sub-complexes by integrative structure determination. Protein Sci 2022;31:e4387. - PMC - PubMed
    1. Ashton G, Bernstein N, Buchner J. et al. Nested sampling for physical scientists. Nat Rev Methods Primers 2022;2:39.
    1. Bonomi M, Hanot S, Greenberg CH. et al. Bayesian weighing of electron cryo-microscopy data for integrative structural modeling. Structure 2019;27:175–88.e6. - PMC - PubMed

MeSH terms

Substances