. 2024 Mar 12;92(3):e0003824.
doi: 10.1128/iai.00038-24. Epub 2024 Feb 23.

Contribution of Hfq to gene regulation and virulence in Histophilus somni

Affiliations

Contribution of Hfq to gene regulation and virulence in Histophilus somni

Dianjun Cao et al. Infect Immun. .

Abstract

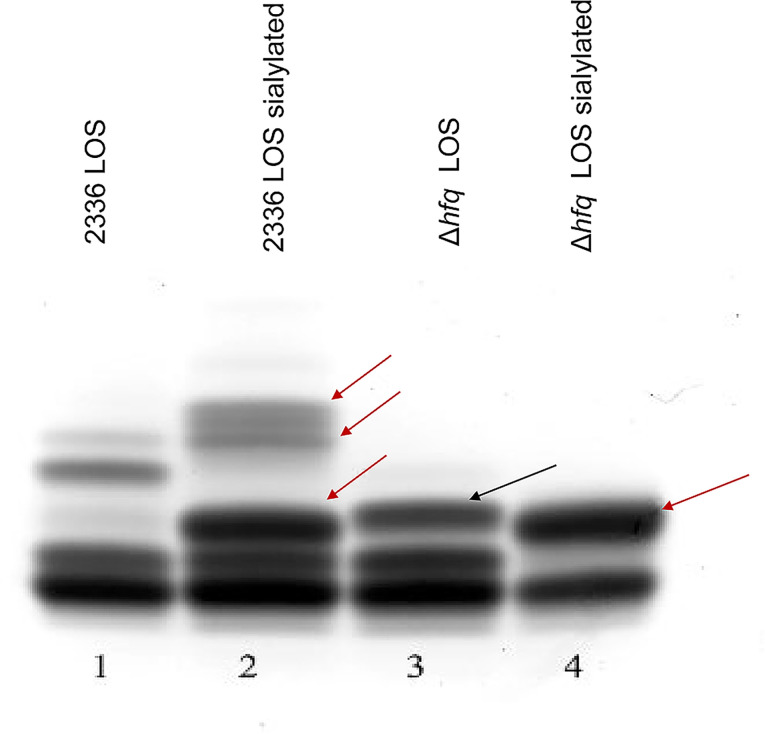
Histophilus somni is one of the predominant bacterial pathogens responsible for bovine respiratory and systemic diseases in cattle. Despite the identification of numerous H. somni virulence factors, little is known about the regulation of such factors. The post-transcriptional regulatory protein Hfq may play a crucial role in regulation of components that affect bacterial virulence. The contribution of Hfq to H. somni phenotype and virulence was investigated following creation of an hfq deletion mutant of H. somni strain 2336 (designated H. somni 2336Δhfq). A comparative analysis of the mutant to the wild-type strain was carried out by examining protein and carbohydrate phenotype, RNA sequence, intracellular survival in bovine monocytes, serum susceptibility, and virulence studies in mouse and calf models. H. somni 2336Δhfq exhibited a truncated lipooligosaccharide (LOS) structure, with loss of sialylation. The mutant demonstrated increased susceptibility to intracellular and serum-mediated killing compared to the wild-type strain. Transcriptomic analysis displayed significant differential expression of 832 upregulated genes and 809 downregulated genes in H. somni 2336Δhfq compared to H. somni strain 2336, including significant downregulation of lsgB and licA, which contribute to LOS oligosaccharide synthesis and sialylation. A substantial number of differentially expressed genes were associated with polysaccharide synthesis and other proteins that could influence virulence. The H. somni 2336Δhfq mutant strain was attenuated in a mouse septicemia model and somewhat attenuated in a calf intrabronchial challenge model. H. somni was recovered less frequently from nasopharyngeal swabs, endotracheal aspirates, and lung tissues of calves challenged with H. somni 2336Δhfq compared to the wild-type strain, and the percentage of abnormal lung tissue in calves challenged with H. somni 2336Δhfq was lower than in calves challenged with the wild-type strain. In conclusion, our results support that Hfq accounts for the regulation of H. somni virulence factors.

Keywords: Hfq; Histophilus somni; biofilm; gene regulation; lipooligosaccharide; virulence.


Conflict of interest statement

The authors declare no conflict of interest.

Figures

Fig 1
Fig 1
Growth curves of H. somni strain 2336, H. somni 2336Δhfq, and H. somni 2336 ΔhfqComp. (A) H. somni strain 2336, H. somni 2336Δhfq, and H. somni 2336ΔhfqComp were grown in side arm flasks and the density measured in Klett units over 7 h; (B) H. somni strain 2336 and H. somni 2336Δhfq were grown in 96-well plates and the density measured at OD600 in a GloMax plate reader spectrophotometer over 24 h. All tests were repeated three times, and standard deviations calculated using GraphPad Prism 7 software.
Fig 2
Fig 2
Biofilm architecture of H. somni strain 2336 and H. somni 2336Δhfq by CLSM. The biofilm architecture of H. somni strain 2336 and H. somni 2336Δhfq was visualized using CLSM. The CLSM images shown are representative of three images each for the 5-day-old biofilms formed by H. somni strain 2336 (A and B) and H. somni 2336Δhfq (C and D). The images are displayed under the orthogonal (A and C) and topographical (B and D) views following FISH using an H. somni oligonucleotide 16S rRNA probe labeled with Texas Red.
Fig 3
Fig 3
COMSTAT analysis of biofilms formed by H. somni strains 2336 and 2336Δhfq. (A) Mean biomass, (B) mean average thickness, (C) roughness coefficient, and (D) surface to biovolume ratio. All tests were repeated in triplicate. The error bars represent the 95% confidence intervals of the mean and standard deviation. Statistical significance was determined by two-tailed t-tests using GraphPad Prism 7; *, P < 0.05; ***, P < 0.001.
Fig 4
Fig 4
LOS electrophoretic profile of H. somni strain 2336 and H. somni 2336Δhfq. H. somni was grown with or without sialic acid (to sialylate terminal galactose residues) and the LOS extracted by a mini phenol-water protocol. LOS profiles were resolved by electrophoresis through 15% polyacrylamide gels and stained with ammoniacal silver. The red arrows point to sialylated LOS bands, indicating a terminal galactose moiety on the oligosaccharide. The slightly larger highest molecular size band in the LOS of H. somni 2336Δhfq indicates a minor structural change may have occurred. There was not a substantial change in the LOS profile of the complemented mutant compared to H. somni 2336Δhfq (not shown).
Fig 5
Fig 5
Outer membrane protein profiles of H. somni strain 2336 and H. somni 2336Δhfq. Protein-enriched outer membranes were extracted from bacterial total membranes using sodium dodecyl sarcosinate and differential ultracentrifugation. (A) SDS-PAGE gel of protein-enriched outer membranes extracted from H. somni strain 2336 and H. somni 2336Δhfq. Each lane was loaded with 5 µg or 7 µg of protein for improved resolution of specific bands. Red arrows point to protein bands present in H. somni strain 2336, but missing or reduced in quantity in H. somni 2336Δhfq. (B) Relative density analysis of the major outer membrane proteins using ImageJ software. Each number in the left column refers to protein bands labeled by red numbers in the center of Fig. 5A.
Fig 6
Fig 6
Diminished serum resistance and phagocytosis of H. somni 2336Δhfq. (A) Serum susceptibility of H. somni strain 2336 and H. somni 2336Δhfq. Log phase cultures of H. somni strain 2336 and H. somni 2336Δhfq were both adjusted to 104 CFU/mL and incubated in various concentrations of bovine serum and 20% precolostral calf serum (as a complement source). Viable plate counts were done at 0 min (before incubation) and after 60-min incubation at 37°C. (B) Phagocytosis and survival of H. somni strain 2336 and H. somni 2336Δhfq in bovine peripheral blood monocytes (BPBMs). H. somni strain 2336 and H. somni 2336Δhfq were incubated with BPBM, extracellular cells were killed with gentamicin, BPBMs were lysed, and viable plate counts were determined after 0-min and 60-min incubation to determine survival within BPBMs. BPBMs incubated with bacteria and cytochalasin D (to prevent phagocytosis) were used as a control to account for any surviving adherent bacteria. Three to five replicates of each assay were completed for statistical analyses using GraphPad Prism 7. *P < 0.05, **P < 0.01, ***P < 0.001.
Fig 7
Fig 7
Differential gene expression of H. somni strain 2336 and H. somni 2336Δhfq. (A) PCA. The PCA plot shows the clustering pattern of gene expression profiles between H. somni strain 2336 and H. somni 2336Δhfq. Each dot represents a sample, and the position of the dots in the plot reflects the overall similarity or dissimilarity of the gene expression patterns. (B) MA plot: The MA plot (log-intensity ratios vs log-intensity averages) displays the mean normalized counts (x-axis) against the log2-fold change (y-axis) for all the genes analyzed. Red dots represent genes that are significantly differentially expressed (adjusted P-value <0.05) in H. somni 2336Δhfq compared to H. somni strain 2336, as determined using DEseq2 package ver. 1.12.3. This plot directly shows the differential expression of genes between H. somni strain 2336 and H. somni 2336Δhfq.
Fig 8
Fig 8
Gene expression heatmap of genes involved in EPS production by H. somni strain 2336 and H. somni 2336Δhfq. The heatmap displays the hierarchical clustering of differentially expressed genes responsible for expression of the biofilm EPS between H. somni strain 2336 and H. somni 2336Δhfq. Each row represents a gene, and each column represents a sample. The color scale represents the log2-fold change, from yellow to blue indicating the upregulation and downregulation levels of gene expression, respectively.
Fig 9
Fig 9
Average (±SD) respiratory rates of calves before and after challenge with H. somni strain 2336, H. somni 2336Δhfq, or sterile saline only (mock). Calves were challenged with 1.4–2 × 10⁹ CFU/mL on day 0 by intrabronchial instillation of 10 mL of the specific inoculum. Respiratory rates were not statistically significantly different between groups (P > 0.05).
Fig 10
Fig 10
Percent abnormal lung in calves challenged with H. somni strain 2336, H. somni 2336Δhfq, or mock-challenged calves. Calves were challenged by intrabronchial instillation with a log phase culture of H. somni strain 2336 (wild-type) or H. somni 2336Δhfq (mutant), or sterile saline + 5% fetal calf serum (mock). The percent abnormal lung by lobe (A) and for all lung lobes (B) is shown. The percent abnormal lung in the wild-type and mutant groups was not significantly different (P > 0.05).
Fig 11
Fig 11
Gross and microscopic lung lesions in calves challenged with H. somni strain 2336, H. somni 2336Δhfq, or mock-challenged calves. Calves were challenged by intrabronchial instillation with a log phase culture of H. somni strain 2336 (wild-type), H. somni 2336Δhfq (mutant), or sterile saline + 5% fetal calf serum (mock). Representative gross lung pathology from calves inoculated with mutant (A) or wild-type (B) compared to mock (C) is shown. Grossly, the mutant and wild-type lung had multifocal to locally extensive dark red depressed areas, which corresponded histologically to abundant neutrophils within bronchioles and alveoli with alveolar collapse (D). In all three calves challenged with the wild-type, and one calf challenged with the mutant, there was marked consolidation of the diaphragmatic lobe which corresponded histologically to large areas of necrosis with abundant fibrin and edema (E). Mock-infected calves had rare areas of alveolar collapse with largely normal alveoli (F). Hematoxylin and eosin stain, scale bar = 100 µm.

Similar articles

Cited by

References

    1. Griffin D, Chengappa MM, Kuszak J, McVey DS. 2010. Bacterial pathogens of the bovine respiratory disease complex. Vet Clin North Am Food Anim Pract 26:381–394. doi:10.1016/j.cvfa.2010.04.004 - DOI - PubMed
    1. O’Toole D, Sondgeroth KS. 2016. Histophilosis as a natural disease. Curr Top Microbiol Immunol 396:15–48. doi:10.1007/82_2015_5008 - DOI - PMC - PubMed
    1. Inzana TJ. 2016. The many facets of lipooligosaccharide as a virulence factor for Histophilus somni. Curr Top Microbiol Immunol 396:131–148. doi:10.1007/82_2015_5020 - DOI - PubMed
    1. Petruzzi B, Inzana TJ. 2016. Exopolysaccharide production and biofilm formation by Histophilus somni. Curr Top Microbiol Immunol 396:149–160. doi:10.1007/82_2015_5013 - DOI - PubMed
    1. Corbeil LB. 2016. Histophilus somni surface proteins. Curr Top Microbiol Immunol 396:89–107. doi:10.1007/82_2015_5011 - DOI - PubMed

Publication types

LinkOut - more resources