Observational Study
. 2024 Mar;6(2):e230029.
doi: 10.1148/rycan.230029.

Quantitative US Delta Radiomics to Predict Radiation Response in Individuals with Head and Neck Squamous Cell Carcinoma

Affiliations
Observational Study

Quantitative US Delta Radiomics to Predict Radiation Response in Individuals with Head and Neck Squamous Cell Carcinoma

Laurentius Oscar Osapoetra et al. Radiol Imaging Cancer. 2024 Mar.

Abstract

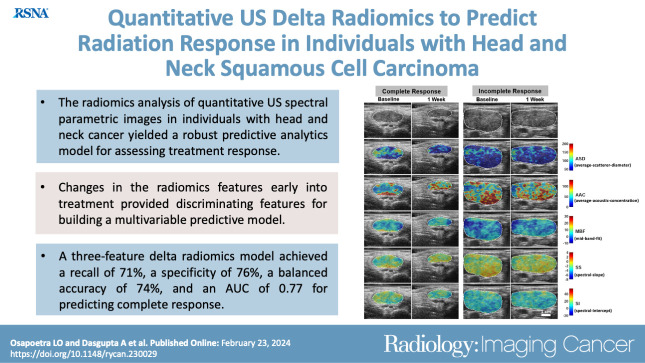
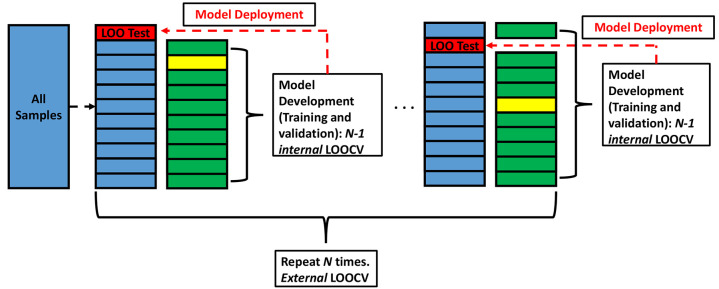
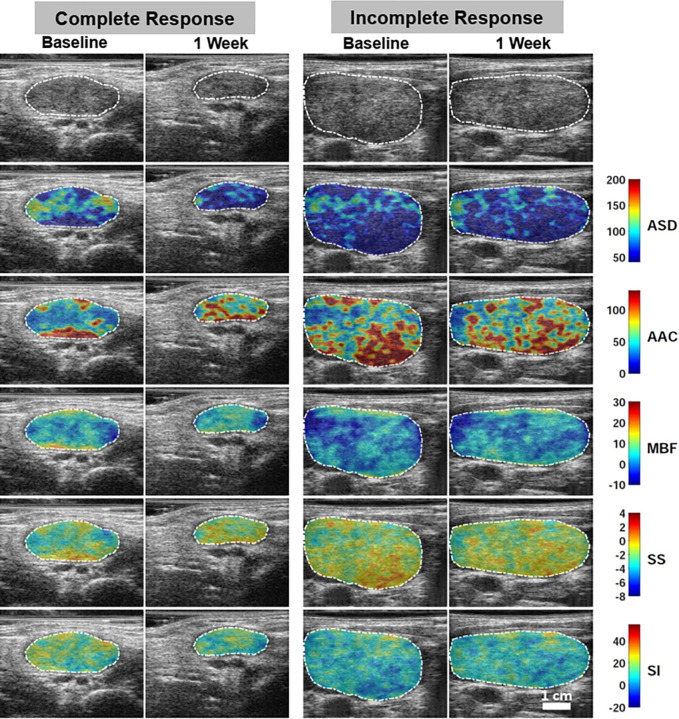
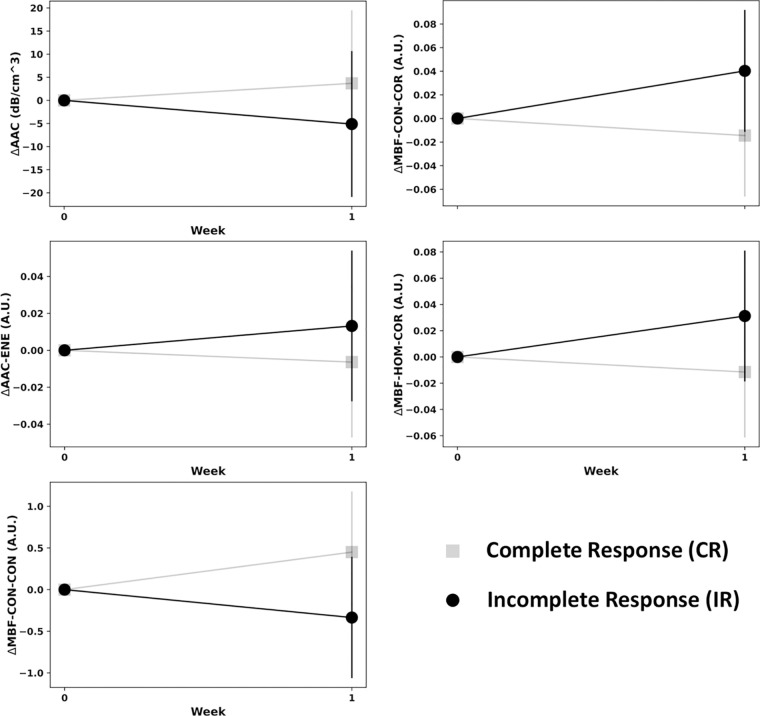
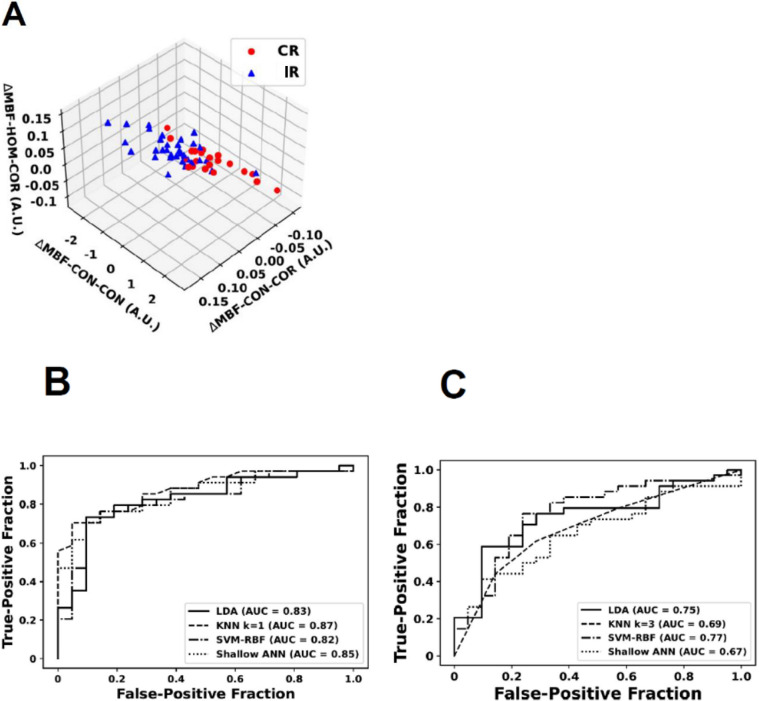
Purpose To investigate the role of quantitative US (QUS) radiomics data obtained after the 1st week of radiation therapy (RT) in predicting treatment response in individuals with head and neck squamous cell carcinoma (HNSCC). Materials and Methods This prospective study included 55 participants (21 with complete response [median age, 65 years {IQR: 47-80 years}, 20 male, one female; and 34 with incomplete response [median age, 59 years {IQR: 39-79 years}, 33 male, one female) with bulky node-positive HNSCC treated with curative-intent RT from January 2015 to October 2019. All participants received 70 Gy of radiation in 33-35 fractions over 6-7 weeks. US radiofrequency data from metastatic lymph nodes were acquired prior to and after 1 week of RT. QUS analysis resulted in five spectral maps from which mean values were extracted. We applied a gray-level co-occurrence matrix technique for textural analysis, leading to 20 QUS texture and 80 texture-derivative parameters. The response 3 months after RT was used as the end point. Model building and evaluation utilized nested leave-one-out cross-validation. Results Five delta (Δ) parameters had statistically significant differences (P < .05). The support vector machines classifier achieved a sensitivity of 71% (15 of 21), a specificity of 76% (26 of 34), a balanced accuracy of 74%, and an area under the receiver operating characteristic curve of 0.77 on the test set. For all the classifiers, the performance improved after the 1st week of treatment. Conclusion A QUS Δ-radiomics model using data obtained after the 1st week of RT from individuals with HNSCC predicted response 3 months after treatment completion with reasonable accuracy. Keywords: Computer-Aided Diagnosis (CAD), Ultrasound, Radiation Therapy/Oncology, Head/Neck, Radiomics, Quantitative US, Radiotherapy, Head and Neck Squamous Cell Carcinoma, Machine Learning Clinicaltrials.gov registration no. NCT03908684 Supplemental material is available for this article. © RSNA, 2024.

Keywords: Computer-Aided Diagnosis (CAD); Head and Neck Squamous Cell Carcinoma; Head/Neck; Machine Learning; Quantitative US; Radiation Therapy/Oncology; Radiomics; Radiotherapy; Ultrasound.


Conflict of interest statement

Disclosures of conflicts of interest: L.O.O. No relevant relationships. A.D. No relevant relationships. D.D. Worked in the lab and assisted with study materials. K.F. No relevant relationships. M.S. No relevant relationships. I.K. No relevant relationships. I.P. No relevant relationships. Z.H. Honoraria and travel support from the American Head and Neck Society, the American Society of Clinical Oncology, the American Society for Radiation Oncology, and the Society for Immunotherapy of Cancer for attending the Multidisciplinary Head and Neck Cancer Symposium. W.T.T. No relevant relationships. L.S. No relevant relationships. G.J.C. No relevant relationships.

Figures

None
Graphical abstract
Model building and evaluation strategy. We created n external
leave-one-out cross-validation (LOOCV) partitions from all samples. For each
fold, we have n-1 samples for model development and a single LOO test
sample, which we kept hidden for final model evaluation. From the n-1
samples, we created n-1 internal LOOCV partitions, where we fitted a
classifier model on the n-2 samples and evaluated its performance on an
out-of-sample LOO validation sample. We fitted n-1 models each time on
different n-2 samples and eventually averaged the prediction score from all
the n-1 LOO test samples. We chose the final model as one that resulted in
the highest average validation performance. The selected model then predicts
the output of the previously hidden LOO test sample. This provides an
objective assessment of model performance in production, when predicting new
unseen samples. This strategy is robust against overfitting especially when
dealing with data in the limited sample regimen, as indicated by Vabalas et
al (40). This strategy effectively uses n-2 training samples (highlighted in
green) for fitting a classifier, one validation sample (highlighted in
yellow) for selecting a model and its hyperparameters, and one test sample
(highlighted in red) for assessment of model generalization beyond the
development samples. Model development that includes feature
standardization, filter-based feature selection, data balancing, and
wrapper-based feature selection utilized n-2 training samples. Model
selection and hyperparameter optimization were based on the average LOO
validation set performance. Subsequently, we tested the final selected model
on each LOO test sample. We aggregated the prediction scores from all LOO
test samples to produce the final test confusion matrix, from which
classification metrics can be derived.
Figure 1:
Model building and evaluation strategy. We created n external leave-one-out cross-validation (LOOCV) partitions from all samples. For each fold, we have n-1 samples for model development and a single LOO test sample, which we kept hidden for final model evaluation. From the n-1 samples, we created n-1 internal LOOCV partitions, where we fitted a classifier model on the n-2 samples and evaluated its performance on an out-of-sample LOO validation sample. We fitted n-1 models each time on different n-2 samples and eventually averaged the prediction score from all the n-1 LOO test samples. We chose the final model as one that resulted in the highest average validation performance. The selected model then predicts the output of the previously hidden LOO test sample. This provides an objective assessment of model performance in production, when predicting new unseen samples. This strategy is robust against overfitting especially when dealing with data in the limited sample regimen, as indicated by Vabalas et al (40). This strategy effectively uses n-2 training samples (highlighted in green) for fitting a classifier, one validation sample (highlighted in yellow) for selecting a model and its hyperparameters, and one test sample (highlighted in red) for assessment of model generalization beyond the development samples. Model development that includes feature standardization, filter-based feature selection, data balancing, and wrapper-based feature selection utilized n-2 training samples. Model selection and hyperparameter optimization were based on the average LOO validation set performance. Subsequently, we tested the final selected model on each LOO test sample. We aggregated the prediction scores from all LOO test samples to produce the final test confusion matrix, from which classification metrics can be derived.
Representative B-mode US and quantitative US (QUS) spectral parametric
images of average scatterer diameter (ASD), average acoustic concentration
(AAC), midband fit (MBF), spectral slope (SS), and spectral intercept (SI)
in one participant (a 74-year-old woman) with complete response (left two
columns) and one participant (a 61-year-old man) with incomplete response
(right two columns) acquired at baseline (before radiation therapy) and
after week 1 of radiation therapy. QUS parametric images include the largest
involved cervical lymph node (central region bounded by closed dotted white
curve). The color bar range is 160 µm for ASD, 130 dB/cm3 for AAC, 40
dB for MBF, 12 dB/MHz for SS, and 75 dB for SI. The scale bar represents 1
cm.
Figure 2:
Representative B-mode US and quantitative US (QUS) spectral parametric images of average scatterer diameter (ASD), average acoustic concentration (AAC), midband fit (MBF), spectral slope (SS), and spectral intercept (SI) in one participant (a 74-year-old woman) with complete response (left two columns) and one participant (a 61-year-old man) with incomplete response (right two columns) acquired at baseline (before radiation therapy) and after week 1 of radiation therapy. QUS parametric images include the largest involved cervical lymph node (central region bounded by closed dotted white curve). The color bar range is 160 µm for ASD, 130 dB/cm3 for AAC, 40 dB for MBF, 12 dB/MHz for SS, and 75 dB for SI. The scale bar represents 1 cm.
Changes of the mean feature values for parameters with statistically
significantly different values between participants with complete response
(gray) and incomplete response (black) after 1 week of radiation therapy.
The feature estimates for the two response groups have been normalized to
the same value before starting radiation therapy, and the relative changes
in the mean parameter values with 95% CIs are indicated at a week 1 time
point. The representative features include ΔAAC (change in the mean
value of average acoustic concentration map), ΔAAC-ENE (change in the
energy texture of average acoustic concentration map), ΔMBF-CON-CON
(change in the contrast texture of contrast map of midband fit),
ΔMBF-CON-COR (change in the correlation texture of contrast map of
midband fit), and ΔMBF-HOM-COR (change in the correlation texture of
homogeneity map of midband fit). A.U. = arbitrary units.
Figure 3:
Changes of the mean feature values for parameters with statistically significantly different values between participants with complete response (gray) and incomplete response (black) after 1 week of radiation therapy. The feature estimates for the two response groups have been normalized to the same value before starting radiation therapy, and the relative changes in the mean parameter values with 95% CIs are indicated at a week 1 time point. The representative features include ΔAAC (change in the mean value of average acoustic concentration map), ΔAAC-ENE (change in the energy texture of average acoustic concentration map), ΔMBF-CON-CON (change in the contrast texture of contrast map of midband fit), ΔMBF-CON-COR (change in the correlation texture of contrast map of midband fit), and ΔMBF-HOM-COR (change in the correlation texture of homogeneity map of midband fit). A.U. = arbitrary units.
(A) Scatterplots in three-dimensional plane using three delta
quantitative US features: ΔMBF-CON-COR (change in the correlation
texture of contrast map of midband fit), ΔMBF-CON-CON (change in the
contrast texture of contrast map of midband fit), and ΔMBF-HOM-COR
(change in the correlation texture of homogeneity map of midband fit). Red
circles show the participants with complete response (CR), while blue
triangles represent those with incomplete response (IR). (B, C) Receiver
operating characteristic plots for the radiomics models using different
machine learning classifiers for the validation and test set, respectively.
The classifiers included LDA, KNN (k = 3), SVM-RBF, and a shallow ANN. ANN =
artificial neural network, A.U. = arbitrary units, AUC = area under the
receiver operating characteristic curve, KNN = k-nearest neighbors, LDA =
linear discriminant analysis, SVM-RBF = support vector machine–radial
basis function.
Figure 4:
(A) Scatterplots in three-dimensional plane using three delta quantitative US features: ΔMBF-CON-COR (change in the correlation texture of contrast map of midband fit), ΔMBF-CON-CON (change in the contrast texture of contrast map of midband fit), and ΔMBF-HOM-COR (change in the correlation texture of homogeneity map of midband fit). Red circles show the participants with complete response (CR), while blue triangles represent those with incomplete response (IR). (B, C) Receiver operating characteristic plots for the radiomics models using different machine learning classifiers for the validation and test set, respectively. The classifiers included LDA, KNN (k = 3), SVM-RBF, and a shallow ANN. ANN = artificial neural network, A.U. = arbitrary units, AUC = area under the receiver operating characteristic curve, KNN = k-nearest neighbors, LDA = linear discriminant analysis, SVM-RBF = support vector machine–radial basis function.

Similar articles

Cited by

References

    1. Lambin P , Rios-Velazquez E , Leijenaar R , et al. . Radiomics: extracting more information from medical images using advanced feature analysis . Eur J Cancer 2012. ; 48 ( 4 ): 441 – 446 . - PMC - PubMed
    1. Gillies RJ , Kinahan PE , Hricak H . Radiomics: Images are more than pictures, they are data . Radiology 2016. ; 278 ( 2 ): 563 – 577 . - PMC - PubMed
    1. Lambin P , Leijenaar RTH , Deist TM , et al. . Radiomics: the bridge between medical imaging and personalized medicine . Nat Rev Clin Oncol 2017. ; 14 ( 12 ): 749 – 762 . - PubMed
    1. Mamou J , Oelze ML , eds. Quantitative ultrasound in soft tissues . advances in experimental medicine and biology series . 2nd ed. Springer; , 2023. .
    1. Czarnota GJ , Kolios MC , Abraham J , et al. . Ultrasound imaging of apoptosis: high-resolution non-invasive monitoring of programmed cell death in vitro, in situ and in vivo . Br J Cancer 1999. ; 81 ( 3 ): 520 – 527 . - PMC - PubMed

Publication types

Associated data