Elucidating Multimodal Imaging Patterns in Accelerated Brain Aging: Heterogeneity through a Discriminant Analysis Approach Using the UK Biobank Dataset
- PMID: 38391610
- PMCID: PMC10886122
- DOI: 10.3390/bioengineering11020124
Elucidating Multimodal Imaging Patterns in Accelerated Brain Aging: Heterogeneity through a Discriminant Analysis Approach Using the UK Biobank Dataset
Abstract
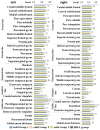
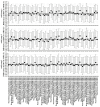
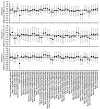
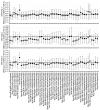
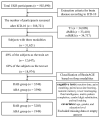
Accelerated brain aging (ABA) intricately links with age-associated neurodegenerative and neuropsychiatric diseases, emphasizing the critical need for a nuanced exploration of heterogeneous ABA patterns. This investigation leveraged data from the UK Biobank (UKB) for a comprehensive analysis, utilizing structural magnetic resonance imaging (sMRI), diffusion magnetic resonance imaging (dMRI), and resting-state functional magnetic resonance imaging (rsfMRI) from 31,621 participants. Pre-processing employed tools from the FMRIB Software Library (FSL, version 5.0.10), FreeSurfer, DTIFIT, and MELODIC, seamlessly integrated into the UKB imaging processing pipeline. The Lasso algorithm was employed for brain-age prediction, utilizing derived phenotypes obtained from brain imaging data. Subpopulations of accelerated brain aging (ABA) and resilient brain aging (RBA) were delineated based on the error between actual age and predicted brain age. The ABA subgroup comprised 1949 subjects (experimental group), while the RBA subgroup comprised 3203 subjects (control group). Semi-supervised heterogeneity through discriminant analysis (HYDRA) refined and characterized the ABA subgroups based on distinctive neuroimaging features. HYDRA systematically stratified ABA subjects into three subtypes: SubGroup 2 exhibited extensive gray-matter atrophy, distinctive white-matter patterns, and unique connectivity features, displaying lower cognitive performance; SubGroup 3 demonstrated minimal atrophy, superior cognitive performance, and higher physical activity; and SubGroup 1 occupied an intermediate position. This investigation underscores pronounced structural and functional heterogeneity in ABA, revealing three subtypes and paving the way for personalized neuroprotective treatments for age-related neurological, neuropsychiatric, and neurodegenerative diseases.
Keywords: accelerated brain aging; advanced brain aging; heterogeneity; structural MRI; subtypes.
Conflict of interest statement
The authors declare no conflicts of interest.
Figures



Similar articles
-
Understanding the Temporal Dynamics of Accelerated Brain Aging and Resilient Brain Aging: Insights from Discriminative Event-Based Analysis of UK Biobank Data.Bioengineering (Basel). 2024 Jun 25;11(7):647. doi: 10.3390/bioengineering11070647. Bioengineering (Basel). 2024. PMID: 39061729 Free PMC article.
-
HYDRA: Revealing heterogeneity of imaging and genetic patterns through a multiple max-margin discriminative analysis framework.Neuroimage. 2017 Jan 15;145(Pt B):346-364. doi: 10.1016/j.neuroimage.2016.02.041. Epub 2016 Feb 23. Neuroimage. 2017. PMID: 26923371 Free PMC article.
-
Advanced brain aging: relationship with epidemiologic and genetic risk factors, and overlap with Alzheimer disease atrophy patterns.Transl Psychiatry. 2016 Apr 5;6(4):e775. doi: 10.1038/tp.2016.39. Transl Psychiatry. 2016. PMID: 27045845 Free PMC article.
-
[A review on the application of UK Biobank in neuroimaging].Sheng Wu Yi Xue Gong Cheng Xue Za Zhi. 2021 Jun 25;38(3):594-601. doi: 10.7507/1001-5515.202012059. Sheng Wu Yi Xue Gong Cheng Xue Za Zhi. 2021. PMID: 34180206 Free PMC article. Review. Chinese.
-
Neuroimaging of structural pathology and connectomics in traumatic brain injury: Toward personalized outcome prediction.Neuroimage Clin. 2012 Aug 24;1(1):1-17. doi: 10.1016/j.nicl.2012.08.002. eCollection 2012. Neuroimage Clin. 2012. PMID: 24179732 Free PMC article. Review.
Cited by
-
Investigating Modifiable Risk Factors Across Dementia Subtypes: Insights from the UK Biobank.Biomedicines. 2024 Aug 31;12(9):1967. doi: 10.3390/biomedicines12091967. Biomedicines. 2024. PMID: 39335481 Free PMC article.
-
Understanding the Temporal Dynamics of Accelerated Brain Aging and Resilient Brain Aging: Insights from Discriminative Event-Based Analysis of UK Biobank Data.Bioengineering (Basel). 2024 Jun 25;11(7):647. doi: 10.3390/bioengineering11070647. Bioengineering (Basel). 2024. PMID: 39061729 Free PMC article.
References
-
- Vernooij M.W., de Groot M., van der Lugt A., Ikram M.A., Krestin G.P., Hofman A., Niessen W.J., Breteler M.M. White matter atrophy and lesion formation explain the loss of structural integrity of white matter in aging. Neuroimage. 2008;43:470–477. doi: 10.1016/j.neuroimage.2008.07.052. - DOI - PubMed
-
- Planche V., Coupé P., Helmer C., Le Goff M., Amieva H., Tison F., Dartigues J.F., Catheline G. Evolution of brain atrophy subtypes during aging predicts long-term cognitive decline and future Alzheimer’s clinical syndrome. Neurobiol. Aging. 2019;79:22–29. doi: 10.1016/j.neurobiolaging.2019.03.006. - DOI - PubMed
-
- Lee A.J., Ma Y., Yu L., Dawe R.J., McCabe C., Arfanakis K., Mayeux R., Bennett D.A., Klein H.U., De Jager P.L. Multi-region brain transcriptomes uncover two subtypes of aging individuals with differences in Alzheimer risk and the impact of APOEε4. bioRxiv. 2023 doi: 10.1101/2023.01.25.524961. preprint . - DOI
Grants and funding
LinkOut - more resources
Full Text Sources

