. 2024 Feb 10;13(4):327.
doi: 10.3390/cells13040327.

Defining Transcriptomic Heterogeneity between Left and Right Ventricle-Derived Cardiac Fibroblasts

Affiliations

Defining Transcriptomic Heterogeneity between Left and Right Ventricle-Derived Cardiac Fibroblasts

Michael Bradley Dewar et al. Cells. .

Abstract

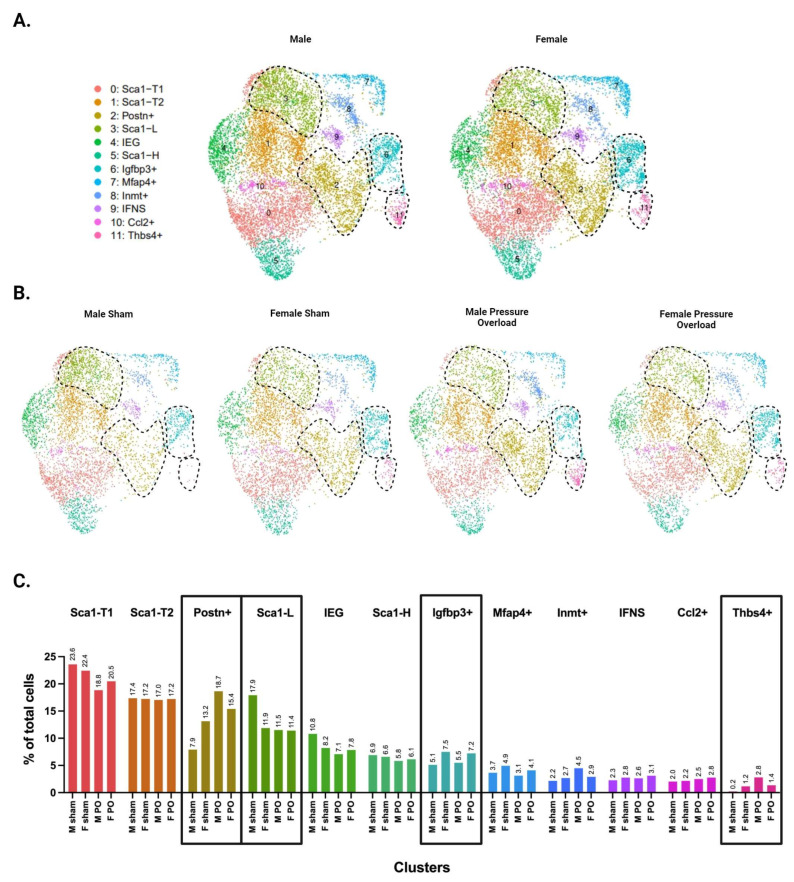
Cardiac fibrosis is a key aspect of heart failure, leading to reduced ventricular compliance and impaired electrical conduction in the myocardium. Various pathophysiologic conditions can lead to fibrosis in the left ventricle (LV) and/or right ventricle (RV). Despite growing evidence to support the transcriptomic heterogeneity of cardiac fibroblasts (CFs) in healthy and diseased states, there have been no direct comparisons of CFs in the LV and RV. Given the distinct natures of the ventricles, we hypothesized that LV- and RV-derived CFs would display baseline transcriptomic differences that influence their proliferation and differentiation following injury. Bulk RNA sequencing of CFs isolated from healthy murine left and right ventricles indicated that LV-derived CFs may be further along the myofibroblast transdifferentiation trajectory than cells isolated from the RV. Single-cell RNA-sequencing analysis of the two populations confirmed that Postn+ CFs were more enriched in the LV, whereas Igfbp3+ CFs were enriched in the RV at baseline. Notably, following pressure overload injury, the LV developed a larger subpopulation of pro-fibrotic Thbs4+/Cthrc1+ injury-induced CFs, while the RV showed a unique expansion of two less-well-characterized CF subpopulations (Igfbp3+ and Inmt+). These findings demonstrate that LV- and RV-derived CFs display baseline subpopulation differences that may dictate their diverging responses to pressure overload injury. Further study of these subpopulations will elucidate their role in the development of fibrosis and inform on whether LV and RV fibrosis require distinct treatments.

Keywords: RNA sequencing; cardiac fibroblast subpopulations; myofibroblast transdifferentiation; pressure overload; ventricular differences.


Conflict of interest statement

The authors declare that they have no conflicts of interest.

Figures

Figure 1
Figure 1
Bulk RNA sequencing and EGAD results from LV- and RV-derived CFs. (A) Schematic of methods used to isolate cardiac fibroblasts (CFs) for bulk and single-cell RNA sequencing (scRNA-seq). (B) Volcano plot of genes exhibiting differential expression between LV- and RV-derived CFs. Top fibrosis-related genes by p-value are labeled. Color represents whether a gene surpasses the cut-off for p-value (p < 0.05), fold change (|log2FC| > 0.5), both, or neither. (C) Heatmap of genes exhibiting differential expression between LV- and RV-derived CFs. (D) Top differentially expressed gene sets identified by GSEA. Labels for “activated” and “suppressed” are with respect to the LV. (E) Heatmap showing co-expression scores for the top 21 differentially expressed genes between LV- and RV-derived CFs. Darker and lighter colors represent higher and lower co-expression scores, respectively. Values for genes being compared against themselves have been set to 0. (F) Area under the receiver operator characteristic curve (AUROC) values across 11 different species for the top 25 genes differentially expressed by LV- and RV-derived CFs.
Figure 2
Figure 2
Single-cell RNA sequencing of CFs from uninjured LV and RV tissue. (A) Aggregate UMAP of all CFs identified in LV and RV samples. Dotted lines demarcate the Postn+ and Igfbp3+ subpopulations. (B) CFs separated according to ventricle of origin. Postn+ CFs are more prominent in the LV, while Igfbp3+ CFs are more prominent in the RV. (C) Dotplot of top five upregulated genes for each subpopulation. Color indicates expression level and dot size represents the percentage of cells expressing each gene. (D) Heatmap of the top 50 marker genes for each subpopulation. Individual cells are ordered along the x-axis, while marker genes are ordered along the y-axis. Color represents the expression level of each gene.
Figure 3
Figure 3
Single-cell RNA sequencing of CFs from LV and RV tissue following pressure overload injury. (A) Aggregate UMAP of all CFs in LV and RV samples from both male and female pressure overload experiments. (B) CFs separated by injury status. (C) CFs separated according to ventricle of origin. (D) Representative fibrosis staining of whole adult hearts with transverse aortic constriction (TAC), pulmonary artery banding (PAB) injury, and their respective sham surgeries. (E) Proportion of cells in each subpopulation split by ventricle. Subpopulations that show increased abundance in the LV or RV are highlighted by black boxes. (AC) CF subpopulations displaying ventricle-specific differences in abundance are demarcated by dotted lines.
Figure 4
Figure 4
Distribution of CF subpopulations across ventricle and injury status. (A) UMAP of CFs separated by ventricle and injury status. Injury-related CF subpopulations are outlined. (B) Proportion of cells in each subpopulation split by ventricle and injury status. (A,B) Subpopulations that show increased abundance in the LV or RV are demarcated by dotted lines in panel A, or black boxes in panel B.
Figure 5
Figure 5
RNA velocity analysis of CFs from LV and RV tissue following pressure overload injury. (A) Aggregate UMAP of all CFs from pressure overload experiments after reanalysis with Velocyto outputs. Postn+ CFs are demarcated by the black dotted line, and Thbs4+ CFs are demarcated by the red dotted line. (B) UMAP colored by latent time values of each cell and split by ventricle and injury status. The color of each cell indicates its position along the predicted differentiation trajectory, with yellow and blue representing the latest and earliest positions, respectively. CFs at the latest positions along this trajectory—corresponding to the Thbs4+ subpopulation—are demarcated by black dotted lines.
Figure 6
Figure 6
Single-cell RNA sequencing of male versus female CFs following pressure overload injury. (A) UMAPs of CFs separated by biological sex. (B) UMAPs of CFs separated by biological sex and injury status. (C) Proportion of cells in each subpopulation split by biological sex and injury status. (AC) CF subpopulations displaying sex-specific differences in abundance are demarcated by black dotted lines in panels A & B or by black boxes in panel C.

References

    1. Travers J.G., Kamal F.A., Robbins J., Yutzey K.E., Blaxall B.C. Cardiac Fibrosis: The Fibroblast Awakens. Circ. Res. 2016;118:1021–1040. doi: 10.1161/CIRCRESAHA.115.306565. - DOI - PMC - PubMed
    1. McNair B.D., Shorthill S.K., Bruns D.R. More than just a small left ventricle: The right ventricular fibroblast and ECM in health and disease. Am. J. Physiol. Heart Circ. Physiol. 2023;325:H385–H397. doi: 10.1152/ajpheart.00213.2023. - DOI - PMC - PubMed
    1. Burstein B., Libby E., Calderone A., Nattel S. Differential behaviors of atrial versus ventricular fibroblasts: A potential role for platelet-derived growth factor in atrial-ventricular remodeling differences. Circulation. 2008;117:1630–1641. doi: 10.1161/CIRCULATIONAHA.107.748053. - DOI - PubMed
    1. Chung C.C., Kao Y.H., Yao C.J., Lin Y.K., Chen Y.J. A comparison of left and right atrial fibroblasts reveals different collagen production activity and stress-induced mitogen-activated protein kinase signalling in rats. Acta Physiol. 2017;220:432–445. doi: 10.1111/apha.12835. - DOI - PubMed
    1. Farbehi N., Patrick R., Dorison A., Xaymardan M., Janbandhu V., Wystub-Lis K., Ho J.W., Nordon R.E., Harvey R.P. Single-cell expression profiling reveals dynamic flux of cardiac stromal, vascular and immune cells in health and injury. eLife. 2019;8:e43882. doi: 10.7554/eLife.43882. - DOI - PMC - PubMed

Publication types