

Drug Repositioning of Inflammatory Bowel Disease Based on Co-Target Gene Expression Signature of Glucocorticoid Receptor and TET2
- PMID: 38392301
- PMCID: PMC10886832
- DOI: 10.3390/biology13020082
Drug Repositioning of Inflammatory Bowel Disease Based on Co-Target Gene Expression Signature of Glucocorticoid Receptor and TET2
Abstract
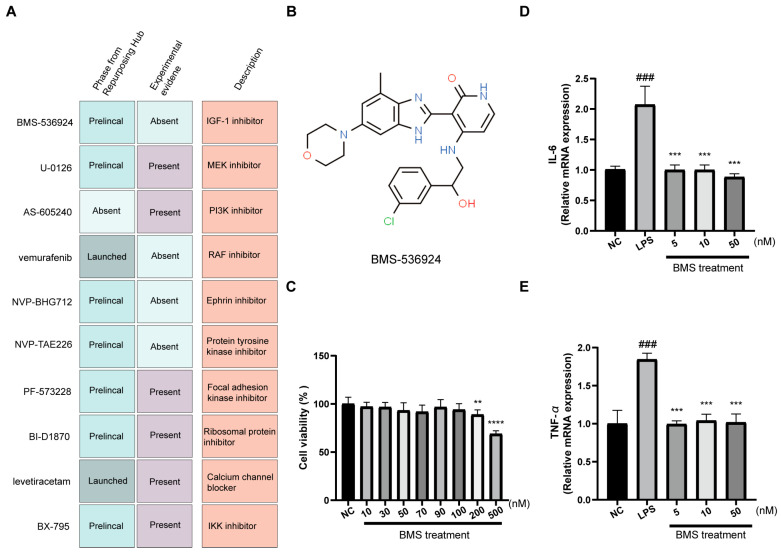
The glucocorticoid receptor (GR) and ten-eleven translocation 2 (TET2), respectively, play a crucial role in regulating immunity and inflammation, and GR interacts with TET2. However, their synergetic roles in inflammatory bowel disease (IBD), including ulcerative colitis (UC) and Crohn's disease (CD), remain unclear. This study aimed to investigate the co-target gene signatures of GR and TET2 in IBD and provide potential therapeutic interventions for IBD. By integrating public data, we identified 179 GR- and TET2-targeted differentially expressed genes (DEGs) in CD and 401 in UC. These genes were found to be closely associated with immunometabolism, inflammatory responses, and cell stress pathways. In vitro inflammatory cellular models were constructed using LPS-treated HT29 and HCT116 cells, respectively. Drug repositioning based on the co-target gene signatures of GR and TET2 derived from transcriptomic data of UC, CD, and the in vitro model was performed using the Connectivity Map (CMap). BMS-536924 emerged as a top therapeutic candidate, and its validation experiment within the in vitro inflammatory model confirmed its efficacy in mitigating the LPS-induced inflammatory response. This study sheds light on the pathogenesis of IBD from a new perspective and may accelerate the development of novel therapeutic agents for inflammatory diseases including IBD.
Keywords: GR; IBD; TET2; drug repositioning; in vitro inflammatory model.
Conflict of interest statement
The authors declare no conflicts of interest.
Figures
Similar articles
-
Glucocorticoid promotes metastasis of colorectal cancer via co-regulation of glucocorticoid receptor and TET2.Int J Cancer. 2025 Apr 15;156(8):1572-1582. doi: 10.1002/ijc.35285. Epub 2024 Dec 11. Int J Cancer. 2025. PMID: 39661335
-
Identification of differentially expressed genes, associated functional terms pathways, and candidate diagnostic biomarkers in inflammatory bowel diseases by bioinformatics analysis.Exp Ther Med. 2019 Jul;18(1):278-288. doi: 10.3892/etm.2019.7541. Epub 2019 May 3. Exp Ther Med. 2019. PMID: 31258663 Free PMC article.
-
Differential expression of serum miR-486 and miR-25 in ulcerative colitis and Crohn's disease: Correlations with disease activity, extent, and location.Pathol Res Pract. 2023 Dec;252:154910. doi: 10.1016/j.prp.2023.154910. Epub 2023 Oct 27. Pathol Res Pract. 2023. PMID: 37939427
-
Development, validation and implementation of an in vitro model for the study of metabolic and immune function in normal and inflamed human colonic epithelium.Dan Med J. 2015 Jan;62(1):B4973. Dan Med J. 2015. PMID: 25557335 Review.
-
Target-Based Small Molecule Drug Discovery Towards Novel Therapeutics for Inflammatory Bowel Diseases.Inflamm Bowel Dis. 2021 Nov 15;27(Suppl 2):S38-S62. doi: 10.1093/ibd/izab190. Inflamm Bowel Dis. 2021. PMID: 34791293 Review.
Cited by
-
Clonal Hematopoiesis of Indeterminate Potential in Crohn's Disease and Ulcerative Colitis.medRxiv [Preprint]. 2024 Aug 7:2024.08.06.24311497. doi: 10.1101/2024.08.06.24311497. medRxiv. 2024. Update in: Inflamm Bowel Dis. 2025 Aug 01;31(8):2123-2133. doi: 10.1093/ibd/izae312. PMID: 39148820 Free PMC article. Updated. Preprint.
References
LinkOut - more resources
Full Text Sources
Molecular Biology Databases
