. 2024 Feb 10;13(2):112.
doi: 10.3390/biology13020112.

Evaluation of Tacrolimus' Adverse Effects on Zebrafish in Larval and Adult Stages by Using Multiple Physiological and Behavioral Endpoints

Affiliations

Evaluation of Tacrolimus' Adverse Effects on Zebrafish in Larval and Adult Stages by Using Multiple Physiological and Behavioral Endpoints

Wen-Wei Feng et al. Biology (Basel). .

Abstract

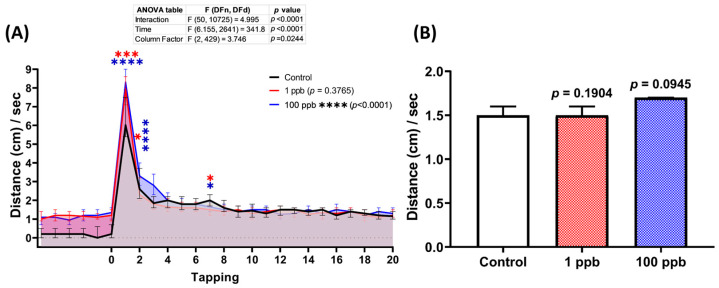
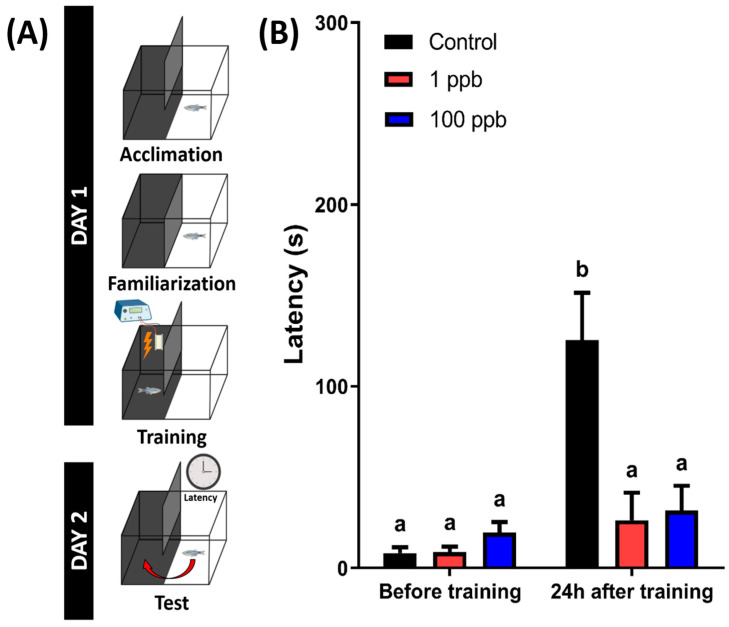
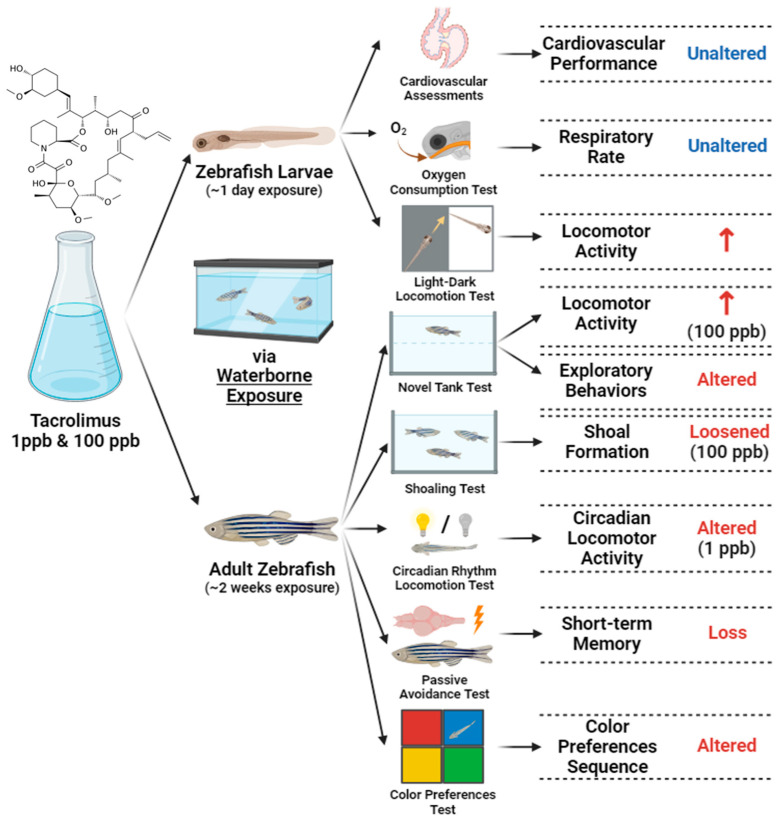
Tacrolimus (FK506) is a common immunosuppressant that is used in organ transplantation. However, despite its importance in medical applications, it is prone to adverse side effects. While some studies have demonstrated its toxicities to humans and various animal models, very few studies have addressed this issue in aquatic organisms, especially zebrafish. Here, we assessed the adverse effects of acute and chronic exposure to tacrolimus in relatively low doses in zebrafish in both larval and adult stages, respectively. Based on the results, although tacrolimus did not cause any cardiotoxicity and respiratory toxicity toward zebrafish larvae, it affected their locomotor activity performance in light-dark locomotion tests. Meanwhile, tacrolimus was also found to slightly affect the behavior performance, shoaling formation, circadian rhythm locomotor activity, and color preference of adult zebrafish in a dose-dependent manner. In addition, alterations in the cognitive performance of the fish were also displayed by the treated fish, indicated by a loss of short-term memory. To help elucidate the toxicity mechanism of tacrolimus, molecular docking was conducted to calculate the strength of the binding interaction between tacrolimus to human FKBP12. The results showed a relatively normal binding affinity, indicating that this interaction might only partly contribute to the observed alterations. Nevertheless, the current research could help clinicians and researchers to further understand the toxicology of tacrolimus, especially to zebrafish, thus highlighting the importance of considering the toxicity of tacrolimus prior to its usage.

Keywords: behaviors; memory; tacrolimus; toxicity; zebrafish.


Conflict of interest statement

The authors declare no conflicts of interest.

Figures

Figure 1
Figure 1
The detailed experiment protocols regarding the tacrolimus exposure and toxicity tests’ schedule in the present study. For the waterborne exposure of tacrolimus in the zebrafish larvae, the brown line indicates the start of the exposure (day 0). For the waterborne exposure of tacrolimus in the adult zebrafish, the start of the exposure (day 0) is indicated with the red line while the green lines show the times that the water replacement of the exposure solution was conducted every two days.
Figure 2
Figure 2
Comparison of several cardiac physiology endpoints: (A) stroke volume, (B) cardiac output, (C) ejection fraction, (D) shortening fraction, heart rate variability in (E) SD1 and (F) SD2 of ventricle chamber, and (G) heart rate of ventricle chamber in three dpf zebrafish larvae after exposure to 0 (control), 1 ppb, and 100 ppb of tacrolimus for 1 day. The data were analyzed by using a one-way ANOVA test, followed by Dunnett’s multiple comparisons test, and are presented as mean with SEM. The statistical comparisons were performed between the control and each treated group (n control and 100 ppb = 28, n 1 ppb = 24).
Figure 3
Figure 3
Comparison of (A) average and (B) maximum blood flow speed in zebrafish larvae after exposure to 0 (control), 1, and 100 ppb of tacrolimus. The data were analyzed by using a one-way ANOVA test, followed by Dunnett’s multiple comparisons test, and are presented as box and whiskers (min to max). The statistical comparisons were performed between the control and each treated group (n control = 30, n 1 ppb = 27, n 100 ppb = 29). The time chronology of the monitoring of the blood flow velocity in the dorsal aorta of a single representative zebrafish larva from (C) 0 (control), (D) 1, and (E) 100 ppb of the tacrolimus-treated groups.
Figure 4
Figure 4
(A) Oxygen consumption level per minute in four dpf zebrafish larvae after 1 day of exposure to 0 (control), 1 ppb, and 100 ppb of tacrolimus during the respiratory rate assay. The data were analyzed using a two-way ANOVA test with Geisser–Greenhouse correction and expressed as mean. (B) Comparison of total oxygen consumption of the tested zebrafish larvae. The data were analyzed by using one-way ANOVA, followed with Dunnett’s multiple comparisons test, and are presented as mean with SEM. The statistical comparisons were performed between the control and each treated group (n control and 100 ppb = 53, n 1 ppb = 48; ns = not significant).
Figure 5
Figure 5
(A) Total distance traveled per minute by five dpf zebrafish larvae after 1 day of exposure to 0 (control), 1 ppb, and 100 ppb of tacrolimus during both light and dark cycles. The data were analyzed by using a two-way ANOVA test with Geisser–Greenhouse correction, followed by Dunnett’s multiple comparisons test. (B,C) Comparison of the total distance traveled by the tested zebrafish larvae in light and dark cycles, respectively. The data were analyzed using the Kruskal–Wallis test, followed by Dunn’s multiple comparisons test. The statistical comparisons were performed between the control and each treated group. All data are expressed in the median with 95% CI (n = 96; ** p < 0.01; **** p < 0.0001).
Figure 6
Figure 6
(A) Total distance traveled per second by six dpf zebrafish larvae after 2 days of exposure to 0 (control), 1 ppb, and 100 ppb of tacrolimus during the vibrational startle response assay. The data were analyzed using a two-way ANOVA test with Geisser–Greenhouse correction, followed by Dunnett’s multiple comparisons test. (B) Comparison of the average total distance traveled by the tested zebrafish larvae during the tapping stimuli. The data were analyzed using the Kruskal–Wallis test, followed by Dunn’s multiple comparisons test. The statistical comparisons were performed between the control and each treated group. All data are expressed as the median with 95% CI (n = 96; * p < 0.05, *** p < 0.001, **** p < 0.0001).
Figure 7
Figure 7
(A) Average speed, (B) freezing time movement ratio, (C) swimming movement time ratio, (D) rapid movement time ratio, (E) number of entries to the top, (F) latency to enter the top, (G) total distance traveled in the top, (H) average distance to center of the tank, and (I) time in top duration behavior endpoints of zebrafish after being exposed to tacrolimus at two different concentrations; 1 ppb (red) and 100 ppb (blue) compared to control (black). The data are expressed as the median with an interquartile range. The statistical analyses were conducted by two-way ANOVA with Geisser–Greenhouse correction. To observe the main column (tacrolimus) effect, Dunnett’s multiple comparison test was carried out. The statistical comparisons were performed between the control and each treated group (n control = 29, n tacrolimus = 30; * p < 0.05, ** p < 0.01, *** p < 0.001, **** p < 0.0001).
Figure 8
Figure 8
(A) Average inter-fish distance, (B) average shoal area, (C) average nearest neighbor distance, and (D) average farthest neighbor distance of zebrafish after being exposed to tacrolimus at two different concentrations: 1 ppb (red) and 100 ppb (blue) compared to control (black). The data are expressed as the median with an interquartile range. The statistical analyses were conducted using the Kruskal–Wallis test, followed by Dunn’s multiple comparisons test. The statistical comparisons were performed between the control and each treated group (shoal size = 3 fishes; n control & 1 ppb = 27, n 100 ppb = 30; ns = not significant, * p < 0.05, ** p < 0.01, *** p < 0.001).
Figure 9
Figure 9
(A) Locomotor activity patterns of zebrafish that were chronically exposed to 0 (control), 1 ppb, and 100 ppb of tacrolimus during 24 h of observation. The data are expressed as mean with SEM. (B,H) Average speed, (C,I) average angular velocity, (D,J) meandering, (E,K) freezing movement time ratio, (F,L) swimming movement time ratio, and (G,M) rapid movement ratio of the tested fish during the day and night cycles, respectively. The data are expressed as the median with interquartile range and were analyzed using the Kruskal–Wallis test, followed by Dunn’s multiple comparisons test. The statistical comparisons were performed between the control and each treated group (n control and 1 ppb = 12, n 100 ppb = 8; * p < 0.05, ** p < 0.01, *** p < 0.001, **** p < 0.0001).
Figure 10
Figure 10
(A) The schematic of the passive avoidance experimental protocol (created with BioRender.com) and (B) the latency of fish chronically exposed to 0 (control), 1 ppb, and 100 ppb of tacrolimus to swim into the dark chamber 24 h after training sessions (right). The data are presented as mean with SEM and were analyzed with two-way ANOVA followed by Tukey’s multiple comparison test. Different letters signify statistical differences (p < 0.05) (n control = 18, n 1 ppb = 14, and 100 ppb = 16).
Figure 11
Figure 11
Comparison of the color preference behavior of zebrafish after being chronically treated with 0 (control), 1, and 100 ppb of tacrolimus. The four color combinations were as follows: (A) green–blue, (B) green–yellow, (C) blue–red, (D) blue–yellow, (E) green–red, and (F) red–yellow. The data are expressed as the mean ± SEM values and were analyzed by one-way ANOVA (n control = 9, n 1 and 100 ppb = 11; ** p < 0.01, **** p < 0.0001).
Figure 12
Figure 12
Summary of the toxicities of tacrolimus to larval and adult zebrafish observed in the current study after acute and chronic administration via waterborne exposure (↑: increased; created with BioRender.com).

Similar articles

References

    1. Jewett A., Tseng H.-C. In: Pharmacology and Therapeutics for Dentistry. 7th ed. Mariotti A., Dowd F.J., Johnson B.S., editors. Elsevier Health Sciences; St. Louis, MI, USA: 2017.
    1. McCulloh J.R. In: Infectious Diseases. 4th ed. Cohen J., Powderly W.G., Opal S.M., editors. Elsevier Health Sciences; Amsterdam, The Netherlands: 2017.
    1. Campagne O., Mager D.E., Brazeau D., Venuto R.C., Tornatore K.M. The impact of tacrolimus exposure on extrarenal adverse effects in adult renal transplant recipients. Br. J. Clin. Pharmacol. 2019;85:516–529. doi: 10.1111/bcp.13811. - DOI - PMC - PubMed
    1. Kemper M.J., Spartà G., Laube G.F., Miozzari M., Neuhaus T.J. Neuropsychologic side-effects of tacrolimus in pediatric renal transplantation. Clin. Transplant. 2003;17:130–134. doi: 10.1034/j.1399-0012.2003.00028.x. - DOI - PubMed
    1. Brooks E., Tett S.E., Isbel N.M., Staatz C.E. Population pharmacokinetic modelling and Bayesian estimation of tacrolimus exposure: Is this clinically useful for dosage prediction yet? Clin. Pharmacokinet. 2016;55:1295–1335. doi: 10.1007/s40262-016-0396-1. - DOI - PubMed

LinkOut - more resources