

Temporal Interactions between Maintenance of Cerebral Cortex Thickness and Physical Activity from an Individual Person Micro-Longitudinal Perspective and Implications for Precision Medicine
- PMID: 38392561
- PMCID: PMC10890462
- DOI: 10.3390/jpm14020127
Temporal Interactions between Maintenance of Cerebral Cortex Thickness and Physical Activity from an Individual Person Micro-Longitudinal Perspective and Implications for Precision Medicine
Abstract
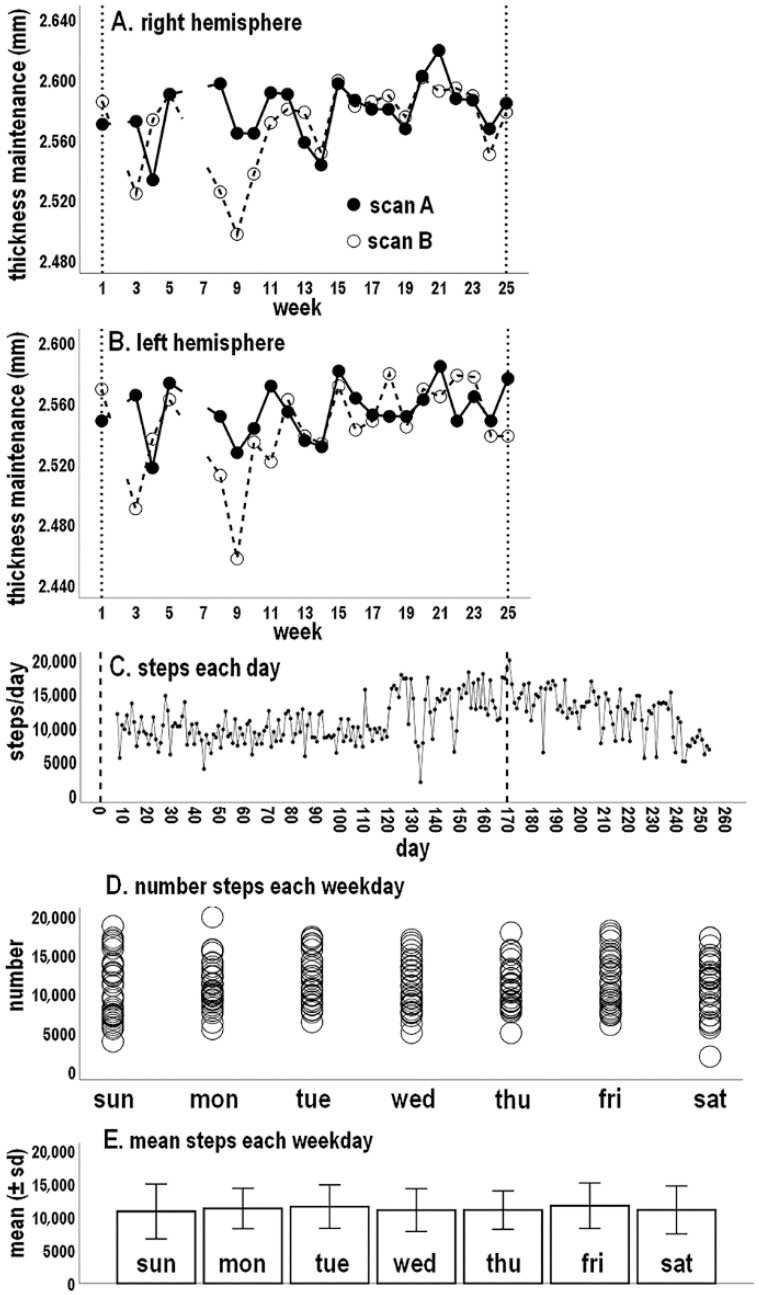
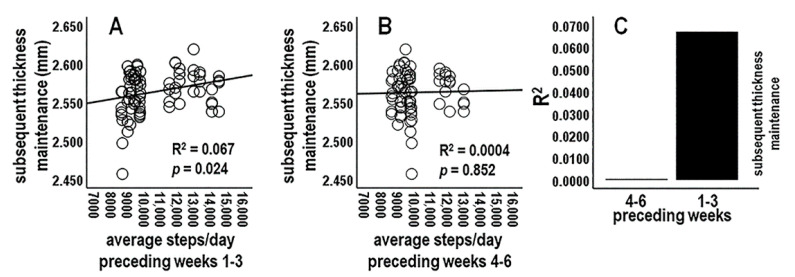
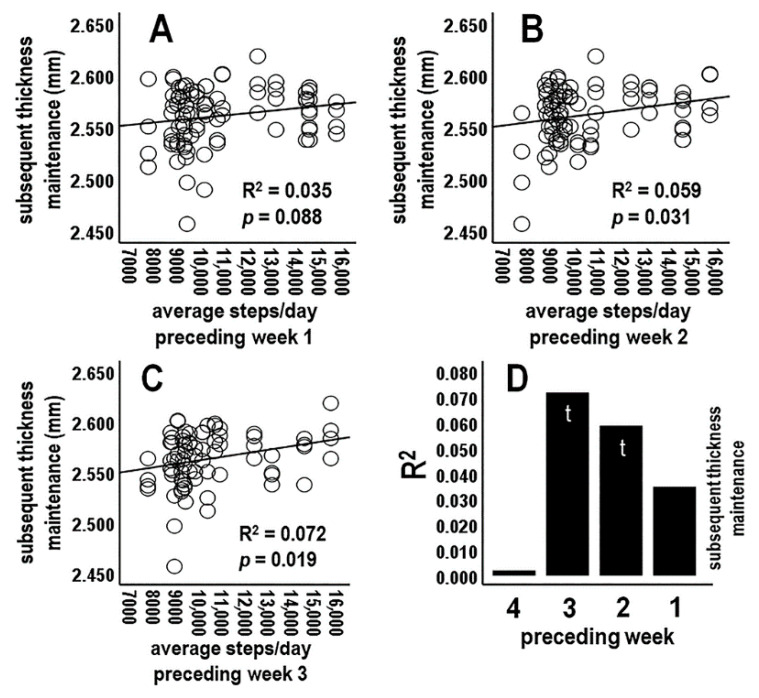
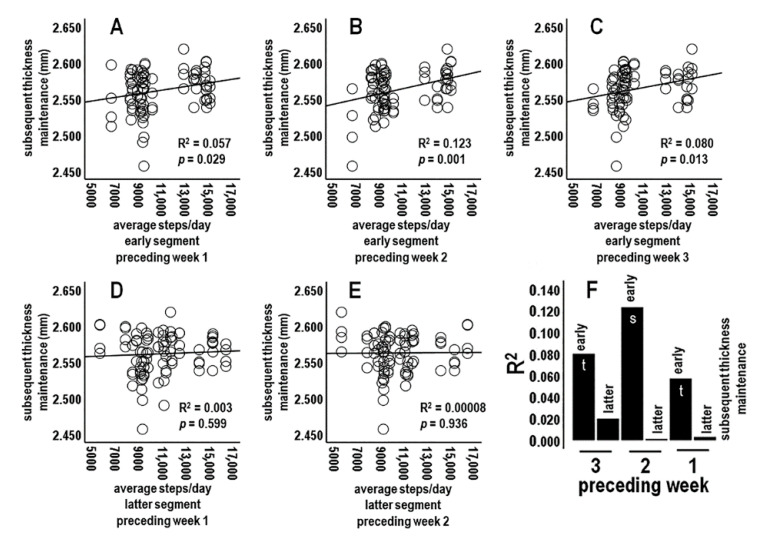
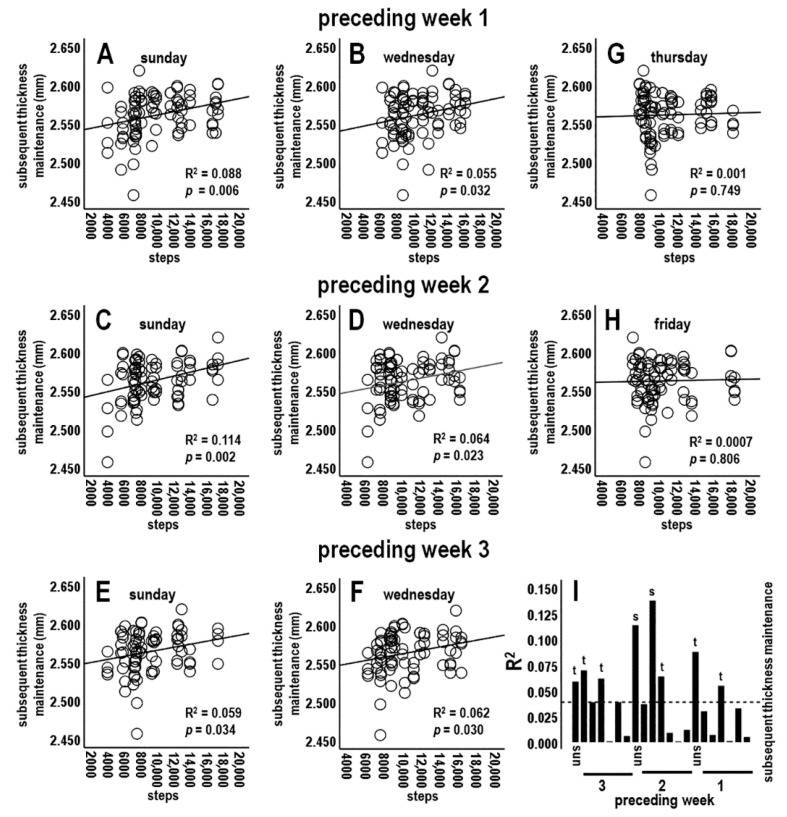
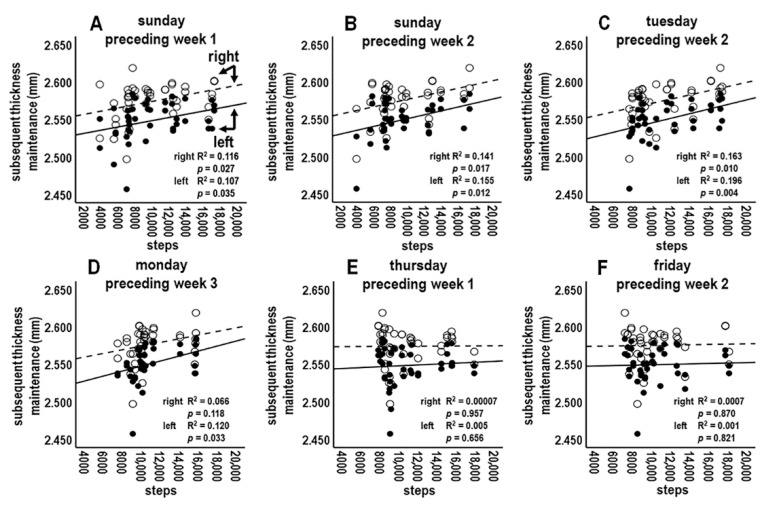
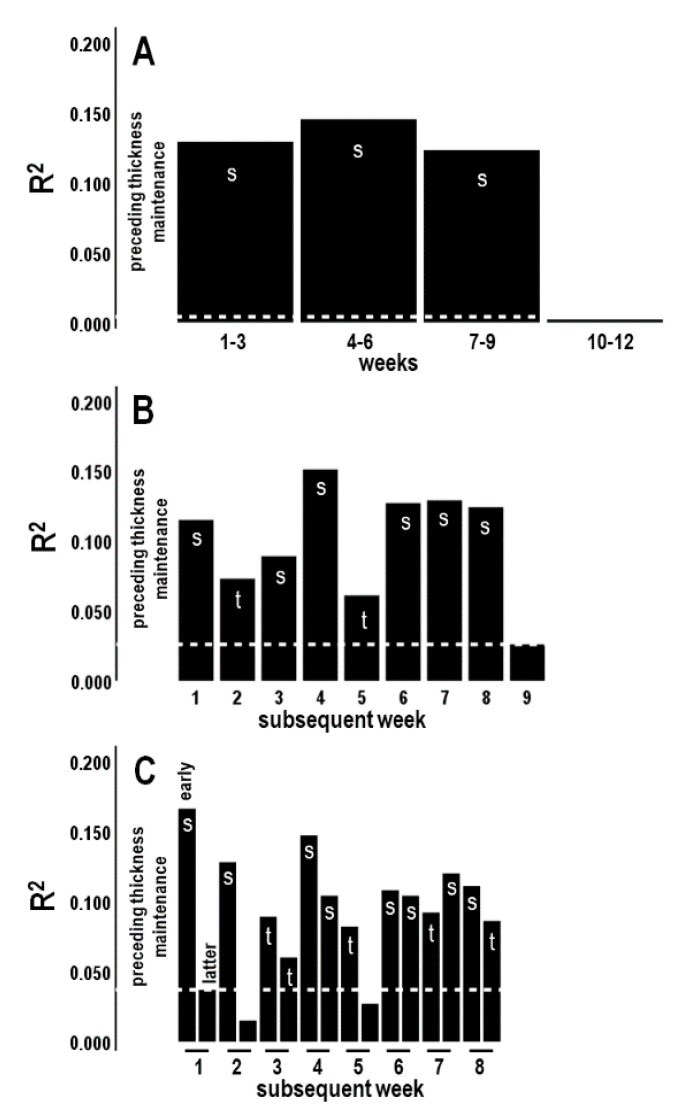
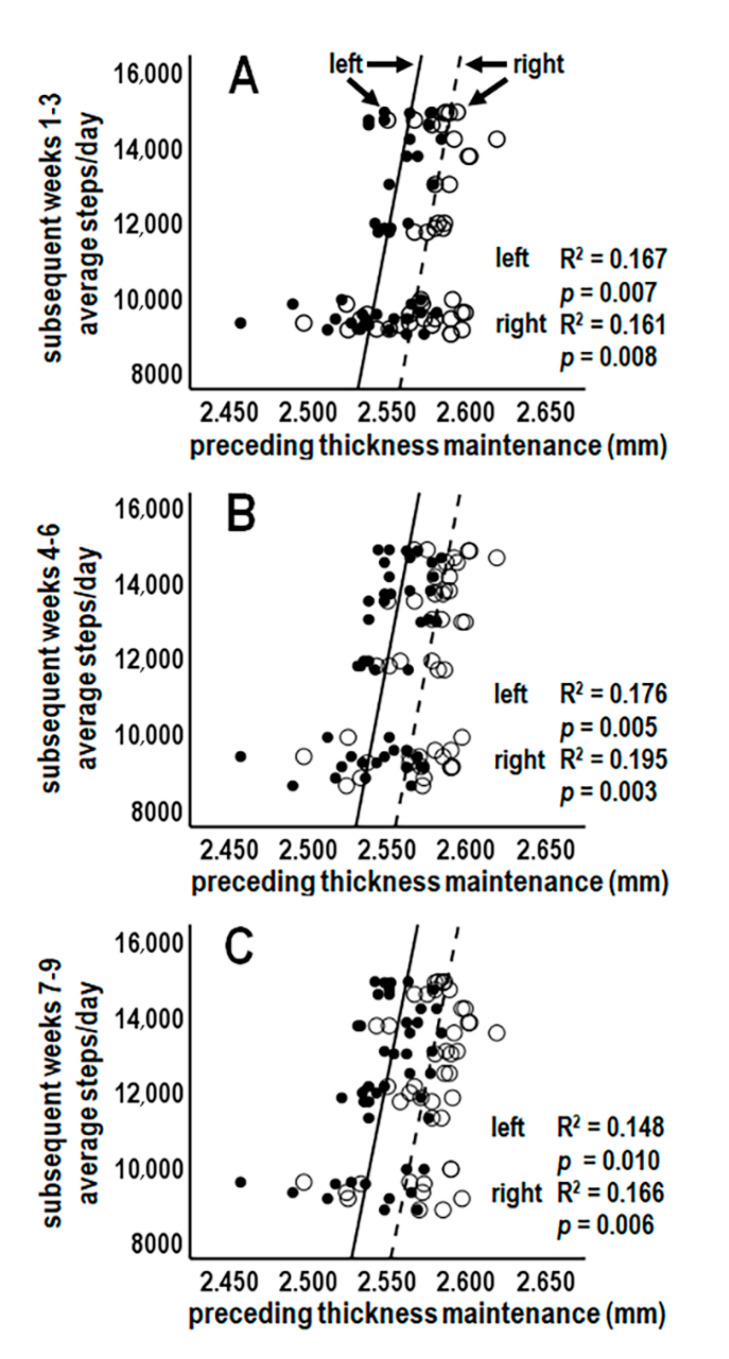
Maintenance of brain structure is essential for neurocognitive health. Precision medicine has interests in understanding how maintenance of an individual person's brain, including cerebral cortical structure, interacts with lifestyle factors like physical activity. Cortical structure, including cortical thickness, has recognized relationships with physical activity, but concepts of these relationships come from group, not individual, focused findings. Whether or how group-focused concepts apply to an individual person is fundamental to precision medicine interests but remains unclear. This issue was studied in a healthy man using concurrent micro-longitudinal tracking of magnetic resonance imaging-defined cortical thickness and accelerometer-defined steps/day over six months. These data permitted detailed examination of temporal relationships between thickness maintenance and physical activity at an individual level. Regression analyses revealed graded significant and trend-level temporal interactions between preceding activity vs. subsequent thickness maintenance and between preceding thickness maintenance vs. subsequent activity. Interactions were bidirectional, delayed/prolonged over days/weeks, positive, bilateral, directionally asymmetric, and limited in strength. These novel individual-focused findings in some ways are predicted, but in other ways remain unaddressed or undetected, by group-focused work. We suggest that individual-focused concepts of temporal interactions between maintenance of cortical structure and activity can provide needed new insight for personalized tailoring of physical activity, cortical, and neurocognitive health.
Keywords: accelerometer; cortical thickness; human individuality; idiographic; intraindividual; physical activity; precision/personalized medicine; steps/day exercise.
Conflict of interest statement
The authors declare no conflicts of interest.
Figures
Similar articles
-
Interaction of Sleep and Cortical Structural Maintenance From an Individual Person Microlongitudinal Perspective and Implications for Precision Medicine Research.Front Neurosci. 2020 Jul 31;14:769. doi: 10.3389/fnins.2020.00769. eCollection 2020. Front Neurosci. 2020. PMID: 32848551 Free PMC article.
-
Relationships in Ongoing Structural Maintenances of the Two Cerebral Cortices of an Individual Brain.J Exp Neurosci. 2018 Sep 3;12:1179069518795875. doi: 10.1177/1179069518795875. eCollection 2018. J Exp Neurosci. 2018. PMID: 30202210 Free PMC article.
-
An Exploration Into Short-Interval Maintenance of Adult Hemispheric Cortical Thickness at an Individual Brain Level.J Exp Neurosci. 2017 Sep 26;11:1179069517733453. doi: 10.1177/1179069517733453. eCollection 2017. J Exp Neurosci. 2017. PMID: 28989284 Free PMC article.
-
American Medical Society for Sports Medicine position statement: concussion in sport.Br J Sports Med. 2013 Jan;47(1):15-26. doi: 10.1136/bjsports-2012-091941. Br J Sports Med. 2013. PMID: 23243113 Review.
-
Cortical Thickness Abnormalities at Different Stages of the Illness Course in Schizophrenia: A Systematic Review and Meta-analysis.JAMA Psychiatry. 2022 Jun 1;79(6):560-570. doi: 10.1001/jamapsychiatry.2022.0799. JAMA Psychiatry. 2022. PMID: 35476125 Free PMC article.
References
Grants and funding
LinkOut - more resources
Full Text Sources
