. 2024 Apr 1;223(4):e202311048.
doi: 10.1083/jcb.202311048. Epub 2024 Feb 23.

FER-like iron deficiency-induced transcription factor (FIT) accumulates in nuclear condensates

Affiliations

FER-like iron deficiency-induced transcription factor (FIT) accumulates in nuclear condensates

Ksenia Trofimov et al. J Cell Biol. .

Abstract

The functional importance of nuclear protein condensation remains often unclear. The bHLH FER-like iron deficiency-induced transcription factor (FIT) controls iron acquisition and growth in plants. Previously described C-terminal serine residues allow FIT to interact and form active transcription factor complexes with subgroup Ib bHLH factors such as bHLH039. FIT has lower nuclear mobility than mutant FITmSS271AA. Here, we show that FIT undergoes a light-inducible subnuclear partitioning into FIT nuclear bodies (NBs). Using quantitative and qualitative microscopy-based approaches, we characterized FIT NBs as condensates that were reversible and likely formed by liquid-liquid phase separation. FIT accumulated preferentially in NBs versus nucleoplasm when engaged in protein complexes with itself and with bHLH039. FITmSS271AA, instead, localized to NBs with different dynamics. FIT colocalized with splicing and light signaling NB markers. The NB-inducing light conditions were linked with active FIT and elevated FIT target gene expression in roots. FIT condensation may affect nuclear mobility and be relevant for integrating environmental and Fe nutrition signals.


Conflict of interest statement

Disclosures: The authors declare no competing interests exist.

Figures
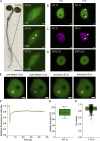
Figure 1.
Figure 1.
FIT accumulated in nuclear condensates, termed FIT nuclear bodies (NBs) in a light-inducible manner, most likely following LLPS. (A) Induction of FIT NBs in Arabidopsis root epidermis cells of the root differentiation zone. Left, light microscopy overview image of a 5-d-old Arabidopsis seedling (proFIT:FIT-GFP) grown under iron deficiency. Right, nuclear localization of FIT-GFP in the root epidermis cells as indicated in the overview image, at t = 0, t = 90, and t = 120 min. FIT-GFP signals were evenly distributed in the nucleus at t = 0 min, and after induction by excitation with a 488 nm laser NB formation accumulated in NBs at t = 90 min, but also disappeared as shown at t = 120 min. Note that root epidermis cells developed few NBs, sometimes taking up to 2 h to appear. Three independent experiments with three plants were conducted. In the indicated region of interest, approximately 3–10 nuclei of 20 examined nuclei of the root epidermis cells showed NBs. A representative image from one nucleus is shown. (B–D) Fluorescence protein analysis in transiently transformed N. benthamiana leaf epidermis cells. Confocal images of B, FIT-GFP, C, FIT-mCherry, and D, ZAT12-GFP at t = 0 and t = 5 min. At t = 0 min, FIT-GFP and FIT-mCherry showed an even distribution within the nucleus. Following a 488 nm laser excitation, numerous NBs were clearly visible in all examined transformed cells at t = 5 min. These NBs were termed FIT NBs. Under the same imaging conditions, ZAT12-GFP did not show NB formation. According to these results, a standardized FIT NB analysis procedure was set up (Fig. S1 C). See also Videos 1, 2, and 3. Representative images from two to three independent experiments. (E–G) FRAP measurements to test for liquid-like behavior of FIT NBs, using the standardized FIT NB analysis procedure in transiently transformed N. benthamiana leaf epidermis cells. (E) Representative images of the fluorescent signal during a FRAP experiment, taken before bleaching (0 s) and recovery of fluorescence at three time points after bleaching from 3 to 45 s within the circled region of a NB. (F) Line diagram representing the relative fluorescence during a FRAP measurement for 10 NBs, showing a high fluorescence recovery rate of FIT-GFP within NBs. Dark green line, mean value; light green filled area, variation. (G) Box plot diagram representing the mobile fraction of FIT-GFP calculated based on the relative fluorescence recovery in F. The diagram indicates the high mobility of FIT. The mean was calculated from 10 NBs from 10 nuclei from a transformed plant. Three independent experiments were conducted and one representative result is shown. (H) Box plot diagram representing quantification of the FIT NB shape with the software ImageJ (National Institutes of Health), indicating that FIT NBs have a circular shape. Mobility and circularity characteristics indicate that FIT NBs are most likely liquid condensates that are the result of LLPS. The mean was calculated from all NBs visible in 15 nuclei from a transformed plant. Two independent experiments were conducted, and one representative result is shown. Box plots show 25–75 percentile with min-max whiskers, mean as small square, and median as line. Scale bars of nuclei images, 2 µm; scale bar full seedling, 1 mm. Arrowheads indicate NBs. G = GFP; C = mCherry.
Figure S1.
Figure S1.
FIT NBs induced by blue light and a standardized FIT NB analysis procedure was developed to analyze the characteristics and dynamics of FIT NBs (supports Fig. 1). (A) Induction of FIT NBs in Arabidopsis root epidermis cells of the root differentiation zone at t = 0 and t = 40 min of 5-d-old seedling (2x35Spro:FIT-GFP) grown under iron deficiency. FIT-GFP signals were evenly distributed in the nucleus at t = 0 min, and after induction by excitation with 488 nm laser NB formation accumulated in NBs at t = 40 min. Root epidermis cells developed few NBs with weak FIT-GFP signals, sometimes taking up to 2 h to appear. Representative pictures from four independent experiments. (B) Arabidopsis root epidermal cells of the root differentiation zone of 5-d-old seedling (proFIT:FIT-GFP) grown under iron deficiency do not show NBs when taken directly from white light. Representative pictures from three independent experiments. Scale bar: 2 µm. (C) Experimental steps for FIT NB induction in transiently transformed N. benthamiana leaf epidermis cells. Fluorescence protein expression was induced by β-estradiol (“induction of protein expression”) 16 h prior to imaging and measurements. Leaf discs were excised, and initial fluorescence images and measurements were taken (“data acquisition t = 0”). Leaf discs were exposed to 488 nm laser light as a light trigger for 1 min (“light induction of NB formation”), and 5 min later, fluorescence images and measurements were taken again (“data acquisition t = 5”). With this procedure, FIT NBs were visible, and their characteristics could be analyzed. In some cases, fluorescence images and measurements were taken at t = 15 min, as indicated in the text. Imaging was performed at the respective wavelengths for detection of GFP and mRFP/mCherry, respectively. Figure C has been created with the help of https://BioRender.com.
Figure 2.
Figure 2.
The FIT C-terminal Ser271/272 site was important for the capacity of FIT to localize to NBs. (A) Confocal images of nuclear localization of FITmSS271AA-GFP at t = 0 and t = 15 min. FITmSS271AA-GFP accumulated in NBs, but NB formation required a longer time compared with FIT-GFP. See also Videos 1 and 3. Two independent experiments. Representative images from one nucleus. (B and C) Bar diagrams shown in B are the number of NBs, and in C, the sizes of NBs of FIT-GFP and FITmSS271AA-GFP at t = 5/15 min. NB number and size were determined with the software ImageJ (National Institute of Health). FIT-GFP accumulated in more and larger NBs than FITmSS271AA-GFP. See Videos 1 and 3. FITmSS271AA-GFP lacks IDRSer271/272. This IDR may be relevant for FIT NB formation (Fig. S2). In B and C, bar diagrams represent the mean and standard deviation for quantification of 15 nuclei from a transformed plant (n = 15). Two experiments were conducted, and one representative result is shown. Statistical analysis was performed with the Mann–Whitney test. Different letters indicate statistically significant differences (P < 0.05). Scale bar: 2 µm. Arrowheads indicate NBs. G = GFP. Analysis was conducted in transiently transformed N. benthamiana leaf epidermis cells, following the standardized FIT NB analysis procedure.
Figure S2.
Figure S2.
An intrinsically disordered region, IDRSer271/272, is present in the FIT C-terminus and disrupted in the FITmSS271AA mutant (supports Figs. 2, 3, and 4). (A and B) Diagrams representing the PONDR scores for each amino acid position in A, FIT, and B, FITmSS271AA protein sequences. Analysis was performed via the tool PONDR-VLXT (Molecular Kinetics, Inc.). A score >0.5 indicates intrinsic disorder. The 0.5 threshold is marked with a red line. Above the graph, a schematic representation of the FIT protein showing the position of the bHLH domain in gray (126–201 aa) and subdivided into the basic region in blue (DNA binding site, 132–162 aa) and the helix-loop-helix region in black (dimerization site, 142–201 aa). Domain prediction was performed with InterPro (EMBL-EBI). FIT has four regions with a score >0.5 that are predicted IDRs, two of them in the C-terminal part following the bHLH domain, with one out of them comprising the position Ser271/272, indicated by an arrowhead, termed IDRSer271/272. In FITmSS271AA, the PONDR score dropped for this region below the threshold.
Figure 3.
Figure 3.
FIT was present in homodimeric protein complexes in NBs, dependent on Ser271/272 site. Anisotropy (or homo-FRET) measurements of FIT-GFP and FITmSS271AA-GFP to determine homodimerization strength. (A) Schematic illustration of the anisotropy principle. Energy transfer between the same kind of fluorescently tagged proteins leads to depolarization of the emitted light. The extent of the depolarization gives a hint of dimerization and oligomerization of a protein as the fluorescence anisotropy (FA) value decreases. (B) Representative images showing color-coded FA values of FIT-GFP and FITmSS271AA-GFP at t = 0 and t = 5/15 min. (C and D) Box plots representing quantification of FA values. FA was measured at t = 0 within the whole nucleus and at t = 5/15 min within the whole nucleus, in NBs and residual NP. Free GFP and GFP-GFP served as references for mono- and dimerization. FA values for C, FIT-GFP, and D, FITmSS271AA-GFP. In C and D, FA values were calculated from 10 to 15 nuclei from a transformed plant (n = 10–15). Two experiments were conducted, and one representative result is shown. C and D show the same free GFP and GFP-GFP references because both measurements were performed on the same day. FA values decreased for FIT-GFP, but not FITmSS271AA-GFP, in the whole nucleus (compare t = 0 with t = 5/15 min). FA values were also lowered in NBs versus NP in the case of FIT-GFP but not FITmSS271AA-GFP (compare t = 5/15 min of NBs and NP). This indicates stronger homodimerization of FIT than FITmSS271AA-GFP in the whole nucleus and in NBs. IDRSer271/272 may therefore be relevant for FIT NB formation and FIT homodimerization (Fig. S2). Box plots show 25–75 percentile with min-max whiskers, mean as small square, and median as the line. Statistical analysis was performed with one-way ANOVA and Tukey post-hoc test. Different letters indicate statistically significant differences (P < 0.05). Scale bar: 2 µm. Arrowheads indicate NBs. G = GFP. Fluorescence protein analysis was conducted in transiently transformed N. benthamiana leaf epidermis cells, following the standardized FIT NB analysis procedure. Figure A has been created with the help of https://BioRender.com.
Figure 4.
Figure 4.
FIT was present in heterodimeric protein complexes with bHLH039 in NBs, dependent on Ser271/272 site. (A) Confocal images with colocalization of FIT-GFP and bHLH039-mCherry in the nucleus. Both proteins were evenly distributed within the nucleus at t = 0 and colocalized fully in FIT NBs at t = 5 min. Two independent experiments with two plants each. In all examined cells, the proteins showed full colocalization. Representative images from one nucleus. (B–E) FRET-FLIM measurements to determine the heterodimerization strength of FIT-GFP and FITmSS271AA-GFP with bHLH039-mCherry, respectively. FIT-GFP and FITmSS271AA-GFP (donor only) served as negative controls. (B) Schematic illustration of the FRET-FLIM principle. Energy transfer occurs between two different fluorophores. One fluorophore acts as the donor and the other as the acceptor of the energy. In case of interaction (close proximity, ≤10 nm), the fluorescence lifetime of the donor decreases. (C) Representative images showing color-coded fluorescence lifetime values of FIT-GFP and FITmSS271AA-GFP coexpressed with bHLH039-mCherry at t = 0 and t = 5/15 min. (D and E) Box plots diagrams representing FRET-FLIM measurements at t = 0 within the whole nucleus and at t = 5/15 min within the whole nucleus, inside NBs and in residual NP. Lifetime values represent measurements of 10 nuclei from a transformed plant (n = 10). Two experiments were conducted, and one representative result is shown. Fluorescence lifetime was reduced for the pair of FIT-GFP and bHLH039-mCherry in NBs versus NP at t = 5 min, indicating protein interaction preferentially inside NBs. Fluorescence lifetime values were not significantly different for the pair FITmSS271AA-GFP and bHLH039-mCherry in this same comparison at t = 15 min, indicating that this pair did not preferentially interact in NBs. IDRSer271/272 may therefore be relevant for FIT NB formation, and FIT homo- and heterodimerization (Fig. S2). Box plots show 25–75 percentile with min-max whiskers, mean as a small square, and median as the line. Statistical analysis was performed with one-way ANOVA and Tukey post-hoc test. Different letters indicate statistically significant differences (P < 0.05). Scale bar: 2 µm. Arrowheads indicate NBs. G = GFP; C = mCherry. Fluorescence protein analysis was conducted in transiently transformed N. benthamiana leaf epidermis cells, following the standardized FIT NB analysis procedure. Figure B has been created with the help of https://BioRender.com.
Figure S3.
Figure S3.
FIT NBs did not colocalize with Cajal body components (designated type I), and type II and III NB markers and PB markers are similarly localized in single expression as in coexpression with FIT, except PININ (supports Figs. 5, 6, and 7). (A–J) Confocal images showing localization of FIT-GFP and NB markers (type I) upon coexpression in the nucleus at t = 5 min, and of NB markers (type II and III) and PB markers upon their single expression in the nucleus at t = 0 and t = 5 min/15 min, in A, coilin-mRFP, B, U2B″-mRFP, C, SR45-mRFP, D, SRm102-mRFP, E, UAP56H2-mRFP, F, P15H1-mRFP, G, PININ-mRFP, H, PIF3-mCherry, and I and J, PIF4-mCherry in two different patterns. (A and B) In the coexpression of FIT-GFP with coilin-mRFP and U2B″-mRFP, FIT-GFP NBs were present at t = 5 min and did not colocalize with NBs of the two markers. (C and D) Single SR45-mRFP and SRm102-RFP localized in NBs similar to the colocalization with FIT-GFP at t = 0 and t = 5 min (compare with Fig. 5). (E and F) Single UAP56H2-mRFP and P15H1-mRFP did not localize in NBs and were uniformly distributed, similar to the colocalization with FIT-GFP at t = 0 (compare with Fig. 6, A and B). (G) Only a single PININ-mRFP showed a different localization pattern between its single expression versus coexpression with FIT-GFP. Upon single expression, it localized in NBs at t = 0 and t = 5 min, while in coexpression with FIT-GFP, it showed no NBs at t = 0 but followed the FIT-GFP NB pattern at t = 5 min (compared with Fig. 6 C). (H and J) Single PIF3-mCherry localized to a very large PB at t = 0 and t = 15 min. Single PIF4-mCherry localized either in a uniform manner in the nucleus as seen in I or in several PBs as seen in J. Hence, PIF3-mCherry and PIF4-mCherry were similarly localized in single expression as in coexpression with FIT-GFP (compare with Fig. 7). Scale bar: 2 µm. Empty arrowheads indicate non-colocalizing NBs, filled arrowheads indicate NBs/PBs in single expression. G = GFP; R = mRFP; C = mCherry. Fluorescence protein analysis was conducted in transiently transformed N. benthamiana leaf epidermis cells, following the standardized FIT NB analysis procedure. Representative images from three to five independent experiments.
Figure 5.
Figure 5.
Two NB markers and splicing components were present in NBs (designated type II), revealing the dynamics of FIT to accumulate in NBs. Confocal images showing localization of FIT-GFP and NB markers (type II) upon coexpression in the nucleus at t = 0 and t = 5 min. (A and B) Coexpression of FIT-GFP with A, SR45-mRFP, and B, SRm102-mRFP. Type II NB markers localized inside NBs at t = 0 and t = 5 min. Similar localization patterns were observed upon single expression, showing that SR45 and SRm102 are present in distinct NB types (compare with Fig. S3, C and D). FIT-GFP colocalized with type II markers in their distinct NBs at t = 5 min, but not t = 0. FIT-GFP additionally localized in FIT NBs at t = 5 min. Type II markers were not present in FIT NBs, while FIT-GFP became recruited into the distinct type II NBs upon the light trigger. Hence, FIT NBs could be associated with speckle components. Scale bar: 2 µm. Filled arrowheads indicate colocalization in NBs, empty arrowheads indicate no colocalization in NBs. G = GFP; R = mRFP. Fluorescence protein analysis was conducted in transiently transformed N. benthamiana leaf epidermis cells, following the standardized FIT NB analysis procedure. In all examined cells, the proteins showed partial colocalization. Representative images from two to five independent experiments are shown. For data with type I markers (no colocalization) and type III markers (full colocalization) see Fig. S3, A and B; and Fig. 6.
Figure 6.
Figure 6.
Three NB markers and speckle components became localized in FIT NBs and colocalized fully with FIT (designated type III), suggesting that FIT NBs have speckle function. Confocal images showing localization of FIT-GFP and NB markers (type III) upon coexpression in the nucleus at t = 0 and t = 5 min. (A–C) Coexpression of FIT-GFP with A, UAP56H2-mRFP, B, P15H1-mRFP, and C, PININ-mRFP. All three type III NB markers were homogeneously distributed and colocalized with FIT-GFP in the nucleus at t = 0, while they colocalized with FIT-GFP in FIT NBs at t = 5 min. UAP56H2-mRFP and P15H1-mRFP showed homogeneous localization in the single expression at both t = 0 and t = 5 min (compare with Fig. S3, E and F), while PININ-mRFP localized mainly in one large and several small NBs upon single expression at t = 0 and t = 5 min (compare with Fig. S3 G). Hence, these three markers adopted the localization of FIT-GFP upon coexpression and suggest that FIT NBs have a speckle function. Scale bar: 2 µm. Arrowheads indicate colocalization within NBs. G = GFP; R = mRFP. Fluorescence protein analysis was conducted in transiently transformed N. benthamiana leaf epidermis cells, following the standardized FIT NB analysis procedure. In all examined cells, the proteins showed full colocalization. Representative images from four to seven independent experiments are shown. Contrast of images in A at t = 5 was enhanced for better assessment. For data with type I markers (no colocalization) and type II markers (partial colocalization) see Fig. S3, A and B; and Fig. 5.
Figure 7.
Figure 7.
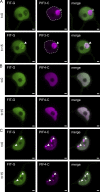
FIT colocalized with PB markers in distinct PBs. Confocal images showing localization of FIT-GFP and PB markers upon coexpression in the nucleus at t = 0 and t = 15 min. (A–C) Coexpression of FIT-GFP with A, PIF3-mCherry, and B and C, PIF4-mCherry, in B, showing a typical pattern with the absence of NBs (∼50% of nuclei), and in C, showing a typical pattern with the presence of NBs (∼50% of cells). When FIT-GFP was coexpressed with PB markers, FIT NBs did not appear at t = 5 min, but instead, FIT-GFP colocalized with PB markers in PBs at t = 15 min. PIF3-mCherry localized predominantly to a single large PB at t = 0 and t = 15 min. FIT-GFP colocalized with PIF3-mCherry in this single large PB at t = 15 min. PIF4-mCherry and FIT-GFP were both homogeneously distributed in the nucleoplasm at t = 0 and t = 15 min, or FIT-GFP colocalized with PIF4-mCherry in PBs at t = 0 and t = 15 min. The same localization patterns were found for PIF3-mCherry and PIF4-mCherry upon single expression (compare with Fig. S3, H–J). Hence, FIT-GFP was recruited to the two distinct types of PIF3 and PIF4 PBs, whereas PIF3 and PIF4 were not recruited to FIT NBs. This suggests that FIT NBs are affected by the presence of PIF3- and PIF4-containing PBs and a connection to light signaling exists. Scale bar: 2 µm. Arrowheads indicate colocalization in PBs. G = GFP; C = mCherry. Fluorescence protein analysis was conducted in transiently transformed N. benthamiana leaf epidermis cells, following the standardized FIT NB analysis procedure. In all examined cells, PIF3 and FIT colocalized fully, while PIF4 and FIT colocalized as indicated in B and C. Representative images from four to six independent experiments are shown.
Figure 8.
Figure 8.
Root iron reductase activity is promoted under blue light. Root iron reductase activity assay on 6-d-old Arabidopsis seedlings grown under white light for 5 d under iron-deficient and iron-sufficient conditions and then exposed for 1 d to blue, red, far-red light or darkness, or in parallel as control to white light. (A) Induction of iron reductase activity upon iron deficiency versus sufficiency was higher under blue light than compared to the white light control. (B) Exposure to red light did not change the iron reductase activity compared to the white light control. (C and D) Plants exposed to far-red light and darkness did not show induction of iron reductase activity under iron-deficient conditions compared with iron-deficient conditions. Two experiments were conducted, one representative result is shown. Bar diagrams represent the mean and standard deviation of four replicates with four seedlings each (n = 4). Statistical analysis was performed with one-way ANOVA and Tukey post-hoc test. Different letters indicate statistically significant differences (P < 0.05).
Figure 9.
Figure 9.
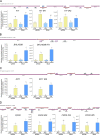
Induction of FIT target gene expression is enhanced under blue light. Gene expression analysis of total transcript abundance of iron deficiency genes FIT, BHLH039, FRO2, and IRT1 on 6-d-old Arabidopsis seedlings grown under white light for 5 d under iron deficient and iron sufficient conditions and then exposed for 1 d to blue, red, far-red light or darkness, or in parallel as control to white light. (A and B) FIT and bHLH039 gene induction in response to low iron supply did not change after blue light exposure compared to the white light control. (C and D) FRO2 and IRT1 gene expression increased after blue light exposure in iron-deficient conditions compared to respective iron-sufficient conditions and white light control. (E) FIT gene expression did not change after red light exposure compared to the white light control. (F and G) BHLH039 and FRO2 gene expression decreased after red light exposure in iron deficient conditions compared to respective iron sufficient condition and white light control. (H) IRT1 gene expression did not change after red light exposure compared to the white light control. (I) FIT gene expression did not change after far-red light exposure compared to the white light control. (J–L) BHLH039, FRO2, and IRT1 gene expression decreased after far-red light exposure in iron-deficient conditions compared with white light deficient condition comparable with the respective iron sufficient condition and iron sufficient white light control. (M) FIT gene expression was higher in darkness under iron-deficient conditions compared with respective iron sufficient condition and white light control. (N–P) BHLH039, FRO2, and IRT1 gene expression decreased after being exposed to darkness in iron-deficient conditions compared to white light-deficient conditions comparable with the respective iron-sufficient condition and iron-sufficient white light control. Two experiments were conducted, and one representative result is shown. Bar diagrams represent the mean and standard deviation of three replicates with 12 seedlings and two technical replicates each (n = 3). Statistical analysis was performed with one-way ANOVA and Tukey post-hoc test. Different letters indicate statistically significant differences (P < 0.05).
Figure S4.
Figure S4.
Differential expression of intron retention splicing variants of iron deficiency genes in response to iron deficiency and blue light (supports Fig. 9). (A–D) Gene expression analysis of total transcript abundance of iron deficiency genes A, FIT, B, BHLH039, C, IRT1, and D, FRO2 and selected transcripts with intron retention (IR) splicing variants previously reported for these genes (Li et al., 2013). 5-d-old Arabidopsis seedlings grown under white light for 5 d under iron-deficient and iron-sufficient conditions were exposed for 1.5–2 h to blue light and in parallel as control to white light. At the top of A–D, an overview of exon–intron structures and sites of qPCR primers detecting IR variant transcripts and respective total amounts of transcripts is shown. At the bottom, gene expression data for the indicated gene products is shown. The absolute expression levels of IR variant transcripts were at least 20–40 times lower than those of total transcripts. (A) Due to the low abundance of FIT IR splicing variants, there was only one case where gene expression was significantly changed in response to an environmental treatment. FIT IR1 was upregulated under iron deficiency versus sufficiency in blue light, similar to FIT. There was no significant difference for FIT IR2 splicing variant. (B) BHLH039 and BHLH039 IR1 splicing variant gene expression increased significantly in response to low iron supply and after blue light exposure compared to the white light control. (C) IRT1 and IRT1 IR2 splicing variant gene expression was significantly higher under iron-deficient versus sufficient conditions. Gene induction in response to low iron supply did not change after blue light exposure compared with the white light control but was increased for IRT1 IR2 splicing variant. (D) FRO2 gene expression was enhanced under blue light versus white light in iron-deficient conditions. The three FRO2 IR3-5 splicing variants were more abundant under iron deficiency than sufficiency, but not differently regulated between white and blue light. Four experiments were conducted, and one representative result is shown. Bar diagrams represent the mean and standard deviation of three replicates with 20 seedlings and two technical replicates each (n = 3). Statistical analysis was performed with one-way ANOVA and Tukey post-hoc test. Different letters indicate statistically significant differences (P < 0.05).
Figure S5.
Figure S5.
The variations in gene expression levels between white light and blue light are consistent across both intron retention splicing variants and the overall transcript pool (supports Figs. 9 and S4). (A–D) Ratios of absolute normalized gene expression levels in white light versus blue light for total transcript abundance of iron deficiency genes A, FIT, B, BHLH039, C, IRT1, and D, FRO2 and of previously reported intron retention (IR) splicing variants (Li et al., 2013). Respective absolute normalized gene expression levels and explanations about the experiment are represented in Fig. S4. The ratios obtained for the four conducted experiments are presented from left to right. No differences in the ratios were found between the transcript abundance of IR splicing variants versus total transcript abundance. Bar diagrams represent the mean and standard deviation of three ratios (n = 3). Statistical analysis was performed with one-way ANOVA and Tukey post-hoc test. Different letters indicate statistically significant differences (P < 0.05). n/a = no gene expression value.
Figure 10.
Figure 10.
Summary model illustrating the effect of blue light on FIT NB formation and iron uptake, suggesting that FIT NBs are related to transcriptional and posttranscriptional regulation in speckles and that blue light has a promoting effect on iron uptake. FIT accumulates in FIT NBs upon induction with blue light. FIT NBs are reversible, dynamic, and of circular shape and may undergo LLPS. FIT homodimers and FIT–bHLH039 heterodimers are present in FIT NBs. FIT–bHLH039 is an active TF complex for upregulating the expression of iron acquisition genes in roots (Gratz et al., 2019). Hence, FIT NBs are subnuclear sites related to transcriptional regulation and because of their colocalization with speckle components, also to speckles. Blue light enhances root iron reductase activity and gene expression of FRO2 and IRT1, all of which are downstream of FIT–bHLH039. In summary, FIT NBs are blue light-inducible subnuclear sites where active TF complexes of FIT and bHLH039 accumulate, linking transcriptional and posttranscriptional regulation in speckles with a promoting blue light effect on iron uptake. The figure has been created with the help of https://BioRender.com.

References

    1. Abdallah, H.B., and Bauer P.. 2016. Quantitative reverse transcription-qPCR-based gene expression analysis in plants. Methods Mol. Biol. 1363:9–24. 10.1007/978-1-4939-3115-6_2 - DOI - PubMed
    1. Ali, G.S., Golovkin M., and Reddy A.S.N.. 2003. Nuclear localization and in vivo dynamics of a plant-specific serine/arginine-rich protein. Plant J. 36:883–893. 10.1046/j.1365-313X.2003.01932.x - DOI - PubMed
    1. Bancaud, A., Huet S., Rabut G., and Ellenberg J.. 2010. Fluorescence perturbation techniques to study mobility and molecular dynamics of proteins in live cells: FRAP, photoactivation, photoconversion, and FLIP. Cold Spring Harb. Protoc. 2010:top90. 10.1101/pdb.top90 - DOI - PubMed
    1. Bauer, D., Viczián A., Kircher S., Nobis T., Nitschke R., Kunkel T., Panigrahi K.C.S., Adám E., Fejes E., Schäfer E., and Nagy F.. 2004. Constitutive photomorphogenesis 1 and multiple photoreceptors control degradation of phytochrome interacting factor 3, a transcription factor required for light signaling in Arabidopsis. Plant Cell. 16:1433–1445. 10.1105/tpc.021568 - DOI - PMC - PubMed
    1. Bauer, P., Ling H.Q., and Guerinot M.L.. 2007. FIT, the FER-LIKE IRON DEFICIENCY INDUCED TRANSCRIPTION FACTOR in Arabidopsis. Plant Physiol. Biochem. 45:260–261. 10.1016/j.plaphy.2007.03.006 - DOI - PubMed

Publication types

MeSH terms