. 2024 Apr 1;221(4):e20231425.
doi: 10.1084/jem.20231425. Epub 2024 Feb 23.

CXCL12+ dermal fibroblasts promote neutrophil recruitment and host defense by recognition of IL-17

Affiliations

CXCL12+ dermal fibroblasts promote neutrophil recruitment and host defense by recognition of IL-17

Kellen J Cavagnero et al. J Exp Med. .

Abstract

The skin provides an essential barrier for host defense through rapid action of multiple resident and recruited cell types, but the complex communication network governing these processes is incompletely understood. To define these cell-cell interactions more clearly, we performed an unbiased network analysis of mouse skin during invasive S. aureus infection and revealed a dominant role for CXCL12+ fibroblast subsets in neutrophil communication. These subsets predominantly reside in the reticular dermis, express adipocyte lineage markers, detect IL-17 and TNFα, and promote robust neutrophil recruitment through NFKBIZ-dependent release of CXCR2 ligands and CXCL12. Targeted deletion of Il17ra in mouse fibroblasts resulted in greatly reduced neutrophil recruitment and increased infection by S. aureus. Analogous human CXCL12+ fibroblast subsets abundantly express neutrophil chemotactic factors in psoriatic skin that are subsequently decreased upon therapeutic targeting of IL-17. These findings show that CXCL12+ dermal immune acting fibroblast subsets play a critical role in cutaneous neutrophil recruitment and host defense.


Conflict of interest statement

Disclosures: R.L. Gallo is a cofounder and consultant of MatriSys Bioscience and has equity interest in this company. No other disclosures were reported.

Figures
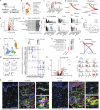
Figure 1.
Figure 1.
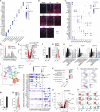
Skin response to S. aureus infection reveals IL-17–mediated CXCL12+ dermal fibroblastneutrophil communication. (A) S. aureus (USA300 LAC strain) i.d. infection model. (A–G and I–O) scRNA-Seq of back skin. Data were obtained from samples pooled from N = 4 mice independently treated in each group. (B) Dimensionality reduction colored by cell type in control (vehicle) and infected mice. (C) Proportion of each cell type in control and infected mice. (D) Network analysis showing communication toward myeloid cells (left) and from fibroblast (right). Edge weight is proportional to communication strength. Edge and node color indicates communication source. (E) DEGs in fibroblast during infection using Wilcoxon Rank Sum test. Log2 fold-change and P value (adjusted) cut-offs are 0.5 and 0.05, respectively. (F) GSEA of fibroblasts using Kyoto encyclopedia of genes and genomes (KEGG) and gene ontology (GO) databases. (G) Expression of IL-17 signaling score and specific genes related to IL-17 signaling across cell types. (H) Gene expression by qPCR over time following S. aureus infection using bulk skin samples. Data are means ± SEM and representative of two independent experiments with N = 3 mice. (I) Fibroblast dimensionality reduction colored by cluster. The dashed line separates FB1–FB7 and FB8–FB11. (J) Expression of fibroblast subset markers across clusters. Boxes highlight high expression of reticular and adipocyte lineage genes in FB1–FB7 and high expression of papillary and myofibroblast genes in FB8–FB11. (K) GO term analysis comparing FB1–FB7 and FB8–FB11. (L) Network analysis showing outgoing communication from FB1–FB7 and FB8–FB11 toward neutrophils and other myeloid cells. Edge weight is proportional to communication strength. Edge and node color indicates communication source. (M) Neutrophil chemokine expression across fibroblast clusters. (N) DEGs between neutrophil chemokine+/− fibroblasts during infection using Wilcoxon Rank Sum test. Log2 fold-change and P value (adjusted) cut-offs are 0.5 and 0.05, respectively. (O) Expression of neutrophil chemokine+/− fibroblast markers during infection. (P) Representative confocal CXCL1 and CXCL12 immunostaining in skin 2 days after S. aureus infection and control. Upper inset, papillary. Lower inset, reticular. Scale bar, 50 μm. Dashed line represents epidermal–dermal junction.
Figure S1.
Figure S1.
CXCL12+ dermal fibroblastneutrophil communication during S. aureus infection. (A–E) Mouse back skin with intradermal S. aureus infection. (A and C–E) scRNA-Seq with data obtained from samples pooled from the skin of N = 4 mice independently treated in each group. (A) Expression of top three cell type marker genes. (B) Representative GR-1 (neutrophils) immunostaining. Scale bar, 150 μm. (C) Expression of top three fibroblast cluster marker genes. (D) Frequency of fibroblast clusters in infected and control mice. (E) DEGs between FB1–FB7 and FB8–FB11 during infection using Wilcoxon Rank Sum test. Log2 fold-change and P value (adjusted) cut-offs are 0.5 and 0.05, respectively. (F) Frequency of neutrophil chemokine+/− fibroblast during infection. (G) Frequency of neutrophil chemokine+/− cells across FB1–FB7 and FB8–FB11 during infection. (H–P) Analysis of scRNA-Seq data from mouse back skin with S. aureus epicutaneous infection. Samples were pooled from the skin of N = 5 mice independently treated in each group. (H) Expression of neutrophil chemokines across cell types. (I) Fibroblast dimensionality reduction colored by cluster. Dashed line separates FB1–FB10 and FB11–FB16. (J) Expression of fibroblast subset markers across clusters. Boxes highlight high expression of reticular and adipocyte lineage genes in FB1–FB10 and high expression of papillary and myofibroblast genes in FB11–FB16. (K) GO term analysis comparing FB1–FB10 and FB11–FB16. (L) Neutrophil chemokine expression across fibroblast clusters. (M) Frequency of neutrophil chemokine+/− fibroblast during infection. (N) Frequency of neutrophil chemokine+/− cells across FB1–10 and FB11–16 during infection. (O) DEGs between neutrophil chemokine+ and neutrophil chemokine− fibroblasts during infection using Wilcoxon Rank Sum test. Log2 fold-change and P value (adjusted) cut-offs are 0.5 and 0.05, respectively. (P) Expression of neutrophil chemokine+/− fibroblast markers during infection.
Figure 2.
Figure 2.
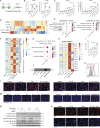
IL-17 synergizes with TNFα to induce preadipocyte fibroblast NF-κB and production of neutrophil chemokines. (A) Schematic of in vitro assay to test the effect of Th17 CM on fibroblasts used in B. (B) 3T3-L1 fibroblast gene expression by qPCR following treatment with Th17 CM ± anti–IL-17A blocking antibody (aIL-17A) or control isotype antibody. (C) Recombinant cytokine-stimulated 3T3-L1 gene expression by qPCR. (D–G) Bulk RNA-Seq of 3T3-L1 cells. Data were obtained from samples pooled from N = 3 independent biological replicates in each group. (D) Expression of top 2,000 genes with the highest variance between groups, scaled by column. (E) GO analysis of genes upregulated compared to vehicle control (left) and TNFα (right). (F) Expression of select genes, scaled by row. (G) GO analysis of upregulated genes conserved among TNFα and IL-17A treated 3T3-L1s, primary MDFBs, and HPADs. (H) Multiplex immunoassay of 3T3-L1 CM, scaled by row. Averages shown for N = 3. (I) CXCL12 ELISA of 3T3-L1 CM. (J) Representative LCN2 western blot of 3T3-L1 CM. (K) Representative CXCL1 intracellular cytokine staining in 3T3-L1s. (L) Representative CXCL1 and CXCL12 immunostaining in 3T3-L1s. Scale bar, 50 μm. (M) Representative CRAMP and LCN2 immunostaining in 3T3-L1s. Scale bar, 150 μm. (N) Representative phosphorylation (phospho) western blots in 3T3-L1s. (O) Representative p65 immunostaining in 3T3-L1s. Scale bar, 50 μm. Data in B–O are representative of at least two independent experiments with N = 3. Error bars represent SEM. FMO, fluorescence minus one; AMPs, antimicrobial peptides; ns (not significant), *P < 0.05, **P < 0.01, ***P < 0.001, and ****P < 0.0001 using unpaired t test. Source data are available for this figure: SourceData F2.
Figure S2.
Figure S2.
IL-17 and TNFα activate preadipocyte fibroblasts. (A and B) Gene expression in 3T3-L1 fibroblasts by qPCR following stimulation with (A) toll ligands (data pooled from two independent experiments with N = 3) and (B) recombinant cytokines. (C) Gene expression in 3T3-L1s by qPCR following Tnfrsrf1a or scramble control siRNA knockdown and subsequent stimulation with recombinant cytokines. (D and E) Gene expression in WT (D) and Tnfrsrf1a−/− (E) primary MDFBs by qPCR following stimulation with recombinant cytokines. (F) Expression of top 50 variable genes per group in MDFBs by bulk RNA-Seq, scaled by row. Data were obtained from samples pooled from N = 3 independent biological replicates in each group. (G and H) HPADs stimulated with recombinant cytokines. Expression of top 2,000 (G) and top 50 (H) variable genes by bulk RNA-Seq, scaled by row. Data were obtained from samples pooled from N = 3 independent biological replicates in each group. (I) Gene expression by qPCR. (J) Representative LCN2 immunostaining in MDFB. Scale bar, 150 μm. (K) Representative CXCL1 intracellular cytokine staining (left) and quantification (right) in primary MDFBs. (L) CXCL8 ELISA with HPAD CM. (M and N) MDFB (M) and HPAD (N) gene expression by qPCR following addition of recombinant cytokines. Data in B–N are representative of at least two independent experiments with N = 2–3. FMO, fluorescence minus one; ns (not significant), *P < 0.05, **P < 0.01, ***P < 0.001, and ****P < 0.0001 using unpaired t test.
Figure 3.
Figure 3.
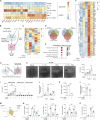
Preadipocyte fibroblasts activate and recruit neutrophils using the master transcriptional regulator NFKBIZ. (A) 3T3-L1 fibroblast gene expression by bulk RNA-Seq following Nfkbiz or control siRNA knockdown, scaled by column. Data were obtained from samples pooled from N = 3 independent biological replicates in each group. (B) Schematic for 3T3-L1 CM induced neutrophil activation assay used in C–F. Bulk RNA-Seq data were obtained from samples pooled from N = 3 independent biological replicates in each group. (C) Expression of top 2,000 variable genes, scaled by row. (D) Identification of genes specifically upregulated in neutrophils by activated fibroblasts (left, 478 genes, highlighted in red) and identification of the in vivo relevant subset (right, 67 genes, highlighted in red). (E) GO analysis of the 67 in vivo relevant genes. (F) Expression of the 67 in vivo relevant genes in neutrophils following stimulation with fibroblast CM, scaled by row. (G) Schematic for 3T3-L1 CM induced leukocyte migration assay used in H–P. (H) Representative images of migrated leukocytes (left) and quantification (right). Scale bar, 750 μm. (I) Migrated leukocyte subsets. Multiplier indicates fold increase. (J) Neutrophil migration assay using Tnfrsf1a−/− primary MDFB CM. Data were pooled from two independent experiments with N = 2–3. (K) Neutrophils migrated following pertussis toxin (P. toxin) treatment. (L) Neutrophils migrated using CM from 3T3-L1 following Nfkbiz siRNA knockdown. Data were pooled from three independent experiments with N = 3. (M) 3T3-L1 gene expression of neutrophil chemokines with corresponding receptors from bulk RNA-Seq in Fig. 2. Data were obtained from samples pooled from N = 3 independent biological replicates in each group. (N) Neutrophils, monocytes, and lymphocytes migrated following pharmacological inhibitor pretreatment. (O) Neutrophils migrated using CM from 3T3-L1 following Cxcl12 or control siRNA knockdown. Data in A, C–I, K, and M–O are representative of at least two independent experiments with N = 3. Error bars represent SEM. ns (not significant), *P < 0.05, **P < 0.01, ***P < 0.001, and ****P < 0.0001 using unpaired t test.
Figure S3.
Figure S3.
Mechanism of preadipocyte fibroblast activation by IL-17A and TNFα. (A and B) Expression of top 2,000 (A) and top 50 (B) variable genes in 3T3-L1 fibroblasts by bulk RNA-Seq following Nfkbiz siRNA knockdown and subsequent stimulation with recombinant cytokines. Data were obtained from samples pooled from N = 3 independent biological replicates in each group. (C) DEGs in 3T3-L1s by qPCR following Nfkbiz siRNA knockdown. Averages shown for N = 3. (D–F) Gene expression in 3T3-L1s by qPCR following pharmacological inhibition of JNK (D), P38 MAPK (E), and JAK (F). Averages shown for N = 3. (G) Gene expression in 3T3-L1s by qPCR following Hif1 siRNA knockdown or scramble control siRNA knockdown. Averages shown for N = 3. Heatmaps were all scaled by row. Data in A–G are representative of at least two independent experiments.
Figure S4.
Figure S4.
CXCL12+ fibroblastneutrophil communication in vitro. (A) Representative bone marrow neutrophil (CD11b+Ly6G+) purity following magnetic bead separation. (B) qPCR of neutrophil activation markers following stimulation with 3T3-L1 fibroblast CM. Fibroblasts were treated with Nfkbiz siRNA or scramble control then IL-17A and TNFα. (C) Flow cytometry gating strategy. (D) Leukocyte migration assay with primary MDFB CM. (E and F) Migration assay with purified neutrophils using CM from 3T3-L1 fibroblast treated IL-17A and TNFα (E) or adipocyte differentiation media (adipogenesis) (F). (G) Migration assay with WT and Lcn2−/− MDFB CM. Data were pooled from two independent experiments with N = 2–3. (H) Migration assay with WT and Camp−/− MDFB CM. (I) Migration assay using 3T3-L1 fibroblast CM pretreated with MIF pharmacological inhibitor. (J) Expression of CXCL12 receptors in purified bone marrow neutrophils by qPCR. (K) Migration assay with MDFB CM and pharmacological inhibitors targeting CXCR2 and CXCR4. (L) Migration assay using CM from 3T3-L1s with Cxcl12 or scramble control siRNA knockdown. Data in A–B, D–F, and H–L are representative of two to three independent experiments with N = 3. ns (not significant), *P < 0.05, **P < 0.01, ***P < 0.001, and ****P < 0.0001 using unpaired t test.
Figure S5.
Figure S5.
Dermal fibroblast recognition of IL-17 in murine and human type 17 inflammation. (A) Gene expression by bulk RNA-Seq in primary MDFBs from Fig. S2. Data were obtained from samples pooled from three independent biological replicates in each group. (B) Krt14 and Pdgfra expressions were measured by qPCR in separated epidermis, dermis, and isolated MDFB from the skin of PdgfraΔIl17ra and Cre− control mice. Data are representative of two independent experiments with N = 3 mice. (C) Total live CD11b+Ly6G−CD45+ cells (monocytes and macrophages) in rmIL-17A and rmTNFα challenged mouse skin on day 3. Data were pooled from three independent experiments with N = 2–3 mice. (D) Representative MOMA-2 (monocytes and macrophages) immunostaining on day 2 after i.d. S. aureus infection. Scale bar, 150 μm. (E–J) Mouse back skin in IMQ model. (E–G) scRNA-Seq analysis. Data were obtained from samples pooled from skin of N = 4 mice independently treated in each group. (E) Expression of top 3 marker genes for each cell type. (F) Proportion of each cell type in mice treated with IMQ or vehicle (control). (G) Gene expression across cell types. (H) Gene expression by qPCR in enzymatically separated epidermis and dermis following IMQ treatment. Data are representative of two independent experiments with N = 3 mice. (I) Representative GR-1 (neutrophils) and CXCL1 immunostaining. Scale bar, 50 μm. Dashed lines outline hair follicles. (J) Total live CD11b+Ly6G−CD45+ cells (monocytes and macrophages) in IMQ-treated mice. Data were pooled from three independent experiments with N = 3 mice. (K–M) Human psoriasis (N = 3 donors) and healthy control (N = 3 donors) skin scRNA-Seq. (K) Expression of top three marker genes for each cell type. (L) Expression of top three marker genes for each fibroblast cluster. (M) Frequency of neutrophil chemokine+/− fibroblast in psoriasis. (N) Frequency of neutrophil chemokine+/− cells across FB1–FB6 and FB7–FB11 in psoriasis. (O) Representative H&E staining of lesional skin biopsies with and without anti–IL-17 treatment. Scale bar, 300 μm. N.D. (not detected), ns (not significant), **P < 0.01, ***P < 0.001, and ****P < 0.0001 using unpaired t test.
Figure 4.
Figure 4.
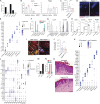
Fibroblast IL-17 signaling is required for neutrophil recruitment to the skin and defense against S. aureus. (A) Il17ra expression in separated epidermis, dermis, and isolated dermal fibroblasts (MDFB) from the skin of Pdgfra-Cre × Il17ra fl/fl (PdgfraΔIl17ra) conditional knockout mice and control Cre− littermates. Data are representative of two independent experiments with N = 3 mice. (B) MDFB gene expression by qPCR following in vitro stimulation. Data are representative of two independent experiments with N = 3. (C) Schematic of recombinant cytokine-induced model of in vivo neutrophil recruitment used in D–J. (D) Representative GR-1 (neutrophil) immunostaining in WT mice. Scale bar, 150 μm. (E–J) Recombinant cytokine injection model with PdgfraΔIl17ra and Cre− littermates (control). The experiment was performed three times with N = 2–3 mice per independent experiment. Naïve skin was harvested in a separate experiment with N = 3 mice. (E) Representative images of mouse skin and quantification of inflammation. Scale bar, 3 mm. (F) Expression of neutrophil chemokines, proinflammatory cytokines, and other host defense genes by qPCR, scaled by column. Averages shown for N = 3–9 mice. (G) Total number of live cells. (H) Representative FACS plot of percent neutrophils (CD11b+Ly6G+) of CD45+ live cells and quantification. (I) Percent neutrophils of total live cells. (J) Total number of live neutrophils. Data in F–J were pooled from independent experiments. (K) Intradermal S. aureus infection (USA300 LAC strain with agrI YFP reporter) model used with PdgfraΔIl17ra and Cre− littermates (control) in L–O. The experiment was performed five times with N = 3–6 mice per independent experiment ending on day 5 and N = 4 mice per independent experiment ending on day 2. (L) Expression of neutrophil chemokines, proinflammatory cytokines, and other host defense genes on day 2 by qPCR, scaled by column. Averages are shown for N = 3–4 mice. Naïve mouse data are the same as in F. (M) Representative GR-1 (neutrophils) immunostaining on day 2. Scale bar, 300 μm. (N and O) (N) Representative in vivo day 2 images of S. aureus reporter expression and quantification and (O) representative day 1 images of lesions and size quantification (N = 8–13 mice). Scale bars, 10 mm for N and 2 mm for O. Data in N–O were pooled from independent experiments. Error bars represent SEM. ns (not significant), **P < 0.01, ***P < 0.001, and ****P < 0.0001 using unpaired t test.
Figure 5.
Figure 5.
Fibroblast IL-17 signaling is required for neutrophil skin inflammation in an IMQ-induced psoriasis model. (A) Schematic of IMQ induced psoriasis model. (B–D) scRNA-Seq using back skin from WT mice treated with IMQ or vehicle (control). Data were obtained from samples pooled from N = 4 mice independently treated in each group. (B) Network analysis showing communication toward myeloid cells (left) and from fibroblasts (right). Edge weight is proportional to communication strength. Edge and node color indicates communication source. (C) GSEA of fibroblast using KEGG database. (D) Expression of host defense genes in fibroblast. (E–J) IMQ model in Pdgfra-Cre × Il17ra fl/fl (PdgfraΔIl17ra) and Cre− littermates (control). The experiment was performed three times with N = 2–4 mice per independent experiment. (E) Expression of neutrophil chemokines, proinflammatory cytokines, and other host defense genes by qPCR, scaled by column. Averages shown for N = 3–5 mice. Naïve mouse data are the same as in Fig. 4 F. (F) Representative immunostaining for CXCL1, CXCL12, and GR-1 (neutrophils). Scale bar, 150 μm. (G) Representative FACS plot of percent neutrophils (CD11b+Ly6G+) of CD45+ live cells and quantification. (H) Percent neutrophils of total live cells. (I) Total number of live neutrophils. Data in G–I were pooled from independent experiments. Error bars represent SEM. ***P < 0.001, and ****P < 0.0001 using unpaired t test.
Figure 6.
Figure 6.
scRNA-Seq of human skin reveals IL-17–mediated CXCL12+ dermal fibroblastneutrophil communication in psoriasis. (A–K) Analysis of scRNA-Seq of skin from psoriasis patients (N = 3) and healthy controls (N = 3). (A) Dimensionality reduction is split by condition and colored by cell type. (B) Network analysis showing communication toward myeloid cells (left) and from fibroblasts (right). Edge weight is proportional to communication strength. Edge and node color indicates communication source. (C) GSEA of fibroblasts using KEGG database. (D) Expression of neutrophil chemokines across cell types. (E) Dimensionality reduction of fibroblast subset colored by cluster. Dashed line separates FB1–FB6 and FB7–FB11. (F) Expression of fibroblast subset marker genes across clusters. Boxes highlight high expression of reticular and adipocyte lineage genes in FB1–FB6 and high expression of papillary and myofibroblast genes in FB7–FB11. (G) GO term analysis comparing FB1–FB6 and FB7–FB11. (H) Network analysis showing communication from FB1–FB6 and FB7–FB11 toward neutrophils and other myeloid cells. (I) Neutrophil chemokine expression across fibroblast clusters. (J) DEGs between neutrophil chemokine+/− fibroblasts in psoriasis using Wilcoxon Rank Sum test. Log2 fold-change and P value (adjusted) cut-offs are 0.5 and 0.05, respectively. (K) Expression of neutrophil chemokine+/− fibroblast markers in psoriasis. (L) Expression of genes associated with fibroblast–neutrophil communication by bulk RNA-Seq in human psoriasis patients on and off anti–IL-17A treatment, scaled by row. Averages shown for N = 8–10. (M) Representative CXCL1 and CXCL12 immunostaining in lesional skin from psoriasis patients untreated and treated with anti–IL-17A. Scale bar, 300 μm.

References

    1. Al-Sayegh, M., Ali H., Jamal M.H., ElGindi M., Chanyong T., Al-Awadi K., and Abu-Farha M.. 2021. Mouse embryonic fibroblast adipogenic potential: A comprehensive transcriptome analysis. Adipocyte. 10:1–20. 10.1080/21623945.2020.1859789 - DOI - PMC - PubMed
    1. Balabanian, K., Lagane B., Infantino S., Chow K.Y., Harriague J., Moepps B., Arenzana-Seisdedos F., Thelen M., and Bachelerie F.. 2005. The chemokine SDF-1/CXCL12 binds to and signals through the orphan receptor RDC1 in T lymphocytes. J. Biol. Chem. 280:35760–35766. 10.1074/jbc.M508234200 - DOI - PubMed
    1. Boehme, S.A., Franz-Bacon K., Chen E.P., Sásik R., Sprague L.J., Ly T.W., Hardiman G., and Bacon K.B.. 2009. A small molecule CRTH2 antagonist inhibits FITC-induced allergic cutaneous inflammation. Int. Immunol. 21:81–93. 10.1093/intimm/dxn127 - DOI - PMC - PubMed
    1. Boothby, I.C., Kinet M.J., Boda D.P., Kwan E.Y., Clancy S., Cohen J.N., Habrylo I., Lowe M.M., Pauli M., Yates A.E., et al. . 2021. Early-life inflammation primes a T helper 2 cell-fibroblast niche in skin. Nature. 599:667–672. 10.1038/s41586-021-04044-7 - DOI - PMC - PubMed
    1. Bouma, G., Ancliff P.J., Thrasher A.J., and Burns S.O.. 2010. Recent advances in the understanding of genetic defects of neutrophil number and function. Br. J. Haematol. 151:312–326. 10.1111/j.1365-2141.2010.08361.x - DOI - PubMed