. 2024 Feb 23:12:RP91903.
doi: 10.7554/eLife.91903.

Piezo1 mechanosensing regulates integrin-dependent chemotactic migration in human T cells

Affiliations

Piezo1 mechanosensing regulates integrin-dependent chemotactic migration in human T cells

Chinky Shiu Chen Liu et al. Elife. .

Abstract

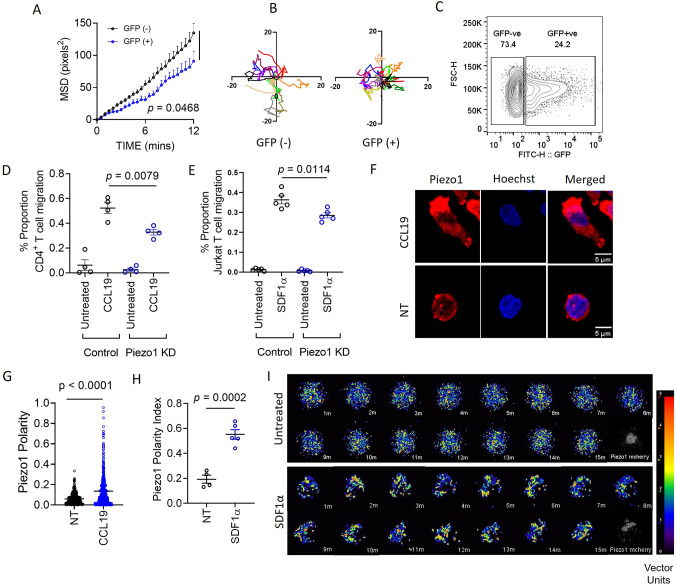
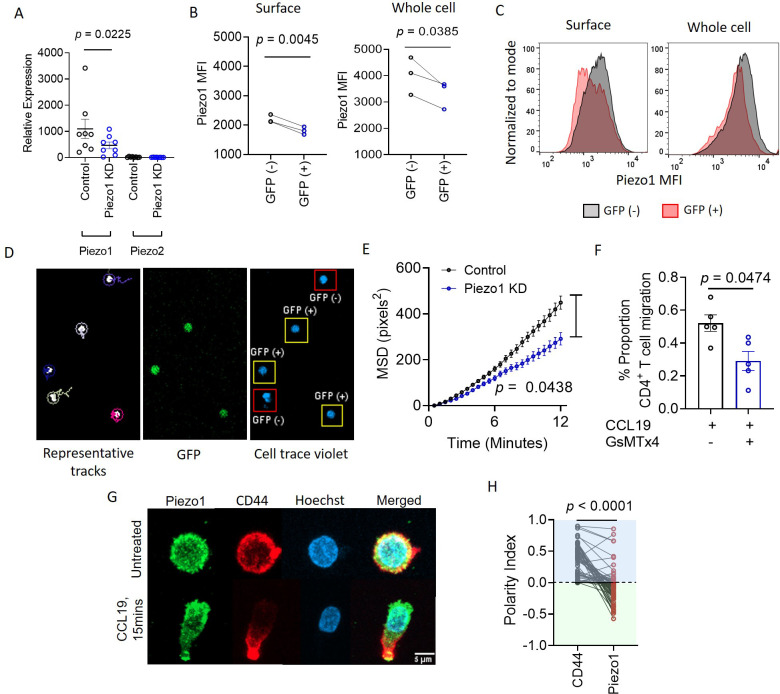
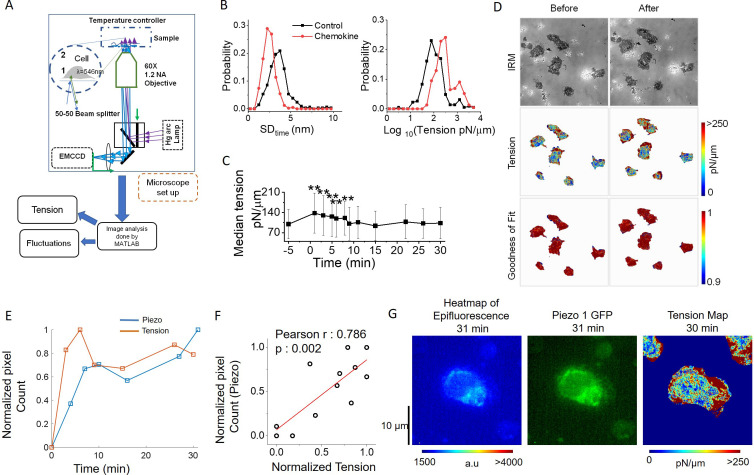
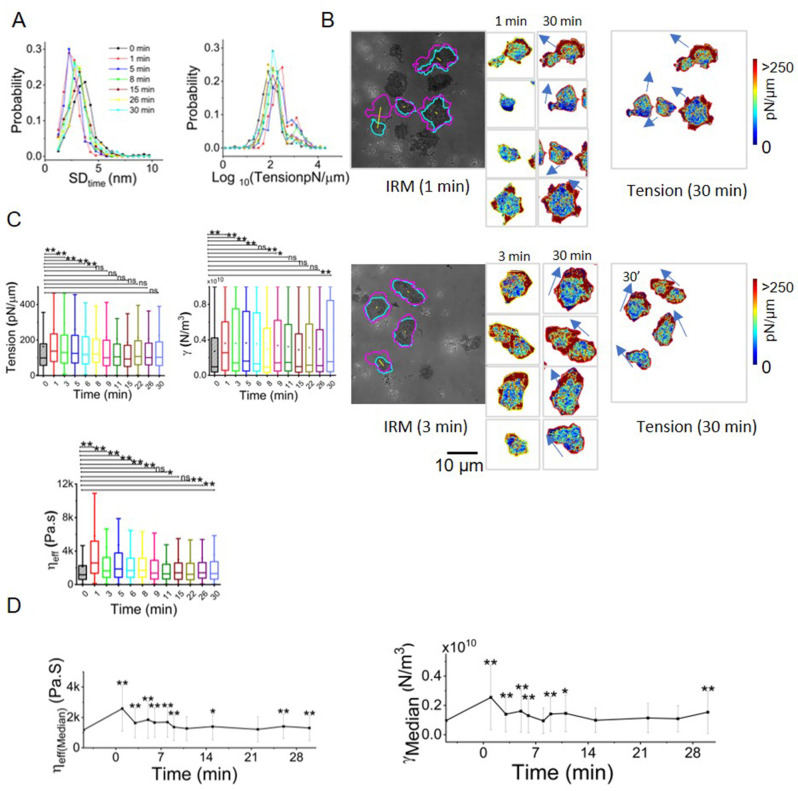
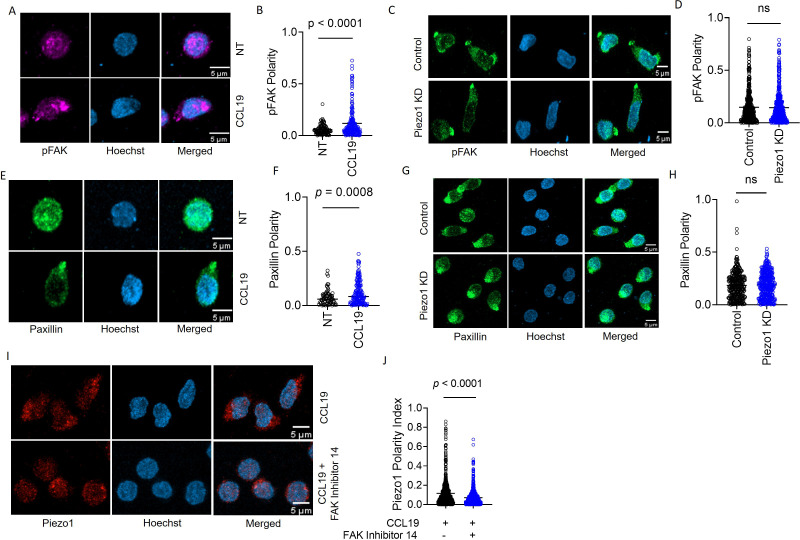
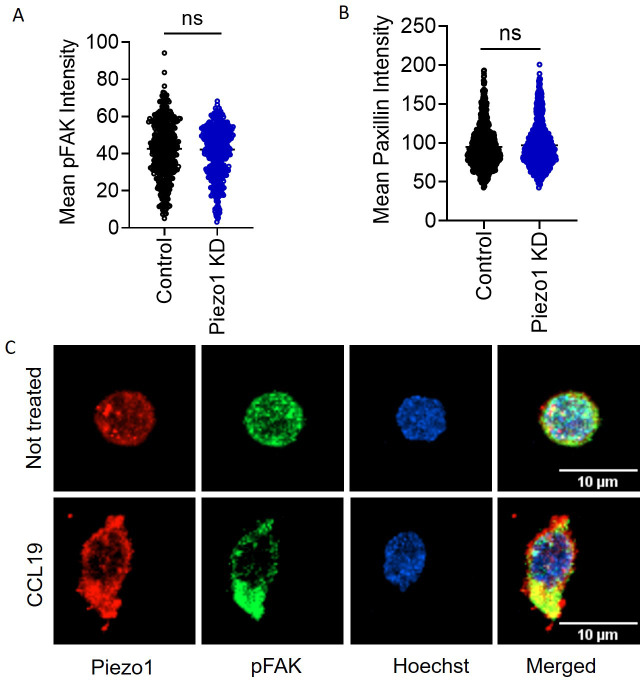
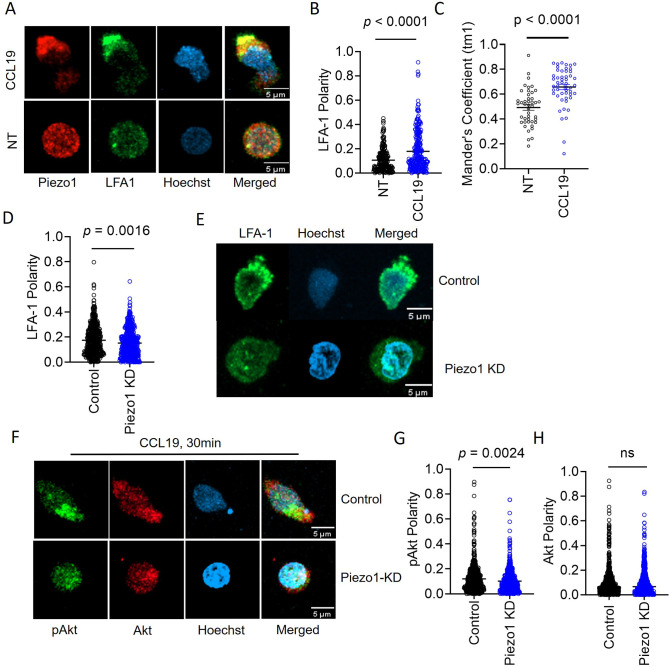
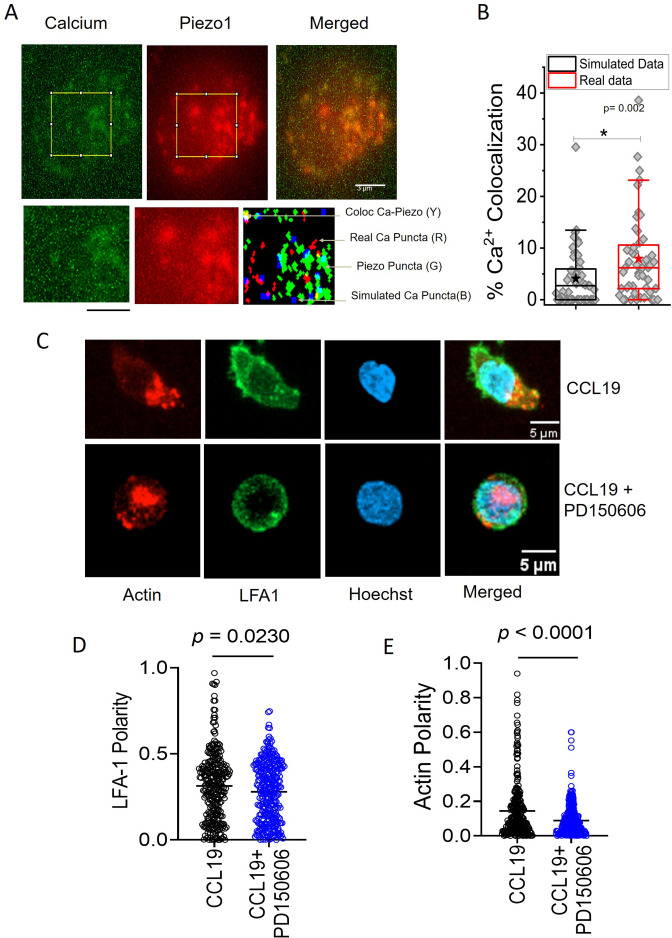
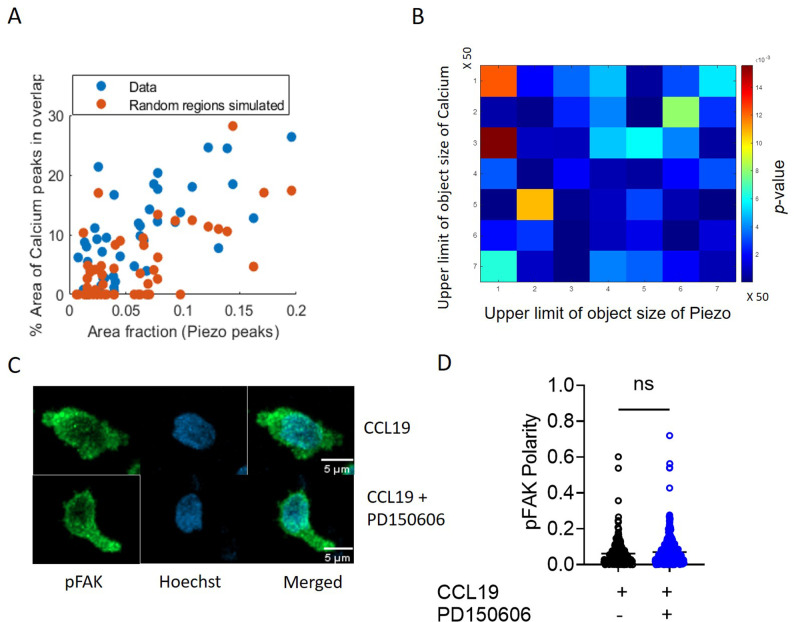
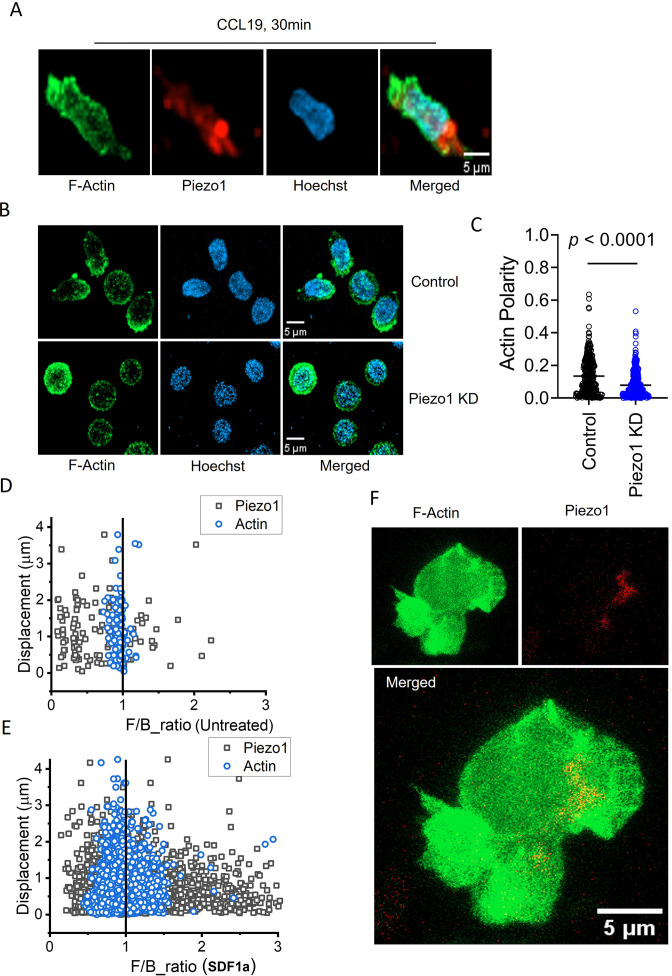
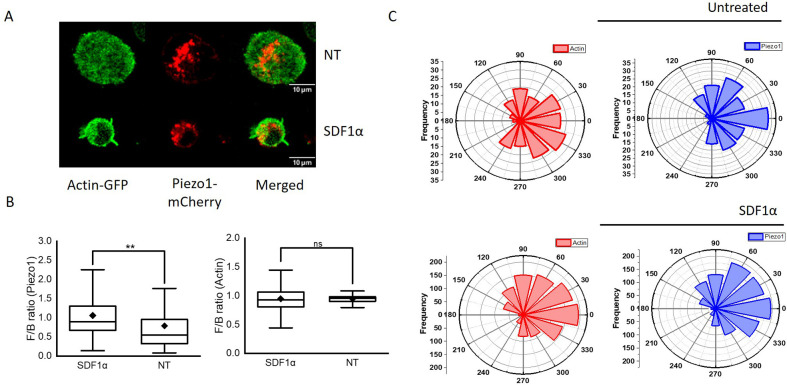
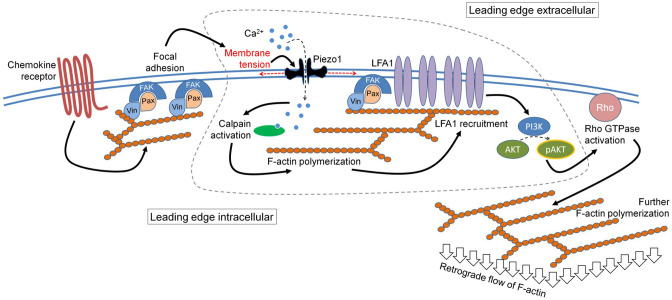
T cells are crucial for efficient antigen-specific immune responses and thus their migration within the body, to inflamed tissues from circulating blood or to secondary lymphoid organs, plays a very critical role. T cell extravasation in inflamed tissues depends on chemotactic cues and interaction between endothelial adhesion molecules and cellular integrins. A migrating T cell is expected to sense diverse external and membrane-intrinsic mechano-physical cues, but molecular mechanisms of such mechanosensing in cell migration are not established. We explored if the professional mechanosensor Piezo1 plays any role during integrin-dependent chemotaxis of human T cells. We found that deficiency of Piezo1 in human T cells interfered with integrin-dependent cellular motility on ICAM-1-coated surface. Piezo1 recruitment at the leading edge of moving T cells is dependent on and follows focal adhesion formation at the leading edge and local increase in membrane tension upon chemokine receptor activation. Piezo1 recruitment and activation, followed by calcium influx and calpain activation, in turn, are crucial for the integrin LFA1 (CD11a/CD18) recruitment at the leading edge of the chemotactic human T cells. Thus, we find that Piezo1 activation in response to local mechanical cues constitutes a membrane-intrinsic component of the 'outside-in' signaling in human T cells, migrating in response to chemokines, that mediates integrin recruitment to the leading edge.

Keywords: F-actin; LFA1; Piezo1; cell biology; cell migration; chemotaxis; confocal microscopy; focal adhesion kinase; human; human T cells; immunology; inflammation; interference reflection microscopy; mechanosensing.


Conflict of interest statement

CL, TM, PB, MH, PB, BS, JS, RD, DS, BS, DG No competing interests declared

Figures

Figure 1.
Figure 1.. Piezo1 deficiency abrogates integrin-dependent motility in human T cells which is mediated through redistribution of Piezo1 at the leading edge in response to chemokine stimulation.
(A) MSD versus time calculated for GFP+ (potential Piezo1-knockdown cells) and GFP- (potential control cells) in GFP plasmid and Piezo1 siRNA co-transfected human CD4+ T lymphocytes, that were allowed to migrate in the presence of recombinant CCL19 on ICAM1-coated dishes. (B) Representative tracks of GFP- and GFP+ CD4+ T lymphocytes. (C) Comparisons of % GFP+ cells after 72 hr of nucleofection. (D & E) 3-D transwell migration assay of siRNA-transfected primary human CD4+ T lymphocytes (D) and Jurkat T cells (E), respectively. (F) Representative confocal images of Piezo1 distribution in fixed untreated and CCL19-treated CD4+ T lymphocytes. 63 X oil magnification. (G) Comparison between Piezo1 polarity index calculated for fixed, stained, human CD4+ T lymphocytes with or without 0.5 µg/ml CCL19 treatment for 15 min. n>510 random cells, each. (H) Piezo1 polarity index calculated for Jurkat cells, expressing mCherry-tagged Piezo1 during live-cell tracking in the presence of recombinant SDF1α. Each dot represents the polarity index of each cell, averaged over all the time-frames. (I) Representative time kinetics of particle image velocimetry (PIV) analysis of Piezo1-mcherry transfected Jurkat cells, allowed to move on ICAM-coated dishes in the presence of recombinant SDF1α. Top panel: No chemokine. Bottom Panel: SDF1α. All data is representative of at least three independent experiments. Student’s t-test was used to calculate significance and data is represented as mean ± S.E.M.
Figure 1—figure supplement 1.
Figure 1—figure supplement 1.. Piezo1 facilitates integrin-dependent human CD4+ T lymphocyte migration by localizing to the leading edge of cells in response to chemokine stimulation.
(A) Quantitative PCR analysis of Piezo1 and Piezo2 relative expression, in control and Piezo1 siRNA-transfected CD4+ T lymphocytes. (B) Flow cytometric measurement of Piezo1 mean fluorescence intensity, MFI (left: surface staining; right: intracellular staining) in Piezo1 siRNA and GFP co-transfected cells. (C) Representative histograms of Piezo1 MFI in GFP (-) and GFP (+) cells in surface stained (left) and intracellularly stained (right) cells. (D) Representative 2-D tracks (left), GFP signal (middle), and cell trace violet signal of CD4+ T cells (right). 20 X magnification. (E) MSD tracks of control siRNA (n=357 cells) and Piezo1 siRNA-transfected CD4+ T cells (n=348 cells) on ICAM1-coated wells in the presence of CCL19. (F) Effect of Piezo1 inhibition by GsMTx4 on 3D ICAM1-coated transwell migration. (G) Representative confocal images depicting anti-polarity of Piezo1 and CD44 (uropod) in untreated and CCL19-stimulated conditions. (H) Polarity indices calculated for Piezo1 and CD44, where negative polarity for Piezo1 means anti-polarity (described in detail in Methods section). n=69 cells, each. All data shown is representative of at least three independent experiments. Student’s t-test was used to calculate significance and data is represented as mean ± S.E.M.
Figure 2.
Figure 2.. Piezo1 redistribution in migrating T cells follows increased membrane tension in the leading edge.
(A) Schematic illustration of interference reflection microscopy imaging setup. (B) Probability distribution of the amplitude of temporal fluctuations (SDtime, left) and tension (right) before and after the addition of chemokines. (C) Temporal trajectory of tension of cells before and after addition of chemokine with ** indicating a significant difference from control. (D) Representative IRM images of Jurkat cells (top), corresponding tension maps (middle), and R2 maps (bottom), before and after 3 min of chemokine treatment. (E) Correlation between normalized Piezo intensity, tension magnitudes with time. (F) Scatter plot to show the correlation between the normalized pixel count of Piezo1 and normalized tension. Piezo1 intensity at specific time-points were correlated with tension magnitudes at the preceding timepoints. Normalization has been done such that the maximum value is set to 1 and others are accordingly scaled. (G) Colour-coded Piezo1-GFP intensity map (middle), epifluorescence image (left), and tension map (right) of representative Piezo1-GFP expressing Jurkat cell, after 30 min of 0.1 µg/ml of SDF1α treatment.
Figure 2—figure supplement 1.
Figure 2—figure supplement 1.. Chemokine stimulation increases leading edge membrane tension in human CD4+ T lymphocytes.
(A) Probability distribution of temporal fluctuation (left) and tension (right) followed over time, (B) Tension maps showing high-tension edges aligning with direction of cell migration (arrows) before and after addition of chemokine. Cells from two fields (top and bottom panel) are depicted. (C) Box plots of time-kinetics of tension (upper left), confinement (upper right), effective cytoplasmic viscosity (lower left). (D) Temporal trajectory of effective cytoplasmic viscosity (left) and confinement (right) of cells before and after addition of chemokine with ** indicating a significant difference from control. ns=p>0.0042, *p<0.0042, **p<0.000083 derived using Mann-Whitney U Test with Bonferroni correction. Ncells = 21, NFBR (control) = 1594, NFBR (1 min)=1228, NFBR (3 min)=643, NFBR (5 min)=1349, NFBR (6 min)=594, NFBR (8 min)=1056, NFBR (9 min)=1562, NFBR (11 min)=638, NFBR (15 min)=1843, NFBR (22 min)=741, NFBR (26 min)=2019, NFBR (30 min)=2,746. Scale bar = 10 μm.
Figure 3.
Figure 3.. Focal adhesion following chemokine receptor activation does not depend on Piezo1.
(A) Representative confocal images of human CD4+ T lymphocytes, fixed and stained for phospho-FAK (pFAK) under untreated and CCL19-treated conditions. (B) Increased polarity of pFAK upon chemokine stimulation of CD4+ T lymphocytes as compared to unstimulated controls. n>120 cells, each. (C) Representative confocal images of pFAK distribution in control and Piezo1 siRNA-transfected CD4+ T lymphocytes stimulated with chemokine. (D) Comparison of pFAK polarity in CCL19-stimulated control and Piezo1-knockdown CD4+ T lymphocytes. n>450 random cells, each. (E) Representative confocal images of paxillin distribution in untreated versus CCL19-stimulated CD4+ T lymphocytes. (F) Increased paxillin polarity in response to CCL19 stimulation as compared to untreated CD4+ T lymphocytes. Untreated n>70, CCL19-treated n>150. (G) Representative confocal images of immunostained paxillin in chemokine-stimulated, control and Piezo1-knockdown CD4+ T lymphocytes. (H). Comparison of paxillin polarity in CCL19-stimulated control and Piezo1-knockdown CD4+ T lymphocytes. n>550 random cells, each. (I) Representative confocal images of stained Piezo1 in CD4+ T cells stimulated with CCL19 in the presence or absence of FAK inhibitor 14. (J) Effect of focal adhesion kinase (FAK) inhibition on Piezo1 polarity in CD4+ T lymphocytes stimulated with recombinant CCL19 versus untreated cells. n>600 random cells, each. All data represented is from at least three independent experiments. Student’s t-test was used to calculate significance and data is represented as mean ± S.E.M.
Figure 3—figure supplement 1.
Figure 3—figure supplement 1.. Piezo1 acts downstream of focal adhesion formation and localizes to sites of focal adhesions formed in response to chemokine stimulation.
(A) Mean signal intensity of pFAK in CCL19-treated control and Piezo1 KD cells (n>440 random cells, each). (B) Mean signal intensity of paxillin in CCL19-treated control and Piezo1 KD cells (n>780 random cells, each). (C) Representative images of pFAK and Piezo1 colocalization in untreated (top panel) and CCL19-treated (bottom panel) CD4+ T cells. All data generated is of at least three independent experiments. Student’s t-test was used to calculate significance and data is represented as mean ± S.E.M.
Figure 4.
Figure 4.. Membrane recruitment of LFA1 on chemokine receptor activation disrupts Piezo1 deficiency.
(A) Representative confocal images of fixed, immunostained Piezo1 and LFA1 in unstimulated and CCL19-stimulated CD4+ T lymphocytes. (B) Increased LFA1 polarity in response to recombinant CCL19 stimulation in CD4+ T cells. n>295 random cells, each. (C) Manders’ co-localization analysis of Piezo1 and LFA1 in untreated and CCL19-treated CD4+ T lymphocytes. n>100 cells, each. (D) Comparison of LFA1 polarity in chemokine-treated control and Piezo1 knockdown CD4+ T lymphocytes. n>490 random cells, each. (E) Representative confocal stained images of LFA1 polarity of CCL19-treated control and Piezo1-knockdown CD4+ T lymphocytes. (F) Representative confocal images of phospho-Akt (pAkt) and Akt distribution upon chemokine treatment of control and Piezo1-knockdown cells. (G & H) Quantitative analyses of pAkt (G) and Akt (H) polarity in control and Piezo1-knockdown cells after CCL19 treatment. n>580 random cells, each. All data is representative of at least three independent experiments. Student’s t-test was used to calculate significance and data is represented as mean ± S.E.M.
Figure 5.
Figure 5.. Local Ca2+ mobilization with Piezo1 redistribution upon chemokine stimulation.
(A) Representative total internal reflection fluorescence (TIRF) image of a Jurkat Cell stained with Fluo-3, AM and transiently expressing with Piezo1 mCherry. Lower panel: zoomed-in image and overlap of binary images of objects detected from Calcium and Piezo channels as well as simulated randomly placed punctas having similar total (in the zoomed-in section) and average area as that of the Calcium punctas detected in the real images. Overlap RGB image shows the overlap between real calcium (red) and piezo puncta (green), overlap puncta (yellow), and simulated calcium puncta (blue). (B) Comparison between percentage calcium colocalization of simulated data and real data. * Denote p<0.05 calculated using Mann Whitney U test. n cell = 52 (13 cells x 4 time points). NROIS = 52. (C) Representative confocal images of LFA1 and actin distribution in CCL19-stimulated CD4 + T lymphocytes with or without inhibition of calpain. 100 μM of PD15606 was added to the cells 1 hr prior to the addition of chemokine. Quantitative comparisons of (D) LFA1 and (E) actin polarity upon chemokine stimulation, in the presence or absence of calpain pre-inhibition. n>290 random cells, each. All data is generated from at least three independent experiments. Student’s t-test was used to calculate significance and data is represented as mean ± S.E.M.
Figure 5—figure supplement 1.
Figure 5—figure supplement 1.. Active calcium mobilization indicating Piezo1 activity at Piezo1-rich areas of focal adhesions formed independently of Piezo1-mediated actin polymerization.
(A) Scatter plot of how percentage area of Ca2+ peaks (real and simulated) that overlap with Piezo1 varies with area fraction of Piezo1, showing the comparison between real and simulated data. (B) Color matrix of p-value of comparison of % overlap obtained using real data and simulated data. Color denotes p-value. As ‘x’ increases maximum object size used for Piezo1 signal changes. As ‘y’ increases maximum object size used for Ca2+ signal changes. (C) Representative confocal images of human CD4+ T cells fixed and stained for phosphorylated focal adhesion kinase (pFAK). Cells were treated with CCL19 with or without prior incubation with calpain inhibitor-PD150606. (D) Comparison of pFAK polarity of cells stimulated with CCL19, with or without prior calpain inhibition. n>230 random cells, each. Data is generated from at least three independent experiments. Student’s t-test was used to calculate significance and data is represented as mean ± S.E.M.
Figure 6.
Figure 6.. Piezo1 deficiency disrupts F-actin retrograde flow in T cells despite chemokine receptor activation.
(A) Representative fixed confocal images of actin and Piezo1 distribution in CD4+ T lymphocytes after 30 min of 0.5 µg/ml recombinant CCL19 treatment. (B) Representative fixed confocal images of actin distribution in chemokine-treated, control and Piezo1-knockdown CD4 + T lymphocytes. (C) Quantitative comparison of actin polarity in control and Piezo1-knockdown CD4+ T lymphocytes cells after 30 min of chemokine treatment. n>300 random cells, each. Front-back (F/B) of Piezo1 and actin-GFP in untreated (D) and SDF1α treated (E) Jurkat cells co-expressing actin-GFP and Piezo1-mCherry. (F) A snapshot of time-lapse imaging of Piezo1-mCherry and actin-GFP expressing Jurkat cell treated with 0.1 µg/ml of SDF1α. Image is the maximum Z-projection of the cell at 63 X/1.40 magnification. All data is generated from at least three independent experiments.
Figure 6—figure supplement 1.
Figure 6—figure supplement 1.. Leading edge polarity of Piezo1-mCherry and dynamic distribution of actin-GFP in SDF1α-treated Jurkat cells.
(A) Representative 2D confocal image of Jurkat cell expressing Piezo1 mCherry and actin GFP in the absence (top panel) or presence (bottom panel) of recombinant SDF1α. (B) Box plots depicting Piezo1 mCherry (left) and actin-GFP (right) front-back polarity in untreated (NT) and chemokine-stimulated conditions. (C) Polar plots depicting relative Piezo1 mCherry and actin-GFP spatial distribution in Jurkat cells with respect to direction of cell trajectory in untreated (top panel) and SDF1α (bottom panel) treated cells. Spatial distribution was calculated for all the time points of time-lapse imaging (see methods).
Figure 7.
Figure 7.. The mechanistic model depicting the involvement of Piezo1 mechanosensing in leading-edge events in a migrating T cell.
Proposed model suggests chemokine receptor activation in human T cells leads to focal adhesion kinase activation and focal adhesion formation. Focal adhesions lead to localized increase in membrane tension at the leading-edge plasma membrane which leads to Piezo1 recruitment and activation. Piezo1 activation leads to calpain activation which potentially drives further cytoskeletal consolidation to recruit integrin LFA1. LFA1 recruitment and activation lead to phosphorylation of AKT and downstream signaling eventually driving the retrograde actin flow in migrating human T cells.

Update of

  • doi: 10.1101/2022.08.16.504114
  • doi: 10.7554/eLife.91903.1
  • doi: 10.7554/eLife.91903.2

References

    1. Atcha H, Jairaman A, Holt JR, Meli VS, Nagalla RR, Veerasubramanian PK, Brumm KT, Lim HE, Othy S, Cahalan MD, Pathak MM, Liu WF. Mechanically activated ion channel Piezo1 modulates macrophage polarization and stiffness sensing. Nature Communications. 2021;12:3256. doi: 10.1038/s41467-021-23482-5. - DOI - PMC - PubMed
    1. Barr VA, Bunnell SC. Interference reflection microscopy. Current Protocols in Cell Biology. 2009;Chapter 4:Unit. doi: 10.1002/0471143030.cb0423s45. - DOI - PMC - PubMed
    1. Biswas A, Alex A, Sinha B. Mapping cell membrane fluctuations reveals their active regulation and transient heterogeneities. Biophysical Journal. 2017;113:1768–1781. doi: 10.1016/j.bpj.2017.08.041. - DOI - PMC - PubMed
    1. Biswas A, Kashyap P, Datta S, Sengupta T, Sinha B. Cholesterol depletion by MβCD enhances cell membrane tension and its variations-reducing integrity. Biophysical Journal. 2019;116:1456–1468. doi: 10.1016/j.bpj.2019.03.016. - DOI - PMC - PubMed
    1. Chakraborty M, Mukherjee B, Nalinakshan N, Biswas A, Nayak RK, Sinha B. Effect of heterogeneous substrate adhesivity of follower cells on speed and tension profile of leader cells in primary keratocyte collective cell migration. Biology Open. 2022;11:bio058893. doi: 10.1242/bio.058893. - DOI - PMC - PubMed