. 2024 Feb 23;10(8):eadk8297.
doi: 10.1126/sciadv.adk8297. Epub 2024 Feb 23.

Roles of RNA scaffolding in nanoscale Gag multimerization and selective protein sorting at HIV membranes

Affiliations

Roles of RNA scaffolding in nanoscale Gag multimerization and selective protein sorting at HIV membranes

Yachen Ying et al. Sci Adv. .

Abstract

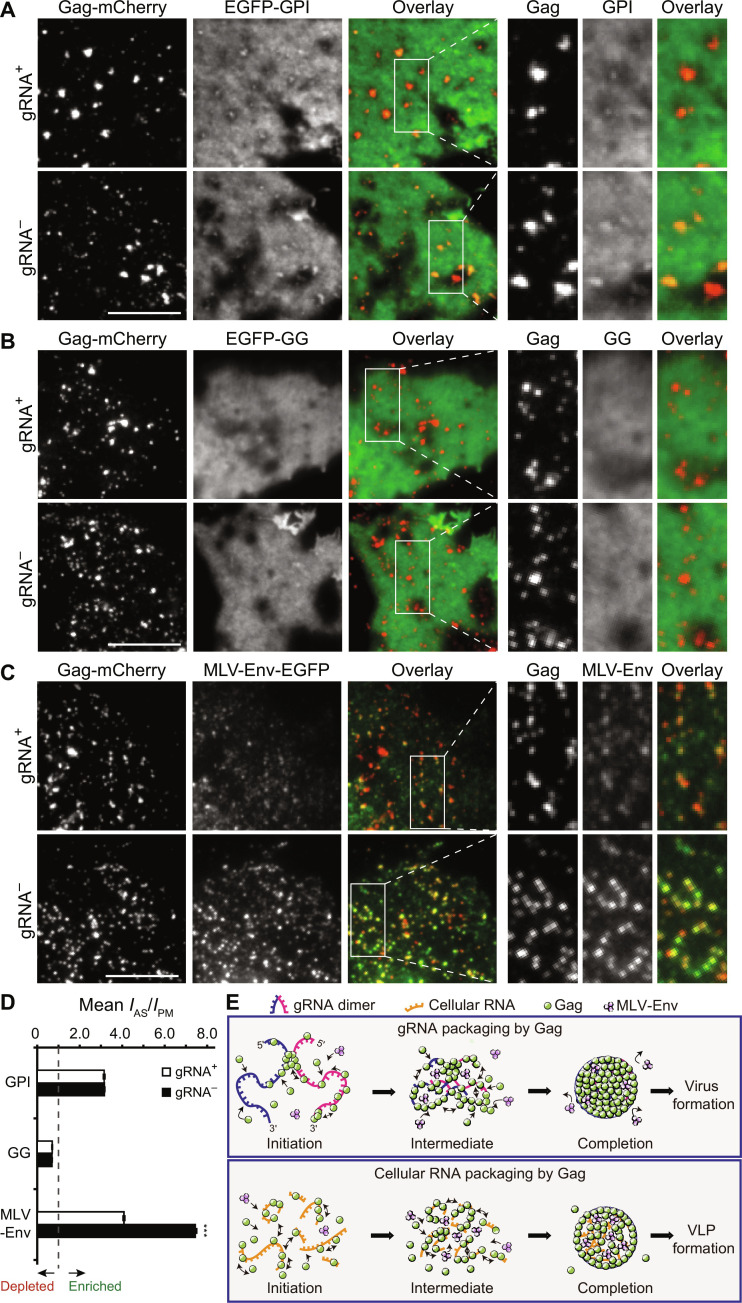
HIV-1 Gag proteins can multimerize upon the viral genomic RNA or multiple random cellular messenger RNAs to form a virus particle or a virus-like particle, respectively. To date, whether the two types of particles form via the same Gag multimerization process has remained unclarified. Using photoactivated localization microscopy to illuminate Gag organizations and dynamics at the nanoscale, here, we showed that genomic RNA mediates Gag multimerization in a more cluster-centric, cooperative, and spatiotemporally coordinated fashion, with the ability to drive dense Gag clustering dependent on its ability to act as a long-stranded scaffold not easily attainable by cellular messenger RNAs. These differences in Gag multimerization were further shown to affect downstream selective protein sorting into HIV membranes, indicating that the choice of RNA for packaging can modulate viral membrane compositions. These findings should advance the understanding of HIV assembly and further benefit the development of virus-like particle-based therapeutics.


Figures

Fig. 1.
Fig. 1.. Establishing transfection conditions for comparing gRNA- and cellular RNA–mediated Gag multimerization by fluorescence imaging.
COS7 cells were cotransfected with pNL4-3ΔPolΔEnv-Gag-mEos3.1 or pCR3.1-Gag-mEos3.1 in a 1:10 ratio with the respective untagged construct. A total of 2 μg of pNL4-3–based constructs and 0.4 μg of pCR3.1-based constructs were transfected to confer similar Gag expression levels in the cell and supernatant between the two transfections (see fig. S2). (A and B) Assessment of Gag expression levels. Western blot was performed with HIV–immunoglobulin (Ig) to detect Gag (55 kDa) and Gag-mEos3.1 (81 kDa) in the (A) cell and (B) supernatant at ~18 hours after transfection of the pNL4-3–based or pCR3.1-based constructs. Gag expression (normalized to the level of Gag yield by pNL4-3–based constructs) and the ratio of Gag and Gag-mEos3.1 in the cell and supernatant were calculated as described in Materials and Methods. Data represent means ± SEM of four experiments. Note that under our transfection conditions, Gag expression levels in the cell and supernatant were similar between the two expression systems, with the ratio of Gag and Gag-mEos3.1 in the cell and supernatant corresponding well to the 1:10 cotransfection ratio in both cases. (C) Assessment of Gag release efficiency (normalized to the level of Gag release yield by pNL4-3–based constructs). Data represent means ± SEM of four experiments.
Fig. 2.
Fig. 2.. Gag forms more densely packed clusters at the PM in the presence of gRNA.
(A) Representative PALM images of Gag in gRNA+ and gRNA cells. Individual spots represent single molecules. Scale bar, 500 nm. (B) Cluster radius distribution of Gag in gRNA+ cells (n = 7983 clusters from eight cells) and gRNA cells (n = 12,757 clusters from eight cells). The inset shows means ± SEM radius. (C) Cluster density distribution of Gag in gRNA+ cells (n = 7983 clusters from eight cells) and gRNA cells (n = 12,757 clusters from eight cells). For each cell, the cluster densities were normalized with respect to the mean density across the entire PM. The inset shows means ± SEM density. (D) Gag cluster density of gRNA+ and gRNA cells from (C) plotted as a function of cluster radius. (E and F) Gag cluster density from (D) was further normalized with respect to the highest mean value, and the results (i.e., degree of clustering) were plotted as a function of the number of mEos3.1 signals detected within clusters for (E) gRNA+ and (F) gRNA cells. The red line represents the nonlinear least-squares fitting of a four-parameter logistic regression model analogous to the Hill equation. For gRNA+ cells, r2 = 0.9998 and apparent cooperative index (nH) = 3.95. For gRNA cells, r2 = 0.9538 and nH = 1.05. For (B) to (F), values were extracted from fixed-cell PALM images using a Hoshen-Kopelman–based algorithm as described in Materials and Methods. ***P < 0.001.
Fig. 3.
Fig. 3.. Gag exhibits more stable dynamics in the presence of gRNA.
(A and B) Analysis of Gag dynamics at the PM of gRNA+ and gRNA cells by HMM-Bayes. (A) Representative full-track movements of Gag. Different diffusion states, denoted as D1 and D2, were represented by different colors (i.e., blue and pink), and the temporal sequence of motion states was shown as a colored bar under each trajectory. (B) Diffusion coefficient (Deff) distribution of Gag in gRNA+ cells (n = 5891 motions from 21 cells) and gRNA cells (n = 8957 motions from 18 cells). The inset shows means ± SEM Deff. (C) The magnitude of motion switching (ΔDeff) between different states. Data represent means ± SEM from n = 120 trajectories from 21 gRNA+ cells and n = 298 trajectories from 18 gRNA cells. (D to F) Analysis of Gag dynamics at the PM of gRNA+ and gRNA cells by tcPALM. (D and E) Representative (D) uniform and (E) stepwise Gag tcPALM profiles as well as their associated cumulative distribution functions (CDFs). (F) Percentage of Gag clusters having uniform or stepwise tcPALM profiles. Data represent means ± SEM of 21 gRNA+ cells and 18 gRNA cells. ***P < 0.001).
Fig. 4.
Fig. 4.. PM proteins exhibit differential partitioning into cellular RNA–mediated versus gRNA-mediated particle assembly sites in COS7 cells.
(A to C) Representative TIRF images of Gag-mCherry and (A) EGFP-GPI, (B) EGFP-GG, and (C) MLV-Env-EGFP at the PM of gRNA+ and gRNA cells at ~18 hours after transfection. The panels on the right are magnified images of the boxed areas in the images. Scale bars, 10 μm. (D) Extents of enrichment and depletion of indicated PM proteins at the Gag assembly sites (means ± SEM, IAS/IPM) in gRNA+ and gRNA cells (see Materials and Methods). For EGFP-GPI, n = 3769 assembly sites from 29 gRNA+ cells and n = 6919 assembly sites from 25 gRNA cells. For EGFP-GG, n = 4203 assembly sites from 27 gRNA+ cells and n = 6103 assembly sites from 23 gRNA cells. For MLV-Env-EGFP, n = 6328 assembly sites from 43 gRNA+ cells and n = 7445 assembly sites from 39 gRNA cells. ***P < 0.001). (E) Schematic model illustrating gRNA- and cellular RNA–mediated Gag multimerization and MLV-Env partitioning at assembly sites. The compact and crowded assembly environment created by gRNA accommodates limited MLV-Env molecules, whereas the less compact and more fluid environment created by cellular RNA is more permissive for MLV-Env incorporation.

References

    1. Rein A., RNA packaging in HIV. Trends Microbiol. 27, 715–723 (2019). - PMC - PubMed
    1. Bieniasz P., Telesnitsky A., Multiple, switchable protein:RNA interactions regulate human immunodeficiency virus type 1 assembly. Annu. Rev. Virol. 5, 165–183 (2018). - PubMed
    1. Freed E. O., HIV-1 assembly, release and maturation. Nat. Rev. Microbiol. 13, 484–496 (2015). - PMC - PubMed
    1. Comas-Garcia M., Davis S. R., Rein A., On the selective packaging of genomic RNA by HIV-1. Viruses 8, 246 (2016). - PMC - PubMed
    1. Rulli S. J., Hibbert C. S., Mirro J., Pederson T., Biswal S., Rein A., Selective and nonselective packaging of cellular RNAs in retrovirus particles. J. Virol. 81, 6623–6631 (2007). - PMC - PubMed

Publication types