. 2024 Feb 23;10(8):eadk3127.
doi: 10.1126/sciadv.adk3127. Epub 2024 Feb 23.

Therapeutic targeting Tudor domains in leukemia via CRISPR-Scan Assisted Drug Discovery

Affiliations

Therapeutic targeting Tudor domains in leukemia via CRISPR-Scan Assisted Drug Discovery

Anthony K N Chan et al. Sci Adv. .

Abstract

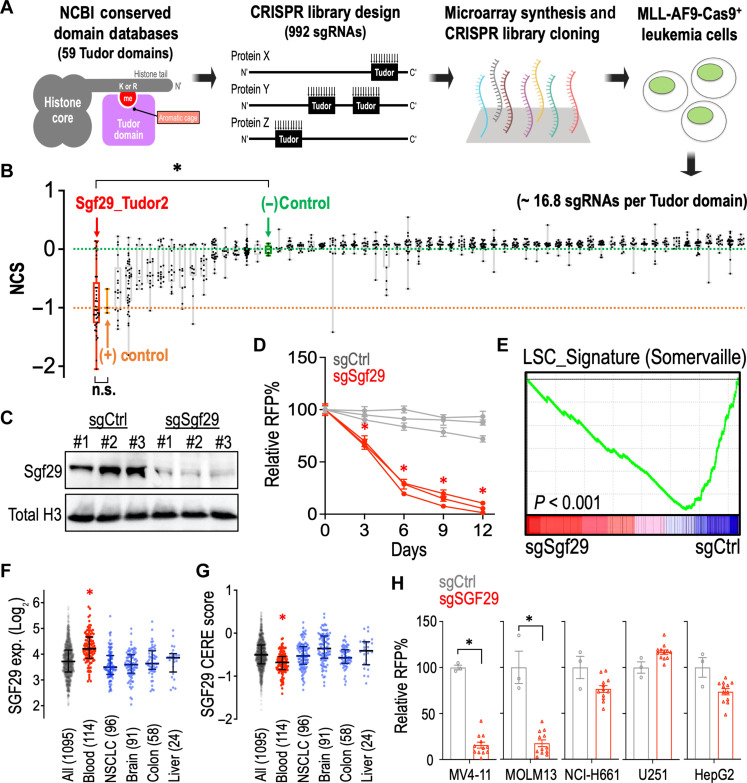
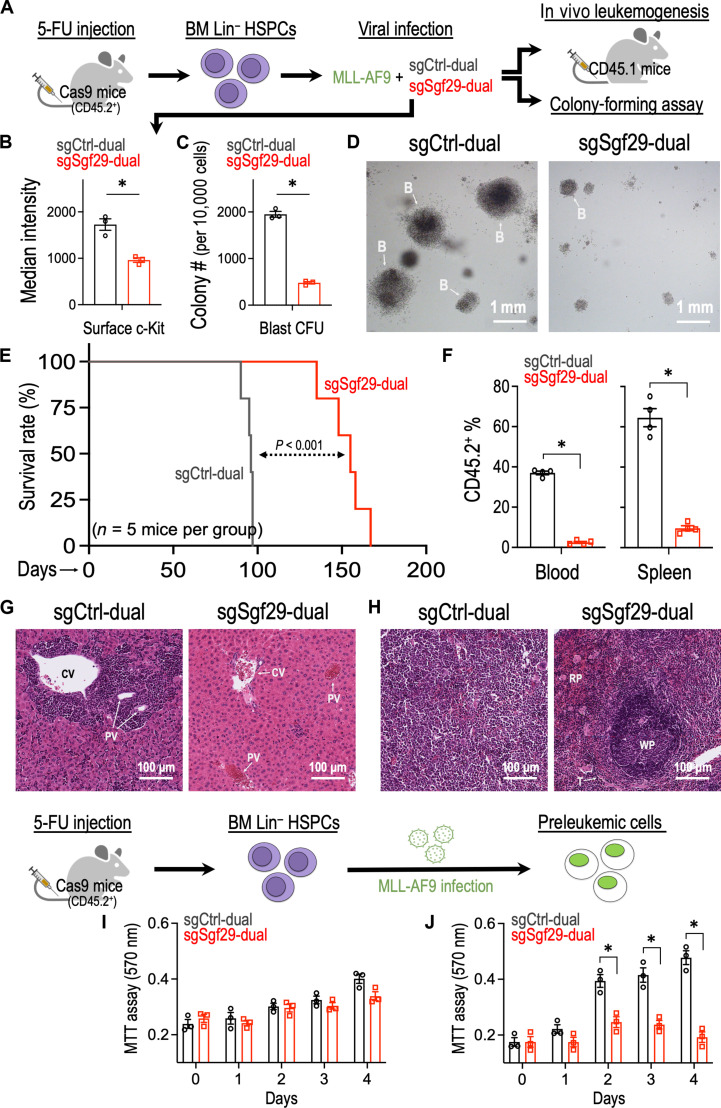
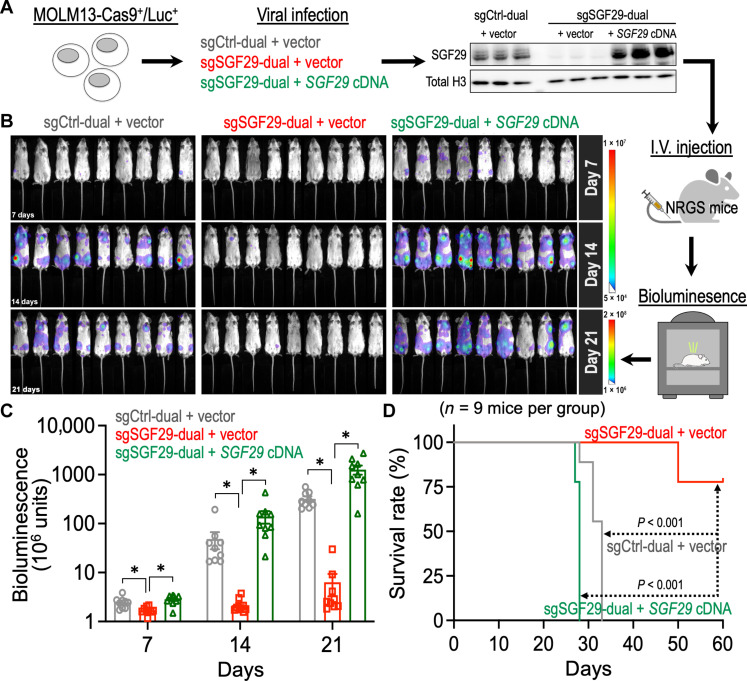
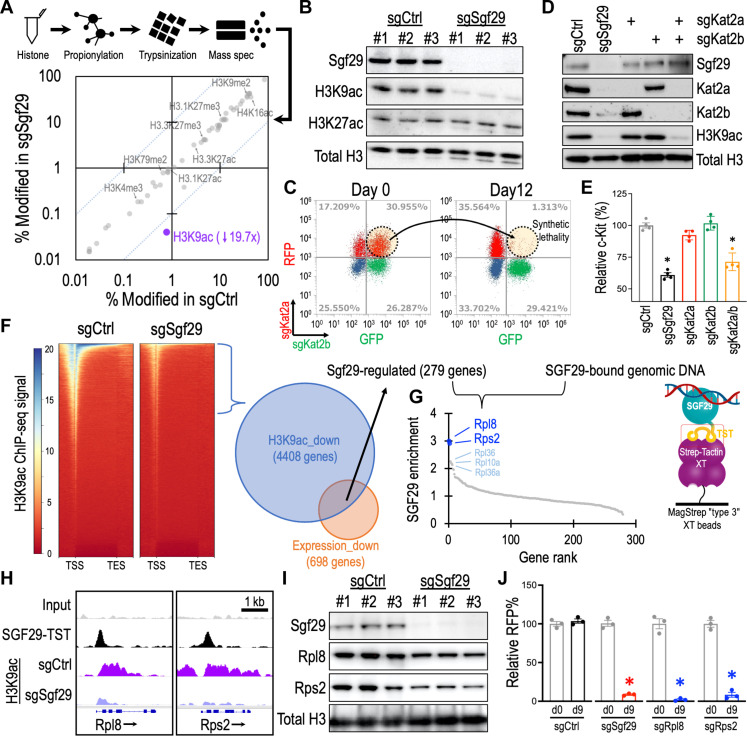
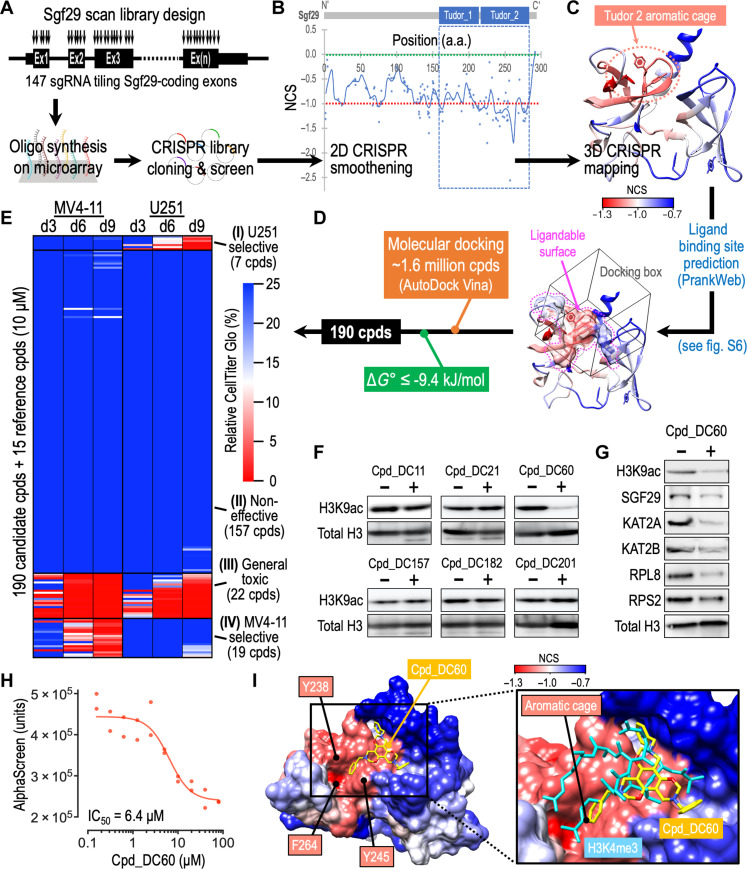
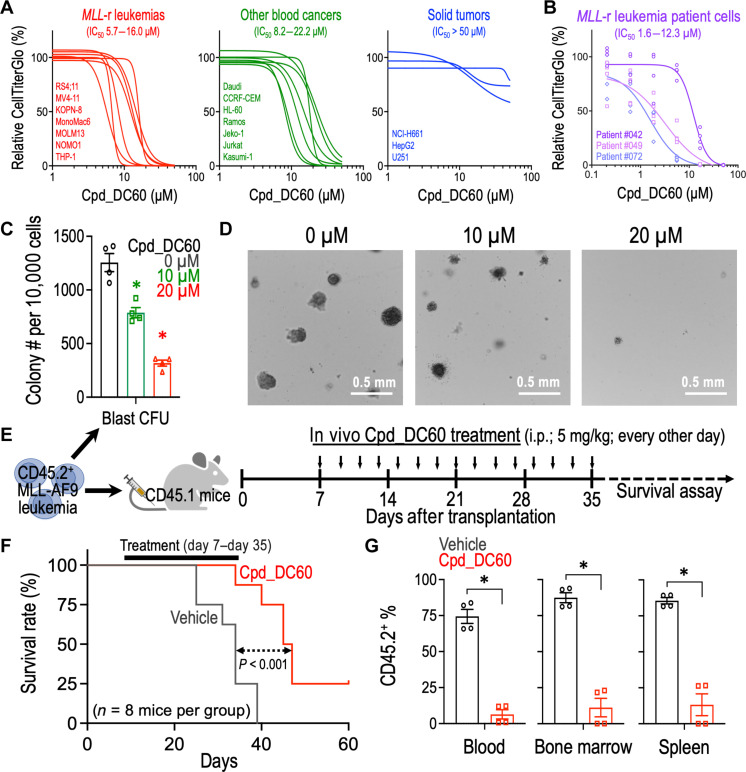
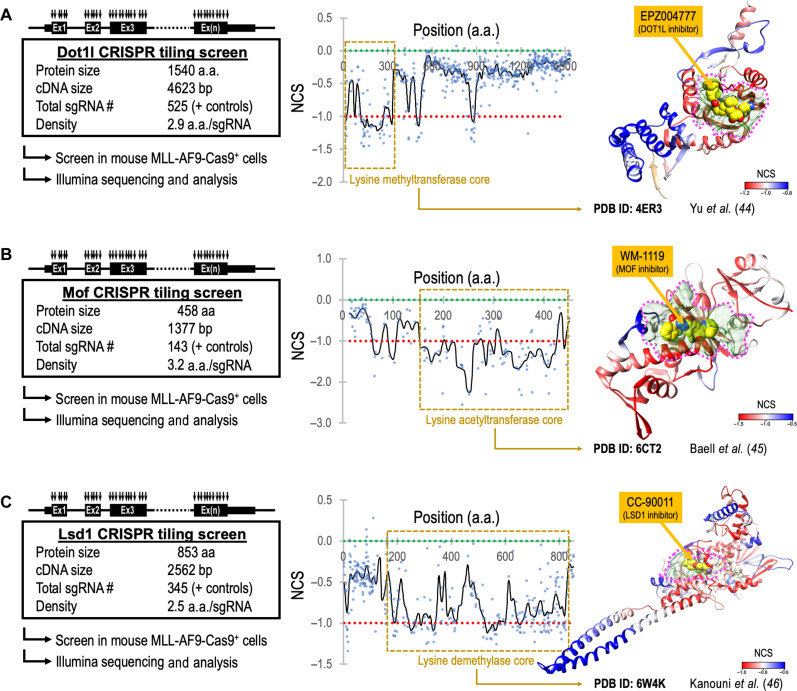
Epigenetic dysregulation has been reported in multiple cancers including leukemias. Nonetheless, the roles of the epigenetic reader Tudor domains in leukemia progression and therapy remain unexplored. Here, we conducted a Tudor domain-focused CRISPR screen and identified SGF29, a component of SAGA/ATAC acetyltransferase complexes, as a crucial factor for H3K9 acetylation, ribosomal gene expression, and leukemogenesis. To facilitate drug development, we integrated the CRISPR tiling scan with compound docking and molecular dynamics simulation, presenting a generally applicable strategy called CRISPR-Scan Assisted Drug Discovery (CRISPR-SADD). Using this approach, we identified a lead inhibitor that selectively targets SGF29's Tudor domain and demonstrates efficacy against leukemia. Furthermore, we propose that the structural genetics approach used in our study can be widely applied to diverse fields for de novo drug discovery.


Figures

Fig. 1.
Fig. 1.. Tudor domain–focused CRISPR screen identifies the essential role of SGF29 in leukemia.
(A) Schematic outline of a Tudor domain-focused CRISPR screen in MLL-AF9-Cas9+ cells. (B) Box whisker plots indicate the median, first and third quartiles, and the normalized CRISPR score (NCS) data range of individual sgRNA (dots) during 12 days of Tudor domain CRISPR screen culture. The median of negative controls (defined as NCS = 0.0; green dashed line) and positive controls (defined as NCS = −1.0; orange dashed line) are indicated. (C) Western blot of Sgf29 and histone H3 in MLL-AF9-Cas9+ cells transduced with sgCtrl and sgSgf29. (D) Growth competition assay of MLL-AF9-Cas9+ cells transduced with red fluorescent protein (RFP)–labeled sgCtrl (gray lines; n = 3 independent sgRNA sequences) and sgSgf29 (red lines; n = 3 independent sgRNA sequences). (E) RNA-seq and GSEA analyses showing changes in expression of the “LSC_Signature” (Somervaille) gene set in sgCtrl- and sgSgf29-transduced MLL-AF9-Cas9+ cells. Dot plots showing the (F) expression level and (G) the CRISPR gene dependency (CERE) score (right) of SGF29 in a total of human 1095 cancer cell lines tested in the DepMap consortium (Broad Institute). (H) Growth competition assay of Cas9-expressing MV4-11, MOLM13, NCI-H661, U251, and HepG2 cells transduced with RFP-labeled sgCtrl (n = 3) and sgSGF29 (n = 12). Data are represented as [(D) and (H)] means ± SEM and [(F) and (G)] median ± interquartile range. *P < 0.01 by two-sided Student’s t test. n.s., not significant.
Fig. 2.
Fig. 2.. SGF29 is required for leukemia development in vivo.
(A) Schematic outline of the primary MLL-AF9 leukemia model with Cas9-mediated Sgf29 depletion. (B) Flow cytometry analysis of c-Kit [phycoerythrin (PE)–Cy7] in MLL-AF9-Cas9+ cells transduced with sgCtrl and sgSgf29 (n = 3). (C) Effect of Sgf29 depletion on the blast-like colony forming ability of MLL-AF9–transduced preleukemic cells (n = 3 for each group). (D) Representative images of the third replating colonies from MLL-AF9–transduced preleukemic cells. B, blast-like colony. (E) Kaplan-Meier survival curve of recipient mice receiving MLL-AF9–transduced leukemic cells with or without Sgf29 depletion (n = 5 mice per group). (F) Percentage of CD45.2+ (donor) cells in the peripheral blood (left) and spleen (right) of the recipient mice (CD45.1) receiving MLL-AF9 (CD45.2+) transduced leukemic cells with or without Sgf29 depletion (n = 4 mice per group; day 90 after transplantation). The CD45.2+ cells represented the engraftment of leukemic MLL-AF9 cells in recipient mice. Hematoxylin and eosin stain of (G) liver and (H) spleen harvested from recipient mice receiving MLL-AF9–transduced leukemic cells with or without Sgf29 depletion. CV, central vein; PV, portal vein; WP, white pulp; RP, red pulp; T, trabecula. Effect of Sgf29 depletion on the proliferation of (I) BM HSPC- and (J) MLL-AF9–transduced preleukemic cells (n = 3 for each group). Data are represented as means ± SEM. *P < 0.01 by two-sided Student’s t test. CFU, colony-forming unit; 5-FU, 5-fluorouracil; MTT, 3-(4,5-dimethylthiazol-2-yl)-2,5-diphenyltetrazolium bromide.
Fig. 3.
Fig. 3.. SGF29 is essential to the maintenance of human leukemia xenografts in vivo.
(A) Schematic outline of a “human-in-mouse” leukemia xenograft model using NRGS mice (recipients) and the Cas9/luciferase-expressing human MOLM13 leukemic cells with or without SGF29 manipulation. (B) In vivo bioluminescent images of NRGS recipient mice transplanted with MOLM13-Cas9+/Luc+ leukemic cells with or without SGF29 manipulation (n = 9 mice per group). (C) Quantitative bioluminescent signal of NRGS recipient mice transplanted with MOLM13-Cas9+/Luc+ leukemic cells with or without SGF29 manipulation (n = 9 mice per group). (D) Kaplan-Meier survival curve of NRGS recipient mice transplanted with MOLM13-Cas9+/Luc+ leukemic cells with or without SGF29 manipulation (n = 9 mice per group). Data are represented as means ± SEM. *P < 0.01 by two-sided Student’s t test. I.V., intravenous.
Fig. 4.
Fig. 4.. SGF29 mediates histone H3K9 acetylation and ribosomal gene expression in leukemia.
(A) Posttranslational modification mass spectrometry of histone proteins harvested from MLL-AF9-Cas9+ cells transduced with sgCtrl (x axis) and sgSgf29 (y axis) for 3 days (n = 3). The dotted lines indicate 10-fold difference between sgSgf29 and sgCtrl. (B) Western blot of MLL-AF9-Cas9+ cells transduced with sgCtrl and sgSgf29 for 3 days. (C) Flow cytometry of MLL-AF9-Cas9+ cells transduced with sgKat2a (RFP+) and sgKat2b (GFP+) on days 0 and 12. (D) Western blot of MLL-AF9-Cas9+ cells transduced with sgCtrl, sgSgf29, sgKat2a, and sgKat2b for 3 days. (E) Flow cytometry of c-Kit in MLL-AF9-Cas9+ cells transduced with sgCtrl, sgSgf29, sgKat2a, and sgKat2b for 3 days. The relative c-Kit (%) indicates the median intensity of c-Kit (PE-Cy7) normalized to the sgCtrl group (n = 4). (F) Left: Heatmaps showing ChIP-seq signal of H3K9ac at gene coding regions from −2 kb of transcription start site (TSS) to +2 kb of transcription end site (TES) for all genes in MLL-AF9-Cas9+ cells transduced with sgCtrl and sgSgf29 for 3 days (n = 3). Right: A total of 279 Sgf29-regulated genes were identified by overlapping 4408 genes with reduced H3K9ac and 698 genes showing reduced expression in the sgSgf29-transduced MLL-AF9 leukemia. (G) High-throughput sequencing of genomic DNA associated with SGF29-TST identified the ribosomal genes in the Sgf29-regulated genes as SGF29-binding targets. (H) Distribution of SGF29-TST and H3K9ac ChIP-seq signal at the Rpl8 and Rps2 loci in MLL-AF9 leukemia. (I) Western blot of MLL-AF9-Cas9+ cells transduced with sgCtrl and sgSgf29 for 3 days. (J) Relative percentages of RFP+ cells in the MLL-AF9-Cas9+ cells transduced with RFP-labeled sgCtrl, sgSgf29, sgRpl8, and sgRps2 day 0 and day 9 (n = 3). Data are represented as means ± SEM. *P < 0.01 by two-sided Student’s t test.
Fig. 5.
Fig. 5.. Identification of SGF29 lead inhibitor by CRISPR-SADD workflow.
(A) Schematic outline of the Sgf29 high-density CRISPR tiling scan in MLL-AF9-Cas9+ cells. (B) Two-dimensional annotation of Sgf29 CRISPR-Scan. The blue line indicates the smoothened model of the CRISPR-Scan score derived from 147 sgRNAs (dots) targeting the coding exons of Sgf29. The median NCS scores of the positive control (red dotted line; defined as −1.0) and negative control (green dotted line; defined as 0.0) sgRNAs are highlighted. The blue dashed box indicates the SGF29-TTD domain. (C) Three-dimensional annotation Sgf29 CRISPR-Scan score relative to an x-ray crystal structural model of human SGF29-TTD (PDB ID: 3ME9). The CRISPR hypersensitive (red) aromatic cage of SGF29 Tudor_2 domain is highlighted. (D) Docking box (cube) defined by overlapping the PrankWeb predicted ligandable protein surface (surface contour marked by the dotted pink-line) with the CRISPR hypersensitive region of SGF29-TTD (red areas). (E) Heatmap showing the relative CellTiter Glo signal [% to dimethyl sulfoxide (DMSO) control] of MV4-11 and U251 cells incubated with 205 selected compounds (10 μM) for 3, 6, and 9 days. The effective killing was defined as less than 10% relative CellTiter Glo signal on day 9. Four clusters of compounds are identified, including the U251 selective (7 cpds), noneffective (157 cpds), general toxic (22 cpds), and MV4-11 selective (19 cpds) groups. (F and G) Western blot of (F) MOLM13 cells and (G) MV4-11 cells incubated with Cpd_DC60 (20 μM) for 48 hours. (H) Effect of Cpd_DC60 on the SGF29-TTD/H3K4me3 AlphaScreen signal. (I) Left: Docking simulation model of SGF29-TTD (colored by NCS) interacts with Cpd_DC60 (yellow). Right: Overlap of SGF29-TTD/H3K4me3 (cyan) cocrystal structure (PDB ID: 3ME9) with the predicted Cpd_DC60 (yellow) binding post on SGF29-TTD. The “aromatic cage” that consists of Y238, Y245, and F264 is indicated. a.a., amino acid. IC50, median inhibitory concentration.
Fig. 6.
Fig. 6.. Treatment of Cpd_DC60 suppresses leukemia progression in vivo.
(A) Effect of Cpd_DC60 on the relative CellTiter Glo signal (% to DMSO control) in MLL-r leukemia cells (red), non–MLL-r blood cancer cells (green), solid tumor cells (blue), and (B) MLL-r leukemia patient cells. Cells were incubated with Cpd_DC60 for 96 hours. The curve-fit model was performed by GraphPad Prism v9.1.1. (C) Effect of Cpd_DC60 on the blast-like colony-forming ability of MLL-AF9 leukemic cells (n = 4). (D) Representative images of the third replating colonies from MLL-AF9 leukemic cells treated with 0, 10, and 20 μM Cpd_DC60. (E) Schematic outline of the in vivo MLL-AF9 leukemia model for Cpd_DC60 treatment. (F) Kaplan-Meier survival curve of recipient mice receiving MLL-AF9 leukemia with or without Cpd_DC60 regimen (n = 8 mice per group). (G) Percentage of CD45.2+ (donor) cells in the peripheral blood, BM, and spleen of the CD45.1+ recipient mice with or without Cpd_DC60 treatment (n = 4 mice per group; day 36 after transplantation). The CD45.2+ cells represented the engraftment of leukemic MLL-AF9 cells in recipient mice. Data are represented as means ± SEM. *P < 0.01 by two-sided Student’s t test. i.p., intraperitoneal.
Fig. 7.
Fig. 7.. CRISPR-SADD evaluation of therapeutic target genes in leukemia.
High-density CRISPR gene tiling scan of (A) Dot1l, (B) Mof, and (C) Lsd1 in MLL-AF9-Cas9+ leukemia. Left: Schematic outline of the CRISPR library designs and screens in MLL-AF9-Cas9+ cells. Middle: Two-dimensional annotation of CRISPR tiling scans. The black lines indicate the smoothened model of the CRISPR-Scan score derived from individual sgRNAs (dots). The median NCS scores of the positive control (red dotted line; defined as −1.0) and negative control (green dotted line; defined as 0.0) sgRNAs are highlighted. The brown dashed box indicates the catalytic core domains. Right: Three-dimensional annotation of CRISPR-Scan score relative to the x-ray crystal structural model of human DOT1L (PDB ID: 4ER3), MOF (PDB ID: 6CT2), and LSD1 (PDB ID: 6W4K). The CRISPR hypersensitive surface pockets amendable to small molecular binding (pink dotted areas) were highlighted. EPZ004777, WM-1119, and CC-90011 are cocrystallized inhibitors of DOT1L, MOF, and LSD1, respectively.

References

    1. Dohner H., Weisdorf D. J., Bloomfield C. D., Acute myeloid leukemia. N. Engl. J. Med. 373, 1136–1152 (2015). - PubMed
    1. Shallis R. M., Wang R., Davidoff A., Ma X., Zeidan A. M., Epidemiology of acute myeloid leukemia: Recent progress and enduring challenges. Blood Rev. 36, 70–87 (2019). - PubMed
    1. Gu Z., Churchman M. L., Roberts K. G., Moore I., Zhou X., Nakitandwe J., Hagiwara K., Pelletier S., Gingras S., Berns H., Payne-Turner D., Hill A., Iacobucci I., Shi L., Pounds S., Cheng C., Pei D., Qu C., Newman S., Devidas M., Dai Y., Reshmi S. C., Gastier-Foster J., Raetz E. A., Borowitz M. J., Wood B. L., Carroll W. L., Zweidler-McKay P. A., Rabin K. R., Mattano L. A., Maloney K. W., Rambaldi A., Spinelli O., Radich J. P., Minden M. D., Rowe J. M., Luger S., Litzow M. R., Tallman M. S., Racevskis J., Zhang Y., Bhatia R., Kohlschmidt J., Mrozek K., Bloomfield C. D., Stock W., Kornblau S., Kantarjian H. M., Konopleva M., Evans W. E., Jeha S., Pui C. H., Yang J., Paietta E., Downing J. R., Relling M. V., Zhang J., Loh M. L., Hunger S. P., Mullighan C. G., PAX5-driven subtypes of B-progenitor acute lymphoblastic leukemia. Nat. Genet. 51, 296–307 (2019). - PMC - PubMed
    1. Chan A. K. N., Chen C. W., Rewiring the epigenetic networks in MLL-rearranged leukemias: Epigenetic dysregulation and pharmacological interventions. Front. Cell Dev. Biol. 7, 81 (2019). - PMC - PubMed
    1. Chen C. W., Koche R. P., Sinha A. U., Deshpande A. J., Zhu N., Eng R., Doench J. G., Xu H., Chu S. H., Qi J., Wang X., Delaney C., Bernt K. M., Root D. E., Hahn W. C., Bradner J. E., Armstrong S. A., DOT1L inhibits SIRT1-mediated epigenetic silencing to maintain leukemic gene expression in MLL-rearranged leukemia. Nat. Med. 21, 335–343 (2015). - PMC - PubMed

Publication types

Substances