. 2024 Feb 23;9(92):eadf8776.
doi: 10.1126/sciimmunol.adf8776. Epub 2024 Feb 23.

The gene regulatory basis of bystander activation in CD8+ T cells

Affiliations

The gene regulatory basis of bystander activation in CD8+ T cells

Neva B Watson et al. Sci Immunol. .

Abstract

CD8+ T cells are classically recognized as adaptive lymphocytes based on their ability to recognize specific foreign antigens and mount memory responses. However, recent studies indicate that some antigen-inexperienced CD8+ T cells can respond to innate cytokines alone in the absence of cognate T cell receptor stimulation, a phenomenon referred to as bystander activation. Here, we demonstrate that neonatal CD8+ T cells undergo a robust and diverse program of bystander activation, which corresponds to enhanced innate-like protection against unrelated pathogens. Using a multi-omics approach, we found that the ability of neonatal CD8+ T cells to respond to innate cytokines derives from their capacity to undergo rapid chromatin remodeling, resulting in the usage of a distinct set of enhancers and transcription factors typically found in innate-like T cells. We observed that the switch between innate and adaptive functions in the CD8+ T cell compartment is mediated by changes in the abundance of distinct subsets of cells. The innate CD8+ T cell subset that predominates in early life was also present in adult mice and humans. Our findings provide support for the layered immune hypothesis and indicate that the CD8+ T cell compartment is more functionally diverse than previously thought.


Conflict of interest statement

Competing interests: The authors declare that they have no competing interests.

Figures

Fig. 1.
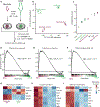
Fig. 1.. Neonatal CD8+ T cells have a distinct program of bystander activation.
(A) Adult or neonate CD8+ T cells were stimulated overnight with IL-2 ± IL-12/18 and gene expression determined by RNA-seq. (B) PCA of samples described in (A); n = 2 or 3 mice. (C) Median innateness score (negative = high adaptiveness, positive = high innateness), including CD4+ T, NKT, and γδ T cells from ImmGen dataset (GSE109125). Error bars represent SD across replicates. (D to F) GSEA running enrichment score plots for three selected Hallmark pathways significantly up-regulated in neonatal cells upon IL-12/18 stimulation compared with that in adults [gene rank expressed as mean log2(stim/control)]. TNFα, tumor necrosis factor−α; NES, normalized enrichment score. CFU, colony-forming units. (G to I) Heatmap visualization of row-scaled gene expression of noteworthy phenotypic (G), innate (H), and effector (I) markers in adult and neonatal cells under IL-2 + IL-12/18 treatment. For each heatmap, the three left and two right columns correspond to adult and neonate replicates, respectively.
Fig. 2.
Fig. 2.. Neonatal CD8+ T cells provide enhanced innate protection against unrelated pathogens.
(A) Neonate or adult CD8+ T cells were stimulated overnight with IL-2 ± IL-12/18, and cytokine expression was analyzed by flow cytometry. (B) Percentages of live CD8+ T cells expressing different cytokines; representative of four independent experiments. Two-way ANOVAs were performed with Šidák’s multiple comparison test. (C) TCRα−/− recipients received gBT-I CD8+ T cells and were inoculated with irrelevant pathogens (i.e., non-gB expressing) the following day. (D to F) Pathogen loads shown for indicated tissues and time points after infection with L. monocytogenes (3 dpi, D), N. brasiliensis (10 dpi, E), and influenza virus pathogen load and weight loss (7 dpi, F). To determine statistical significance, unpaired t tests and two-way repeated-measures ANOVA followed by Šidák’s multiple comparison test between neonate and adult at each time point were performed for pathogen burden and weigh loss measurements, respectively. Two pooled experiments shown for path burden experiments and one representative experiment shown for influenza virus (performed in duplicate); n = 4 to 9. For statistical comparisons, *P < 0.05, **P < 0.01, ***P < 0.001, and ****P < 0.0001.
Fig. 3.
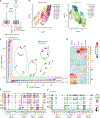
Fig. 3.. CD8+ T cells are composed of multiple subsets with distinct innate properties.
(A) Neonate (cell n = 3464) and adult (cell n = 4473) CD8+ T cells were stimulated overnight with IL-2 ± IL-12/18, and live CD8+ T cells were sorted for scRNA-seq (n = 1; for neonates, three or four mice were pooled). (B) UMAP visualization of scRNA-seq data from neonate and adult samples. Subset identities overlaid and differentially colored with the subset size conveyed as a percentage of the total population in parentheses. (C) PCA plot of pseudo-bulk gene expression profiles of subsets from (B); subsets with similar gene expression profiles were assigned a group number (I to IV). GSEA gene rank plots (inset) depict the enrichment of virtual memory (red) and true naïve (blue) gene sets among genes with positive and negative PC1 loadings, respectively (x axis) and of the fetal-liver (black) gene set in genes with positive PC2 loadings (y axis). The NES and adjusted P values are indicated. (D) Column-scaled gene set signature scores derived from pseudo-bulk expression profiles of subsets. Subsets are ordered by group corresponding to (C). (E) Bubble plots of selected effector molecules, phenotypic markers, cytokine receptors, and signaling molecules by subset within neonatal (left) or adult (right) cells. Dot shading indicates the mean normalized expression (z-score), and dot size represents percent of cells expressing the genes. Subsets are ordered by group corresponding to (C).
Fig. 4.
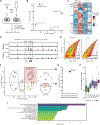
Fig. 4.. Neonatal CD8+ T cells undergo chromatin remodeling in response to inflammatory signals.
(A) Neonate or adult CD8+ T cells were stimulated overnight with IL-2 ± IL-12/18 and analyzed by ATAC-seq. (B) PCA of ATAC-seq profiles (n = 3 mice per group). (C) Heatmap visualization of ATAC-seq peak intensities for indicated genes. Intensities determined by row-wise z-scores of reads per million. All displayed peaks are differentially expressed between adults and neonates either in control samples or after bystander stimulation. (D) Genome browser view showing chromatin accessibility for de novo (solid box) and poised (dashed box) enhancers at the Ifng locus. (E) Scatter plot of chromatin accessibility at ATAC-seq peaks for adult (left) and neonate (right) CD8+ T cells, colored by two-dimensional density. Dashed horizontal and vertical lines represent the accessibility cutoffs chosen to identify de novo (solid box) and poised (dashed trapezoid) enhancers (see Materials and Methods). (F and G) Genes with positive PC1 and PC2 loadings (1242 genes) from scRNA-seq PCA were extracted to compare with genes putatively regulated by poised enhancers only (1842 genes), both poised and de novo enhancers (438 genes, highlighted) and de novo enhancers only (986 genes). Significance of enrichment reported as the −log10(adjusted P value). (H) Distributions of aggregated levels (see Materials and Methods) of genes putatively regulated by both de novo and poised enhancers across replicates in various human immune cells (obtained from GSE124731). Samples ordered (x axis) by increasing innateness potential. The aggregation was performed by addition of normalized expression (z-score) levels of selected genes for each sample. (I) Enrichment of genes putatively regulated by both poised and de novo enhancers within KEGG and Reactome curated gene sets. MAPK, mitogen-activated protein kinase; PD-L1, programmed death-ligand 1.
Fig. 5.
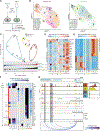
Fig. 5.. Neonatal CD8+ T cell subsets use a distinct set of TFs during bystander activation.
(A) Neonate (cell n = 6050) and adult (cell n = 3351) CD8+ T cells were stimulated overnight with IL-2 ± IL-12/18, and live CD8+ T cells were sorted for scATAC-seq (n = 1; for neonates, three or four mice were pooled). (B) UMAP visualization of scATAC-seq data from neonate (left) and adult (right) cells after IL-12/18 stimulation with subset identities overlaid using labels and different colors; the proportion of the total sample is shown for each subset in parentheses. (C) PCA plot of pseudo-bulk gene accessibility profiles of subsets from (B); subsets with similar gene accessibility profiles are assigned a group number (i to iv). Above the x axis, GSEA gene rank plots depict the enrichment of virtual memory (red), true naïve (blue), and fetal-liver (black) gene sets among genes with positive, negative, and positive PC1 loadings, respectively. NES and adjusted P values are indicated. (D) Row-scaled gene set signature scores and gene activity scores of noteworthy effector molecules and phenotypic markers derived from pseudo-bulk gene accessibility profiles of subsets. Subsets are ordered by the groups corresponding to (C). (E) Column-scaled accessibility at 10,808 marker peaks (columns) across all subsets. (F) TF binding motif enrichment within the marker peaks of each subset; heatmap color indicates the enrichment P value (−log10). TF motif families are indicated by colored bars at the bottom. The heatmap rows correspond to scATAC-seq subsets and are ordered by the groups corresponding to (C). (G) Example data showing a genome browser view depicting aggregated and single-cell chromatin accessibility, putative TF binding sites, peak-to-gene links, and integrated scRNA-seq expression at the Csf2 locus.
Fig. 6.
Fig. 6.. The AP-1/Bach2 axis regulates innateness of CD8+T cells.
(A) Depiction of hypothesized Bach2 and AP-1 interplay during IL-12/18 stimulation of neonatal and adult CD8+ T cells. (B) Scatter plots showing changes in flanking chromatin accessibility (x axis) and in footprinting depth (y axis) at predicted binding sites of different TFs between neonate and adult CD8+ T cells after IL-12/18 stimulation. Dots represent TFs, and dot sizes indicate chi-square q values representing significance of change in either flanking accessibility or footprinting depth. TFs with significant changes are labeled, and the TFs without any significant changes are colored in gray. (C) Heatmap visualization of row-scaled gene expression of Bach, Jun, and Fos TF members with significant change between neonates and adult. (D) Scatter plot correlating the level of expression and binding motif accessibility of TFs across all single cells (x axis) while depicting magnitude of variability in the accessibility of each TF’s cognate binding motif across all single cells (y axis). (E) GSEA showing that genes up-regulated in Bach2−/− CD8+ T cells are also up-regulated in neonatal cells after IL-12/18 stimulation. (F) Distributions of normalized expression (z-scores) of Bach2 across replicates in various human immune cells (GSE124731) (x axis) arranged in increasing order of their innateness potential. (G) Bystander response compared between adult WT and Bach2fl/fl mice CD8+ T cells. Tat-cre was used to excise Bach2 in vitro. Statistical significance determined by ordinary two-way ANOVA followed by Šidák’s multiple comparison test. (H) Percentages of live CD8+ T cells expressing different cytokines after IL-12/18 stimulation in neonatal cells treated with increasing concentrations of the AP-1 inhibitor SR 11302. Significant differences compared to control (0 μM) were determined by one-way ANOVA followed by Dunnett’s multiple comparisons test. For statistical comparisons, *P < 0.05, **P < 0.01, ***P < 0.001, and ****P < 0.0001.
Fig. 7.
Fig. 7.. Innateness profiles of different-aged CD8+ T cells are conserved in humans.
(A) Human CD8+ T cells were isolated from adult PBMCs, neonate, or fetal CBMCs and stimulated overnight with IL-2 ± IL-12/18. (B) UMAP comprising scRNA-seq data from the entire cohort (see fig. S7A) divided into different age groups after stimulation [adult, n = 4 (2 males and 2 females); neonate, n = 3 (1 male and 2 females); and fetal, n = 4 (2 males and 2 females), cells from each cohort pooled]. Each UMAP is colored by the single-cell levels of IFNG. (C) UMAP representation of adult (left), neonatal (middle), and fetal (right) samples after IL-12/18 stimulation with cluster identifies overlaid using labels and different colors. (D) Expression of IFNG in each cluster of cells from (C). (E) PCA plot of pseudo-bulk gene expression profiles of subsets from (C); subsets with similar gene expression profiles are assigned a group number (I to IV). GSEA gene rank plots (inset) depict the enrichment of innateness (red) and adaptiveness (blue) gene sets among genes with positive and negative PC1 loadings, respectively, along the x axis. NES and adjusted P values are indicated. (F and G) PCA plot from E displaying corresponding z-score expression of BACH2 (F) and JUND (G) for each Seurat cluster.

References

    1. Zhang N, Bevan MJ, CD8+ T cells: Foot soldiers of the immune system. Immunity 35, 161–168 (2011). - PMC - PubMed
    1. Williams MA, Bevan MJ, Effector and memory CTL differentiation. Annu. Rev. Immunol. 25, 171–192 (2007). - PubMed
    1. Kaech SM, Wherry EJ, Ahmed R, Effector and memory T-cell differentiation: Implications for vaccine development. Nat. Rev. Immunol. 2, 251–262 (2002). - PubMed
    1. White JT, Cross EW, Burchill MA, Danhorn T, McCarter MD, Rosen HR, O’Connor B, Kedl RM, Virtual memory T cells develop and mediate bystander protective immunity in an IL-15-dependent manner. Nat. Commun. 7, 11291 (2016). - PMC - PubMed
    1. Jameson SC, Lee YJ, Hogquist KA, Innate memory T cells. Adv. Immunol. 126, 173–213 (2015). - PMC - PubMed

Publication types