. 2024 Feb 23;20(2):e1011896.
doi: 10.1371/journal.pcbi.1011896. eCollection 2024 Feb.

Shared input and recurrency in neural networks for metabolically efficient information transmission

Affiliations

Shared input and recurrency in neural networks for metabolically efficient information transmission

Tomas Barta et al. PLoS Comput Biol. .

Abstract

Shared input to a population of neurons induces noise correlations, which can decrease the information carried by a population activity. Inhibitory feedback in recurrent neural networks can reduce the noise correlations and thus increase the information carried by the population activity. However, the activity of inhibitory neurons is costly. This inhibitory feedback decreases the gain of the population. Thus, depolarization of its neurons requires stronger excitatory synaptic input, which is associated with higher ATP consumption. Given that the goal of neural populations is to transmit as much information as possible at minimal metabolic costs, it is unclear whether the increased information transmission reliability provided by inhibitory feedback compensates for the additional costs. We analyze this problem in a network of leaky integrate-and-fire neurons receiving correlated input. By maximizing mutual information with metabolic cost constraints, we show that there is an optimal strength of recurrent connections in the network, which maximizes the value of mutual information-per-cost. For higher values of input correlation, the mutual information-per-cost is higher for recurrent networks with inhibitory feedback compared to feedforward networks without any inhibitory neurons. Our results, therefore, show that the optimal synaptic strength of a recurrent network can be inferred from metabolically efficient coding arguments and that decorrelation of the input by inhibitory feedback compensates for the associated increased metabolic costs.


Conflict of interest statement

The authors have declared that no competing interests exist.

Figures

Fig 1
Fig 1. Inhibitory feedback decreases noise correlations.
A: Schematic illustration of the simulated neural network. Poisson neurons in the external population make random connections to neurons in the excitatory and inhibitory subpopulations. The connection probability Pext ∈ [0.01, 1] is varied to achieve different levels of shared external input to the neurons. The neurons in the inhibitory (inh.) and excitatory (exc.) subpopulations make recurrent connections (exc. to exc., exc. to inh., inh. to inh., inh. to exc.) with probability Prec = 0.2. The strength of those connections is parametrized by arec. B: Mean pairwise correlations between any two neurons in the exc. and inh. subpopulations plotted against the mean output of the network for different values of Pext in a feedforward network (arec = 0 nS). Pairwise correlations are calculated from the number of spikes each neuron fires in a time window ΔT = 1 s across many trials of the simulation. The plot is vertically separated into two parts to also illustrate the smaller differences at lower values of Pext. C: Mean pairwise correlations as in B, for different values of α (ratio of inhibitory-to-excitatory synaptic strength), arec = 0.01 nS. The black line represents the pairwise correlations in a feedforward network without any recurrent connections (arec = 0). D: Total current from recurrent synapses for different values of α, as in C. E-F: Same as in C-D, but with fixed α = 20 and different values of arec.
Fig 2
Fig 2. Fano factor of single neurons and of populations.
A-C: Mean Fano factor of individual neurons for different values of Pext: 0.01 (A), 0.2 (B), 1 (C). The strength of the recurrent synapses (arec) is color-coded. The mean Fano factor increases with the strength of the recurrent synapses. D-F: Same as in A-C but for the Fano factor of the population activity. The points represent the population Fano factor obtained from the simulation, and the lines are a weighted 7th-degree polynomial, used only as a visual aid. For Pext = 0.01, the increase in Fano factor of individual neurons (A) can have a stronger effect on the population Fano factor than decreasing the pairwise correlations, resulting in an increase of the population Fano factor with high values of arec (D). For higher values of Pext, the pairwise correlations greatly increase the population Fano factor, which then decreases with increasing arec.
Fig 3
Fig 3. Metabolic cost of the network activity.
A-C: Cost at resting state (λext = 0). A: Cost of the excitatory synaptic currents from the background input (Eq 35) and excitatory action potentials evoked by the background input. B: Cost of the action potentials (both excitatory and inhibitory) evoked by the background input. C: Total resting cost obtained by summing A and B. D: The total cost of the network activity is plotted against the output of the network (the total post-synaptic firing rate). Filled areas represent individual contributions of each cost component: cost of action potentials from the external population, cost of the excitatory synaptic currents, and cost of the post-synaptic (evoked) action potentials. As Pext increases, the contribution of external action potentials to the overall cost decreases. With increasing arec, the contribution of excitatory synaptic currents increases. E: The cost of increasing the mean input by one action potential (wAP, Eq 19) is significantly lower for higher Pext. However, although the difference between Pext = 0.01 and Pext = 0.2 is approximately 10-fold, the difference between Pext = 0.2 and Pext = 1 is only approximately 2-fold, as the cost of the external population starts to contribute less to the overall cost.
Fig 4
Fig 4. Shared input decreases the gain and increases the individual Fano factor.
A-C: The input intensity λext needed to evoke a given firing rate (x-axis) with different connection probabilities Pext relative to the input intensity for Pext = 0.01. A: arec = 0 nS, B: arec = 0.2 nS, C: arec = 1 nS. For higher Pext, higher values of λext are needed to achieve the same post-synaptic firing rates as with lower values of Pext. This effect becomes more pronounced in stronger recurrent synapses (E-F). D-F: Gain of the network (Eq 20). A higher Pext leads to a lower gain of the population activity. G-I: Higher values of Pext also increase the Fano factor of individual neurons.
Fig 5
Fig 5. Information transmission with cost constraints.
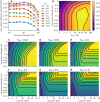
A: Information-metabolic efficiency E (Eq 10) for different values of recurrence strength arec. Pext is color-coded. B: Contour plot of the information-metabolic efficiency. Contours are at 0.75, 1.0, 1.25, 1.5, 1.75, 2.0, and 2.25 bits/s. C-H: Contour plots showing the capacity-cost function C(W) (Eq 9) with dependence on the recurrence strength arec for different values of Pext. The contours show the maximal capacities constraint at different values of W (see Table 1 for the costs and capacity values at the contours). The heatmaps in B-H were calculated using piece-wise cubic 2D interpolation (SciPy interpolator CloughTocher2DInterpolator [34]) from the grid calculated with Pext values 0.01, 0.02, 0.03, 0.05, 0.1, 0.2, 0.5, 0.8, 1 and arec values 0, 0.01, 0.02, 0.03, 0.05, 0.1, 0.2, 0.3, 0.5, and 1 nS.
Fig 6
Fig 6. Information-metabolic efficiency with multi-dimensional output.
A: Information-metabolic efficiency E (Eq 10) for different values of recurrence strength arec. Pext is color-coded. B: Contour plot of the information-metabolic efficiency. Contours are at 1, 1.25, 1.5, 1.75, 2, 2.25, 2.5, and 2.75 bits/s.

References

    1. Barlow HB. Possible Principles Underlying the Transformations of Sensory Messages. In: Sensory Communication. The MIT Press; 1961. p. 217–234.
    1. Attwell D, Laughlin SB. An Energy Budget for Signaling in the Grey Matter of the Brain. J Cereb Blood Flow Metab. 2001;21(10):1133–1145. doi: 10.1097/00004647-200110000-00001 - DOI - PubMed
    1. Harris JJ, Jolivet R, Attwell D. Synaptic energy use and supply. Neuron. 2012;75(5):762–777. doi: 10.1016/j.neuron.2012.08.019 - DOI - PubMed
    1. Levy WB, Baxter RA. Energy Efficient Neural Codes. Neural Comput. 1996;8(3):531–543. doi: 10.1162/neco.1996.8.3.531 - DOI - PubMed
    1. Balasubramanian V, Kimber D, Berry MJ II. Metabolically Efficient Information Processing. Neural Comput. 2001;13(4):799–815. doi: 10.1162/089976601300014358 - DOI - PubMed

MeSH terms