Review
. 2024 Mar 14;67(5):3205-3231.
doi: 10.1021/acs.jmedchem.3c01543. Epub 2024 Feb 23.

Antiviral Protein-Protein Interaction Inhibitors

Affiliations
Review

Antiviral Protein-Protein Interaction Inhibitors

Violeta Marković et al. J Med Chem. .

Abstract

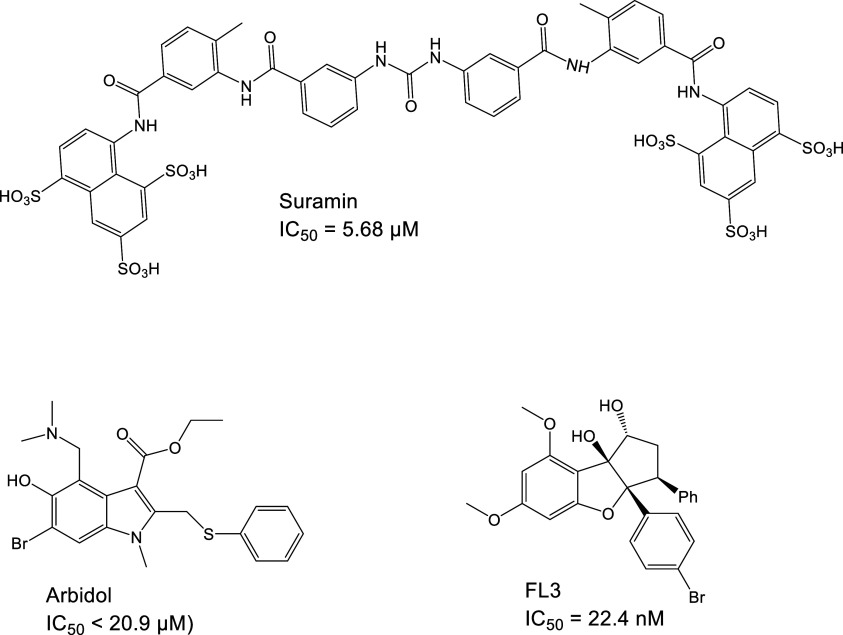
Continually repeating outbreaks of pathogenic viruses necessitate the construction of effective antiviral strategies. Therefore, the development of new specific antiviral drugs in a well-established and efficient manner is crucial. Taking into account the strong ability of viruses to change, therapies with diversified molecular targets must be sought. In addition to the widely explored viral enzyme inhibitor approach, inhibition of protein-protein interactions is a very valuable strategy. In this Perspective, protein-protein interaction inhibitors targeting HIV, SARS-CoV-2, HCV, Ebola, Dengue, and Chikungunya viruses are reviewed and discussed. Antibodies, peptides/peptidomimetics, and small molecules constitute three classes of compounds that have been explored, and each of them has some advantages and disadvantages for drug development.


Conflict of interest statement

The authors declare no competing financial interest.

Figures

Figure 1
Figure 1
Crystal structure of the ibalizumab-CD4 complex (PDB id: 3O2D) (A) and a fragment of CD4 with selected interacting residues of the antibody (B). CD4 is shown as a cyan ribbon or as a solvent-accessible surface colored by interpolated charge (blue–positive, gray–neutral, red–negative). The antibody is shown as a green or orange ribbon for the light and heavy chains, respectively. Interacting residues are shown in stick representation, with carbon atoms colored the same as the parent chain. Intermolecular interactions are shown as dashed lines: green–hydrogen bonds, orange–charge-assisted hydrogen bonds, pink–hydrophobic interactions, and white–hydrogen bond donor/π interactions.
Figure 2
Figure 2
Crystal structure of the VRC01 antibody-gp120 complex (PDB id: 5CD5) (A) and a fragment of gp120 with selected interacting residues of the antibody (B). gp120 is shown as a cyan ribbon or as a solvent-accessible surface colored by interpolated charge (blue–positive, gray–neutral, red–negative). The antibody is shown as violet or dark blue ribbons for the light and heavy chains, respectively. Interacting residues are shown in stick representation with carbon atoms colored the same as the parent chain. Intermolecular interactions are shown as dashed lines in the same color as in Figure 1.
Figure 3
Figure 3
Crystal structure of the SFT-gp41 complex: top (A) and side view (B) (PDB id: 3VIE). gp41 is shown as a blue ribbon or as a solvent-accessible surface colored by interpolated charge (blue–positive, gray–neutral, red–negative). The SFT peptide is shown as a green ribbon or in stick representation colored according to atom types, and noninteracting side chains are hidden for clarity. Intermolecular interactions are shown as dashed lines in the same color as in Figure 1.
Figure 4
Figure 4
Crystal structure of the CP32 peptide-gp41 complex (A) and enlargement of the hook region (B) (PDB id: 3VTP). Gp41 and CP32 are shown as blue and red ribbons, respectively. The hook region is shown in stick representation colored according to atom types.
Figure 5
Figure 5
Crystal structure of the HP23L-gp41 complex (PDB id 5YB3) (A). Intermolecular interactions stabilizing the complex (B) and the structure of the L-T hook (C). gp41 is shown as a blue ribbon or as a solvent-accessible surface colored by interpolated charge (blue–positive, gray–neutral, red–negative). The HP23L peptide is shown as an orange ribbon or in stick representation colored according to atom types, and noninteracting side chains are hidden for clarity. Intermolecular interactions are shown as dashed lines in the same color as in Figure 1.
Figure 6
Figure 6
Structures of small molecule HIV entry inhibitors.
Figure 7
Figure 7
Mode of binding of temsavir to gp120: the temsavir-gp120 complex (A) and closeup of the binding cavity of gp120 with interactions between temsavir and the target (PDB id 5U7O). gp120 is shown as a cyan ribbon with β20-β12 and CD4-binding loops colored red and yellow, respectively. Interacting residues (B) are shown in stick representation colored according to atom type and carbon atom color that matches the parent chain color. Temsavir is shown as space-filling balls. Intermolecular interactions are shown as dashed lines in the same color as in Figure 1.
Figure 8
Figure 8
NBD-14010/CD120 complex, CD120 protein is shown as a cyan ribbon, and the inhibitor is shown as space-filling balls colored according to atom type.
Figure 9
Figure 9
Crystal structure of maraviroc bound to CCR5 (PDB id: 4MBS) (A) and closeup of the interaction site of the drug (B). CCR5 is shown as a blue ribbon, and maraviroc is shown as space-filling balls colored according to the atom type. Interacting residues (B) are shown in stick representation colored according to the atom type, and the carbon atom color matches the parent chain color. Interactions are shown as dashed lines with the same color scheme as in Figure 1.
Figure 10
Figure 10
Crystal structure of the S protein (PDB id 6VXX) (A) and its receptor-binding domain (RBD) (B). S protein is shown in ribbon representation colored in blue and green for S1 and S2 chains, respectively. (C) The interactions between RBD and the S-protein have been shown with S1 represented as sticks (PDB ID: 6VW1). RBD is presented as a solvent-accessible surface colored by interpolated charge: red–negative, blue–positive, gray–neutral.
Figure 11
Figure 11
Crystal structure of the P2B-2F6 antibody - RBD of the S protein complex (PDB id: 8DCC): the whole structure (A) and closeup showing intermolecular interactions (B). The antibody shown in the ribbon representation is colored orange and yellow for light and heavy chains, respectively. The RBD is presented as a solvent-accessible surface colored by interpolated charge: red–negative, blue–positive, gray–neutral (A) or green ribbon (B). Interacting residues are shown as sticks colored by atom type, and the colors of the carbon atoms match that of the ribbon of the same chain. Interactions are shown as dashed lines with the same color scheme shown in Figure 1.
Figure 12
Figure 12
Crystal structure of bamlanivimab-RBD of the S protein complex (PDB id: 7KMG): the whole structure (A) and closeup showing intermolecular interactions (B). The antibody shown in ribbon representation is colored in orange and yellow for light and heavy chains, respectively. The RBD is presented as a solvent-accessible surface colored by interpolated charge: red–negative, blue–positive, gray–neutral (A) or as a green ribbon (B). Interacting residues are shown as sticks colored by atom type, and the color of the carbon atoms matches that of the ribbon of the same chain. Interactions are shown as dashed lines with the same color scheme shown in Figure 1.
Figure 13
Figure 13
Cryo-EM structure of the small protein LCB3 bound to the RBD of the S protein (PDB id: 7JZM). LBC3 protein is shown as a brown ribbon with interacting residues represented as sticks colored according to the atom type. The RBD of the S protein is shown as a solvent-accessible surface that is colored according to the interpolated charge (red–negative, blue–positive, gray–neutral). Interactions are shown as dashed lines with the color scheme shown in Figure 1.
Figure 14
Figure 14
Modeled complex of peptide-RBD of the S protein. The inhibitory peptide is shown in stick representation colored according to atom type, and β-amino acid carbon atoms are colored in green. The RBD of the S protein is shown as a solvent-accessible surface that is colored according to interpolated charge (red–negative, blue–positive, gray–neutral). Interactions are shown as dashed lines with the same color scheme as shown in Figure 1.
Figure 15
Figure 15
Structures of small molecules identified as S protein/ACE2 interaction inhibitors.
Figure 16
Figure 16
(A) The crystal structure of the truncated glycoprotein E2 shown in green in ribbon representation with fragments containing the predicted binding sites in yellow and magenta, as well as a conserved region in cyan (PDB id: 6MEH). (B) Amino acid residues crucial for the E2-CD81 interaction, presented as sticks colored according to atom type. (C) The interaction between tamarin CD81 (pink) and E2 (green) with the interacting residues carbon atoms’ colors matching the ribbon color of the same chain (PDB id: 7MWX). (D) The full structure of human tetraspanin CD81 in the closed conformation, including the transmembrane helices with a cholesterol binding pocket. The large extracellular loop is highlighted in pink (PDB id: 5TCX).
Figure 17
Figure 17
(A) The epitopes of the E2-targeting antibodies. The proteins are shown in cartoon representation with the epitope amino acid side chains displayed as sticks (PDB id: 6MEI). (B) The intermolecular interactions between AP33 and its epitope are shown in two ways: on the left, the epitope is represented as a blue ribbon with the interacting amino acid residues as sticks. On the right, the antibody is the solvent accessible surface colored according to interpolated charge (red–negative, blue–positive, gray–neutral), with the interacting residues of E2 displayed as blue sticks. Interactions are shown as dashed lines with the same color scheme shown in Figure 1 (PDB id: 4GAG).
Figure 18
Figure 18
Small molecule inhibitors of HCV entry and available inhibition data.
Figure 19
Figure 19
Glycoprotein GP in the complex with the Niemann-Pick C1 receptor (A) (PDB id: 5F1B) and closeup showing intermolecular interactions (B). The glycoprotein GP in the complex with the IT0227 antibody (C), with a closeup of the interactions shown in (D) (PDB id: 6S8D). The proteins are shown in ribbon representation colored by chain with magenta for GP-2, navy for GP-1, cyan for NPC1, red for the light chain of IT0227, and green for the heavy chain of IT01227. Interacting residues are shown as sticks colored by atom type, and the color of the carbon atoms matches that of the ribbon of the same chain. Interactions are shown as dashed lines with the same color scheme shown in Figure 1.
Figure 20
Figure 20
Small molecule inhibitors of PPI related to the Ebola virus.
Figure 21
Figure 21
(A) The crystal structure of a DENV2 envelope glycoprotein homodimer (PDB id: 1OKE). One chain is shown in the ribbon representation with blue marking the DI, green – DII, and cyan – DIII. The other chain is shown as a solvent-accessible surface colored according to the interpolated charge (red–negative, blue–positive, gray–neutral). The binding sites of n-octyl-β-d-glucoside are indicated with an arrow (“β-OG”). (B) Interactions within the n-octyl-β-d-glucoside-binding pocket; the ligand and the amino acid residues are shown in stick representation, with colors corresponding to atom type. The protein’s carbon atom color corresponds to the location of the binding site (green - DII). Interactions are shown as dashed lines with the same color scheme shown in Figure 1. (C) The E protein–M protein complex. Both envelope protein chains are depicted in the solvent accessible surface representation, while the M protein is shown as a cyan ribbon (PDB id: 3J27).
Figure 22
Figure 22
(A) The 4E11 bNAb-DIII complex (DENV4) is shown in the ribbon representation, where 4E11 is colored magenta, while DIII is colored cyan. (B) A closeup showing the intermolecular interactions. DIII is shown as a solvent-accessible surface colored according to interpolated charge (red–negative, blue–positive, gray–neutral). The interacting residues are displayed as sticks colored by atom type, and the colors of the carbon atoms match that of the ribbon of the same chain. Interactions are shown as dashed lines with the same color scheme shown in Figure 1 (PDB ID: 3UYP).
Figure 23
Figure 23
Inhibitors of PPI involved in dengue infection.
Figure 24
Figure 24
(A) The E1E2 complex of CHIKV. The structure is represented as ribbons, with green indicating the E2 glycoprotein, blue indicating the E1 glycoprotein, and red indicating the fusion loop. The amino acid residues involved in the intramolecular interactions between E1 and E2 are shown as sticks. (B) The MXRA8 receptor (magenta ribbon) binds to the E1E2 complex. The transmembrane part of E1E2 is included (“TM”) (PDB id: 6JO8).
Figure 25
Figure 25
Small molecule inhibitors of PPI related to Chikungunya virus infection.

Similar articles

Cited by

References

    1. Ye S.; Lu C.; Qiu Y.; Zheng H.; Ge X.; Wu A.; Xia Z.; Jiang T.; Zhu H.; Peng Y. An Atlas of Human Viruses Provides New Insights into Diversity and Tissue Tropism of Human Viruses. Bioinformatics 2022, 38 (11), 3087–3093. 10.1093/bioinformatics/btac275. - DOI - PubMed
    1. Ye S.; Lu C.; Qiu Y.; Zheng H.; Ge X.; Wu A.; Xia Z.; Jiang T.; Zhu H.; Peng Y. An Atlas of Human Viruses Provides New Insights into Diversity and Tissue Tropism of Human Viruses. Bioinformatics 2022, 38 (11), 3087–3093. 10.1093/bioinformatics/btac275. - DOI - PubMed
    1. Müller B.; Kräusslich H.-G. Antiviral Strategies. Handb Exp Pharmacol 2009, 189 (189), 1–24. 10.1007/978-3-540-79086-0_1. - DOI - PMC - PubMed
    1. Xu S.; Ding D.; Zhang X.; Sun L.; Kang D.; Huang B.; Liu X.; Zhan P. Newly Emerging Strategies in Antiviral Drug Discovery: Dedicated to Prof. Dr. Erik De Clercq on Occasion of His 80th Anniversary. Molecules 2022, 27 (3), 850.10.3390/molecules27030850. - DOI - PMC - PubMed
    1. Tompa D. R.; Immanuel A.; Srikanth S.; Kadhirvel S. Trends and Strategies to Combat Viral Infections: A Review on FDA Approved Antiviral Drugs. Int. J. Biol. Macromol. 2021, 172, 524–541. 10.1016/j.ijbiomac.2021.01.076. - DOI - PMC - PubMed

Publication types