. 2024 Jun;13(15):e2302831.
doi: 10.1002/adhm.202302831. Epub 2024 Mar 5.

A 3D Bioprinted Human Neurovascular Unit Model of Glioblastoma Tumor Growth

Affiliations

A 3D Bioprinted Human Neurovascular Unit Model of Glioblastoma Tumor Growth

Yen-Ting Tung et al. Adv Healthc Mater. 2024 Jun.

Abstract

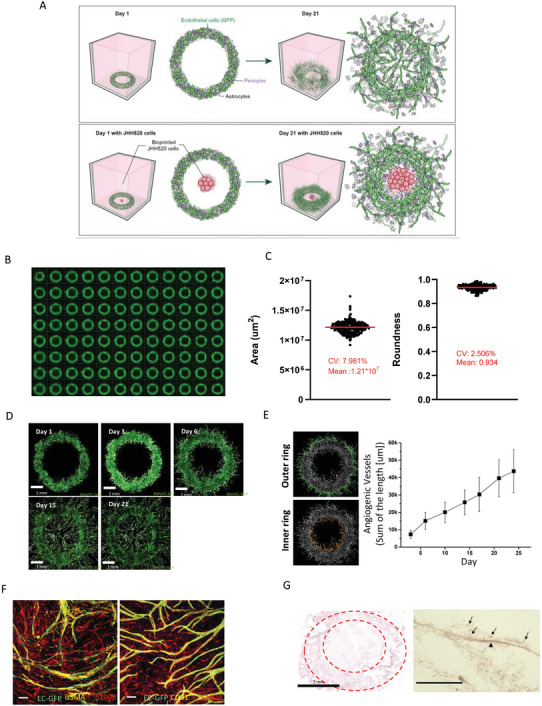
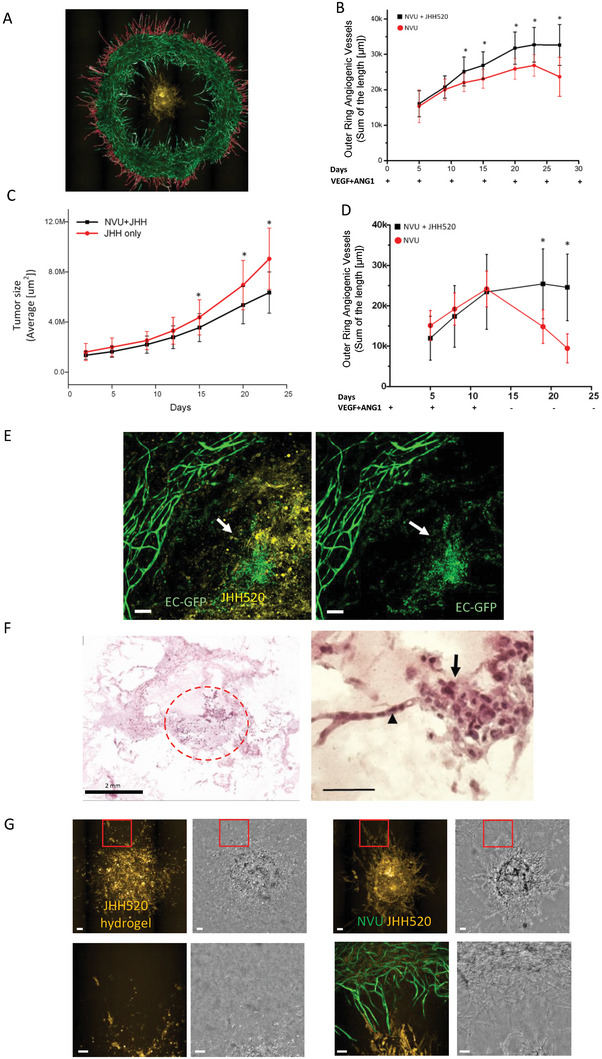
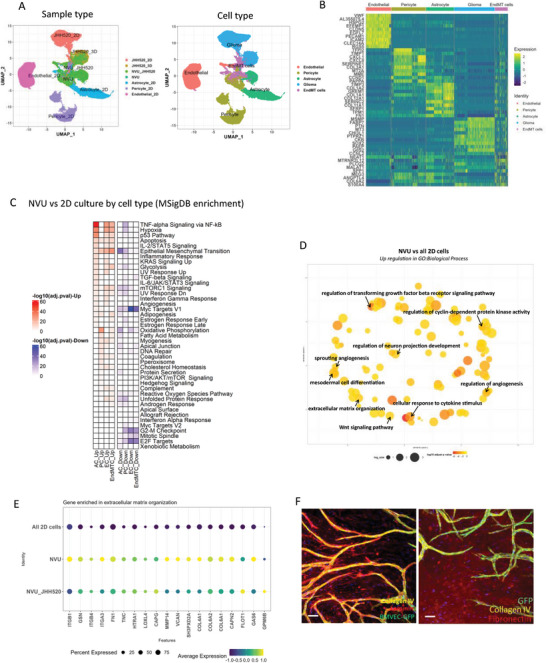
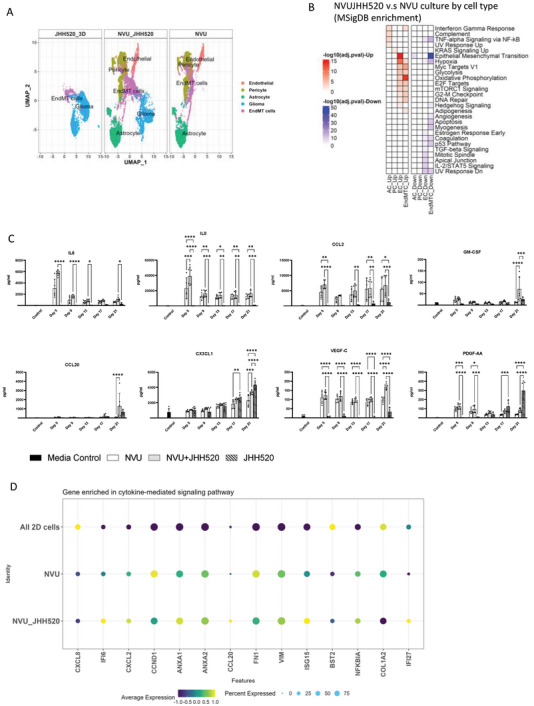
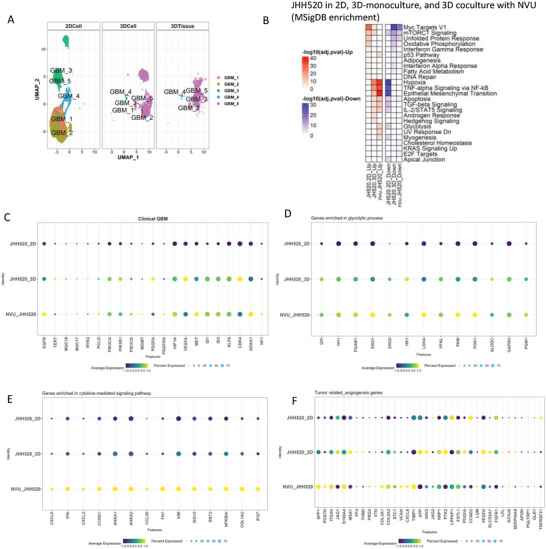
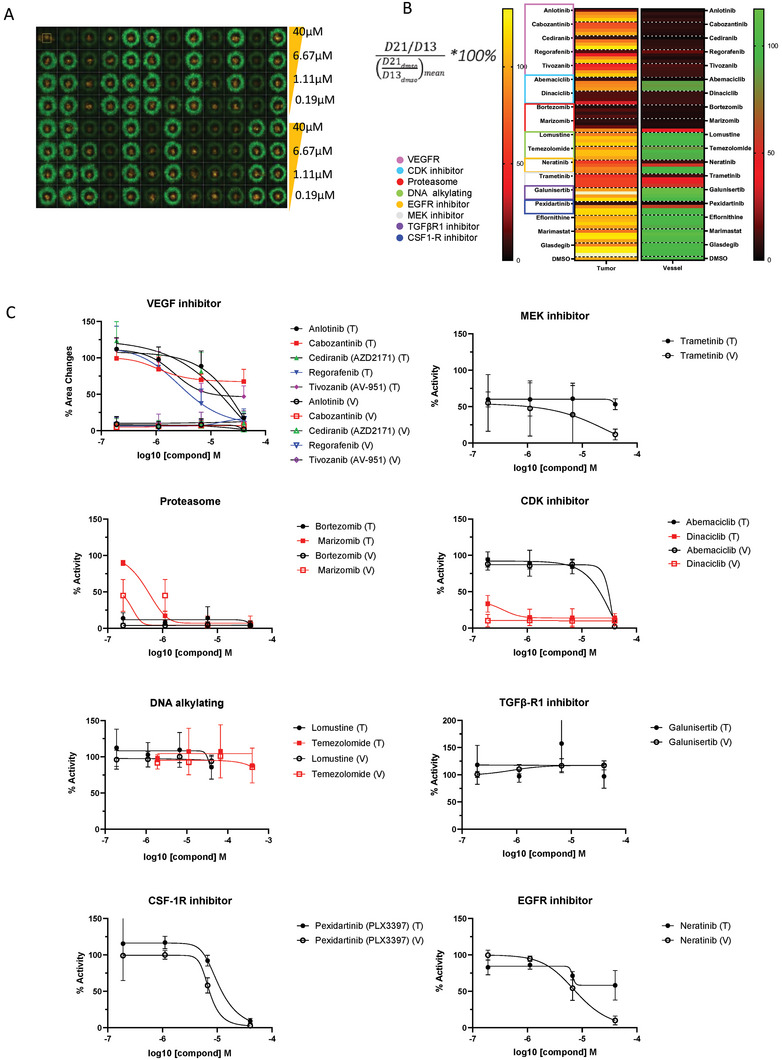
A 3D bioprinted neurovascular unit (NVU) model is developed to study glioblastoma (GBM) tumor growth in a brain-like microenvironment. The NVU model includes human primary astrocytes, pericytes and brain microvascular endothelial cells, and patient-derived glioblastoma cells (JHH-520) are used for this study. Fluorescence reporters are used with confocal high content imaging to quantitate real-time microvascular network formation and tumor growth. Extensive validation of the NVU-GBM model includes immunostaining for brain relevant cellular markers and extracellular matrix components; single cell RNA sequencing (scRNAseq) to establish physiologically relevant transcriptomics changes; and secretion of NVU and GBM-relevant cytokines. The scRNAseq reveals changes in gene expression and cytokines secretion associated with wound healing/angiogenesis, including the appearance of an endothelial mesenchymal transition cell population. The NVU-GBM model is used to test 18 chemotherapeutics and anti-cancer drugs to assess the pharmacological relevance of the model and robustness for high throughput screening.

Keywords: 3D Bioprinting; glioblastomas; high‐throughput screening; neurovascular unit; transcriptomics.


Conflict of interest statement

The authors declare no conflict of interest.

Figures

Figure 1
Figure 1
Bioprinting a Neurovascular Unit (NVU) model. A) Schematic cartoon describing the Biofabrication approach used to assemble an NVU and NVU‐glioblastoma model. B) Representative image of the bioprinted NVUs in a 96‐well plate. C) The mean and CV on area and roundness from 283 wells with bioprinted NVUs were calculated to assess the uniformity between NVUs. D) Time course images of vasculogenesis and angiogenesis formation using GFP expressing human brain endothelial cells (scale bar = 1 mm). E) Quantitation of angiogenesis at both outer‐ring (green) and inner‐ring area (orange) area across the culturing period from real time fluorescence microscopy images. F) Cell identity of the NVU by immunostaining and fluorescence microscopy: αSMA as a pericyte marker, s100β as an astrocyte marker, CD31 as an endothelial cell marker (scale bar = 100 µm). G) The H&E staining of NVU, the area surrounded by a dot line indicated the area of the printed structure. Astrocytes are indicated by arrows and the microvessel is labeled with an arrowhead (scale bar = 75 µm).
Figure 2
Figure 2
Glioblastoma model by co‐culture patient‐derived JHH520 glioma cells with NVU. A) Representative fluorescence microscopy image of an NVU (green) with JHH520 glioma cells (yellow), and a mask used to quantitate angiogenetic vessel at outer‐ring area. B) Plots comparing the increase of total angiogenic vessel length in the outer ring area between the NVU tumor model and NVU, with time. C) Plot comparing the growth of tumor area with and without co‐culture in NVU. D) Plot illustrating the influence of tumor secretory factors on the total length of angiogenetic vessel in the outer‐ring area. In these experiments, exogenous VEGF was removed at day 13. E) Fluorescence image illustrating the loss of vessel integrity around the tumor area. The left panel includes fluorescence from tumor cells in yellow. The arrow indicates endothelial cells from tumor‐disrupted vasculature (Scale bar = 100 µm). F) H&E staining of NVU‐JHH520 tumor model. Tumor cells are indicated by the circle (left panel);, and vascular mimicry tube‐like structures are indicated by the arrowhead (right panel) (scale bar = 75 µm). G) Fluorescence images showing details of the structure of the vasculature and tumor in close contact. The lower pictures are the zoom‐in images from the selected red square area of the upper pictures. The morphology of the bioprinted JHH520 with and without co‐culture of NVU (scale bar = 100 µm). Asterisks mean significant difference. At least 19 samples were used in Figure 2B–D.
Figure 3
Figure 3
sc RNAseq analysis and comparison of transcriptomic changes between cells in 2D monoculture and 3D NVU. A) UMAP of cell distribution based on sample types and cell types. B) Gene expression profile among each cell type. C) The MSigDB enrichment on the biomechanical process between 3D NVU and 2D cells. D) The upregulated GO: Biological process between 3D NVU and 2D cells. E) The activation of genes in ECM‐related signaling pathways in NVU. F) Immuno‐fluorescent staining of ECM proteins. Scale bar = 100 µm.
Figure 4
Figure 4
scRNAseq gene analysis and comparison of transcriptomic changes in cells of the NVU with JHH520 glioma cells. A) UMAP plots showing cell cluster distribution and gene expression for cells in the NVU, between NVU, NVUJHH520, and 3D monoculture of JHH520. B) The MSigDB enrichment on the biomechanical process of NVU between the comparison of NVU‐JHH520 co‐culture to NVU. C) The time‐dependent cytokine secretion data for NVU, NVU‐JHH520, and 3D monoculture of JHH520. D) Dotplot for genes enriched in cytokine‐mediated signaling pathway in all NVU cells cultured in 2D, NVU, and NVU‐JHH520 coculture.
Figure 5
Figure 5
scRNAseq gene analysis and comparison of transcriptomic changes in JHH520 glioma cells grown as 2D monocultures, JHH520 3D hydrogel monocultures (JHH520 3D) and JHH520 coculture with NVU (NVU‐JHH520). A) UMAP plots of GBM cell cluster distribution. B) MSigDB enrichment plot of biomechanical processes. Dotplots gene expression analysis for C) clinical GBM genes; D) glycolytic process genes E) genes related to cytokine‐mediated signaling pathways; and F) tumor‐related angiogenesis genes.
Figure 6
Figure 6
Screening of a focus collection of drugs with the NVU‐JHH520 glioblastoma model. A) The representative fluorescence microscopy image of a whole 96‐well microplate with NVU (green)‐JHH520 (yellow) model in each well, 21 days after bioprinting and after 1‐week of compound treatment. Each plate included 18 drugs (each in 4‐dose responses, rows A‐D and E‐H. Columns 1 and 12 include wells with no drug treatment and including 0.4% DMSO to mimic the amount of solvent in drug‐containing wells B) A heatmap showing %changes on vascular outer ring vessel length (from green signal) and tumor area (yellow signal) after compound treatment, as calculated by the formula shown. C) Dose‐response plots for both % changes in outer ring vessel length (V) and tumor area (T). Error bars are SD and n = 4.

References

    1. Friedrich J., Seidel C., Ebner R., Kunz‐Schughart L. A., Nat. Protoc. 2009, 4, 309. - PubMed
    1. Banerjee D., Singh Y. P., Datta P., Ozbolat V., O'Donnell A., Yeo M., Ozbolat I. T., Biomaterials 2022, 291, 121881. - PubMed
    1. Kim J., Koo B.‐K., Knoblich J. A., Nat. Rev. Mol. Cell Biol. 2020, 21, 571. - PMC - PubMed
    1. Chiaradia I., Lancaster M. A., Nat. Neurosci. 2020, 23, 1496. - PubMed
    1. Song L., Yuan X., Jones Z., Griffin K., Zhou Y., Ma T., Li Y., Sci. Rep. 2019, 9, 5977. - PMC - PubMed

Publication types