. 2024 Apr 18;143(16):1599-1615.
doi: 10.1182/blood.2023021570.

A CD38-directed, single-chain T-cell engager targets leukemia stem cells through IFN-γ-induced CD38 expression

Affiliations

A CD38-directed, single-chain T-cell engager targets leukemia stem cells through IFN-γ-induced CD38 expression

Mariam Murtadha et al. Blood. .

Abstract

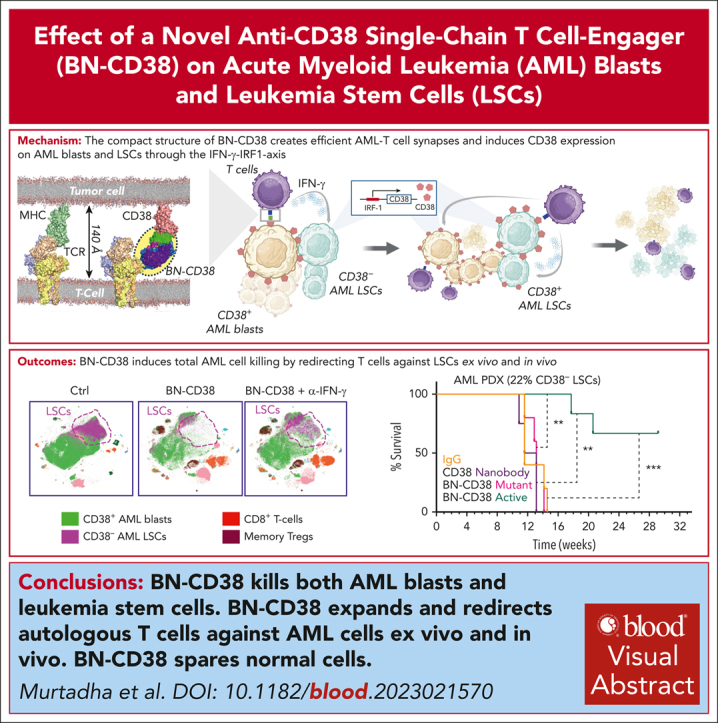
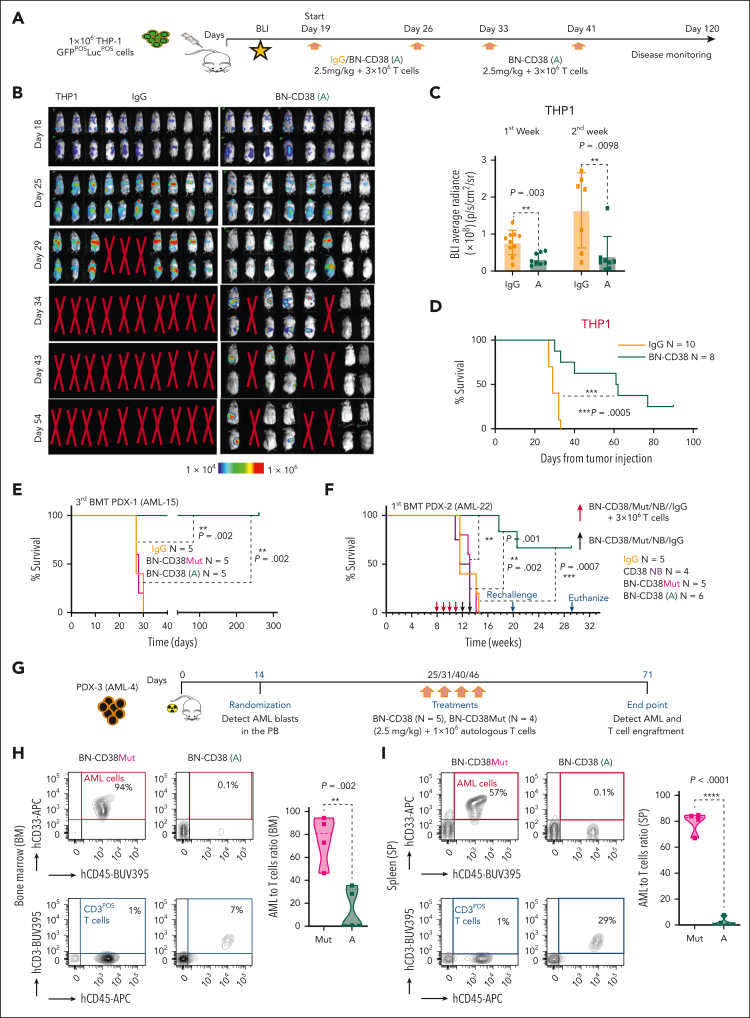
Treatment resistance of leukemia stem cells (LSCs) and suppression of the autologous immune system represent major challenges to achieve a cure in acute myeloid leukemia (AML). Although AML blasts generally retain high levels of surface CD38 (CD38pos), LSCs are frequently enriched in the CD34posCD38neg blast fraction. Here, we report that interferon gamma (IFN-γ) reduces LSCs clonogenic activity and induces CD38 upregulation in both CD38pos and CD38neg LSC-enriched blasts. IFN-γ-induced CD38 upregulation depends on interferon regulatory factor 1 transcriptional activation of the CD38 promoter. To leverage this observation, we created a novel compact, single-chain CD38-CD3 T-cell engager (BN-CD38) designed to promote an effective immunological synapse between CD38pos AML cells and both CD8pos and CD4pos T cells. We demonstrate that BN-CD38 engages autologous CD4pos and CD8pos T cells and CD38pos AML blasts, leading to T-cell activation and expansion and to the elimination of leukemia cells in an autologous setting. Importantly, BN-CD38 engagement induces the release of high levels of IFN-γ, driving the expression of CD38 on CD34posCD38neg LSC-enriched blasts and their subsequent elimination. Critically, although BN-CD38 showed significant in vivo efficacy across multiple disseminated AML cell lines and patient-derived xenograft models, it did not affect normal hematopoietic stem cell clonogenicity and the development of multilineage human immune cells in CD34pos humanized mice. Taken together, this study provides important insights to target and eliminate AML LSCs.


Conflict of interest statement

Conflict-of-interest disclosure: M. Murtadha, M.P., G.M., J.C.W., and F.P. have pending patents covering certain aspects of this technology in anticipation of commercialization. The remaining authors declare no competing financial interests.

Figures

None
Graphical abstract
Figure 1.
Figure 1.
IFN-γ induces CD38 expression in AML cells through IRF-1 transcriptional regulation. (A) Representative flow cytometry dot plots for 2 AML BM samples comparing percent of CD38High population in IFN-γ–treated group vs vehicle-treated group. IFN-γ was added overnight at a concentration of 10 ng/mL to total BM MNCs and gated for CD45DimCD34CD38 population. (B) Violin plot comparing percent of CD38High population between vehicle- and IFN-γ–treated groups for patients with AML (n = 5; 4 BM and 1 PB). Each shape represents a different patient with AML. Each patient sample was analyzed in duplicate except for 1 patient. Unpaired Student t test was used to calculate statistical significance between vehicle- and IFN-γ–treated groups; ∗∗∗∗P < .0001. (C) AML BM MNCs were treated overnight with different doses of IFN-γ (1.0, 10.0, and 50.0 ng/mL), and CD38 surface expression was determined in CD45Dim population with flow cytometry. Overlaid dot plots show shift in CD38 expression with IFN-γ treatment, and the table to the right lists mean fluorescence intensity (MFI) for each dose and control. (D) Representative images of colony forming cell (CFC) assay for patient with AML after treatment with IFN-γ (10 ng/mL) or vehicle. Images were acquired in tiles to cover complete well and stitched. Violin plot comparing colony forming units (CFUs) between vehicle- and IFN-γ–treated (10 ng/mL) groups for patients with AML (n = 4: 3 PB and 1 BM). Each shape represents a different patient with AML. Samples from each patient was analyzed in duplicate. Unpaired Student t test was used to calculate statistical significance between vehicle- and IFN-γ–treated groups; ∗∗P < .01. (E) 3D uniform manifold approximation and projection (UMAP) depicting effect of IFN-γ treatment (10 ng/mL, 5 hours) on AML total BM MNCs of 1 patient with relapsed AML. (F) CD34pos cells were purified from 3 patients’ BM MNCs (relapsed AML) and equally divided for vehicle and IFN-γ (10 ng/mL) treatment groups. After overnight treatment, cells were collected, and RNA was extracted and subjected to bulk RNAseq. z score–based hierarchical clustering heat map showing top 75 upregulated genes and 5 downregulated genes in 3 patients with AML upon IFN-γ treatment. (G) Venn diagram analysis showing the highest upregulated genes upon IFN-γ treatment that were commonly found between scRNAseq and bulk RNAseq analysis. (H) CD34pos cells were selected from BM MNCs of 3 patients with relapsed AML and treated overnight with vehicle or 10 ng/mL of IFN-γ, followed by CD38 and IRF-1 quantitative reverse transcription polymerase chain reaction (qRT-PCR). CD38 and IRF-1 messenger RNA (mRNA) expression is shown as fold change (F.C.) relative to vehicle control. Each sample was normalized to glyceraldehyde-3-phosphate dehydrogenase (GAPDH) and analyzed in triplicate. Paired Student t test was used to calculate significance. (I) Schematic cartoon showing cloned CD38 promoter in pGL3 plasmid, which encompassed IRF-1 consensus sequences (CS) and transcription start site (TSS) and shows location of IRF-1 CS relative to TSS. Also, mutagenesis strategy used to delete the IRF-1 binding sites in CD38 promoter is shown. (J-K) THP1 and HEK293 cells were cotransfected with CD38 wild-type (WT) promoter vector and empty expression vector, CD38 WT promoter vector and IRF-1 expression vector, and CD38 mutant promoter vector and empty expression vector, and CD38 mutant promoter vector and IRF-1 expression vector for 24 hours for HEK293 and 48 hours for THP1 cells. All the samples were also cotransfected with pRL-TK as internal control. All the samples were subjected to dual luciferase assay and luciferase/renilla ratio was calculated for each sample. Bar graphs show luciferase activity of CD38 promoter. Each group (WT and mutant CD38 promoter) with IRF-1 expression vector was normalized with its respective control expression vectors. Three independent experiments containing 2 technical duplicates were performed. Paired Student t test was used to compare groups. (L) THP1 cells were transfected twice with 50 nM siRNA control (siCtrl) or siRNA IRF-1 (siIRF-1) at time 0 and 24 hours. At 24 hours after transfection, cells were equally divided between wells for siCtrl and siIRF-1 and half the wells for each siRNA were either subjected to vehicle or IFN-γ (10 ng/mL) treatment overnight. Surface staining was performed for CD38 and subjected to flow cytometry. Histograms represented in MFI show IFN-γ–induced CD38 surface expression, which was rescued by IRF-1 knock down. Violin plot is representation of 3 independent experiments. Ordinary 1-way analysis of variance (ANOVA) with multiple comparisons was used as statistical test.
Figure 1.
Figure 1.
IFN-γ induces CD38 expression in AML cells through IRF-1 transcriptional regulation. (A) Representative flow cytometry dot plots for 2 AML BM samples comparing percent of CD38High population in IFN-γ–treated group vs vehicle-treated group. IFN-γ was added overnight at a concentration of 10 ng/mL to total BM MNCs and gated for CD45DimCD34CD38 population. (B) Violin plot comparing percent of CD38High population between vehicle- and IFN-γ–treated groups for patients with AML (n = 5; 4 BM and 1 PB). Each shape represents a different patient with AML. Each patient sample was analyzed in duplicate except for 1 patient. Unpaired Student t test was used to calculate statistical significance between vehicle- and IFN-γ–treated groups; ∗∗∗∗P < .0001. (C) AML BM MNCs were treated overnight with different doses of IFN-γ (1.0, 10.0, and 50.0 ng/mL), and CD38 surface expression was determined in CD45Dim population with flow cytometry. Overlaid dot plots show shift in CD38 expression with IFN-γ treatment, and the table to the right lists mean fluorescence intensity (MFI) for each dose and control. (D) Representative images of colony forming cell (CFC) assay for patient with AML after treatment with IFN-γ (10 ng/mL) or vehicle. Images were acquired in tiles to cover complete well and stitched. Violin plot comparing colony forming units (CFUs) between vehicle- and IFN-γ–treated (10 ng/mL) groups for patients with AML (n = 4: 3 PB and 1 BM). Each shape represents a different patient with AML. Samples from each patient was analyzed in duplicate. Unpaired Student t test was used to calculate statistical significance between vehicle- and IFN-γ–treated groups; ∗∗P < .01. (E) 3D uniform manifold approximation and projection (UMAP) depicting effect of IFN-γ treatment (10 ng/mL, 5 hours) on AML total BM MNCs of 1 patient with relapsed AML. (F) CD34pos cells were purified from 3 patients’ BM MNCs (relapsed AML) and equally divided for vehicle and IFN-γ (10 ng/mL) treatment groups. After overnight treatment, cells were collected, and RNA was extracted and subjected to bulk RNAseq. z score–based hierarchical clustering heat map showing top 75 upregulated genes and 5 downregulated genes in 3 patients with AML upon IFN-γ treatment. (G) Venn diagram analysis showing the highest upregulated genes upon IFN-γ treatment that were commonly found between scRNAseq and bulk RNAseq analysis. (H) CD34pos cells were selected from BM MNCs of 3 patients with relapsed AML and treated overnight with vehicle or 10 ng/mL of IFN-γ, followed by CD38 and IRF-1 quantitative reverse transcription polymerase chain reaction (qRT-PCR). CD38 and IRF-1 messenger RNA (mRNA) expression is shown as fold change (F.C.) relative to vehicle control. Each sample was normalized to glyceraldehyde-3-phosphate dehydrogenase (GAPDH) and analyzed in triplicate. Paired Student t test was used to calculate significance. (I) Schematic cartoon showing cloned CD38 promoter in pGL3 plasmid, which encompassed IRF-1 consensus sequences (CS) and transcription start site (TSS) and shows location of IRF-1 CS relative to TSS. Also, mutagenesis strategy used to delete the IRF-1 binding sites in CD38 promoter is shown. (J-K) THP1 and HEK293 cells were cotransfected with CD38 wild-type (WT) promoter vector and empty expression vector, CD38 WT promoter vector and IRF-1 expression vector, and CD38 mutant promoter vector and empty expression vector, and CD38 mutant promoter vector and IRF-1 expression vector for 24 hours for HEK293 and 48 hours for THP1 cells. All the samples were also cotransfected with pRL-TK as internal control. All the samples were subjected to dual luciferase assay and luciferase/renilla ratio was calculated for each sample. Bar graphs show luciferase activity of CD38 promoter. Each group (WT and mutant CD38 promoter) with IRF-1 expression vector was normalized with its respective control expression vectors. Three independent experiments containing 2 technical duplicates were performed. Paired Student t test was used to compare groups. (L) THP1 cells were transfected twice with 50 nM siRNA control (siCtrl) or siRNA IRF-1 (siIRF-1) at time 0 and 24 hours. At 24 hours after transfection, cells were equally divided between wells for siCtrl and siIRF-1 and half the wells for each siRNA were either subjected to vehicle or IFN-γ (10 ng/mL) treatment overnight. Surface staining was performed for CD38 and subjected to flow cytometry. Histograms represented in MFI show IFN-γ–induced CD38 surface expression, which was rescued by IRF-1 knock down. Violin plot is representation of 3 independent experiments. Ordinary 1-way analysis of variance (ANOVA) with multiple comparisons was used as statistical test.
Figure 2.
Figure 2.
BN-CD38 shows potent antileukemic efficacy in vitro and ex vivo. (A) Schematic illustration of the therapeutic rationale to target CD38neg LSCs with T-cell engagers against CD38 to eradicate AML by uncovering the IFN-γ/CD38 regulatory loop. Graphical representation of (B) BN-CD38 projected structure; (C) distance between T cell and tumor cell membranes upon TCR-MHC interaction; and (D) spatial prediction of how BN-CD38 interaction with T cell (CD3) and tumor cell (CD38) is similar to the interaction observed in the MHC-TCR complex. (E) Surface plasmon resonance (SPR) sensorgrams for CD38 and CD3 binding with different concentrations of BN-CD38. (F) THP1 green fluorescent protein–positive (GFPpos) cells were cocultured with healthy donor T cells at an E:T ratio of 1:1 overnight (16 hours) in the presence of increasing doses of BN-CD38 active (A) and BN-CD38Mut. THP1 cell killing was determined with 7-aminoactinomycin D staining and gating on GFPpos cells by flow cytometry. IC50 curves are shown for BN-CD38 and BN-CD38Mut, and data are represented as mean ± standard error of the mean (SEM) of 5 independent healthy donors. (G-H) Samples in panel F were also used to assess the induction of early (CD69) and late (CD25) T-cell activation markers in the total CD4 or CD8 T cells. Dose-dependent T-cell activation curves are represented as mean ± SEM of 3 healthy donors. Ordinary 1-way ANOVA test was used for calculation of statistical significance. (I-K) Total AML cells (n = 7) were treated with 1.0 ng/mL IgG, CD38-NB, BN-CD38 Mut, or BN-CD38 for 5 days and subjected to cell surface staining for CD34 and CD38. (I) Representative flow cytometry contour plots of 2 representative patient-derived AML samples and (J-K) violin plots show elimination of total AML cells (CD34posCD38pos blasts and CD34posCD38neg LSCs) with BN-CD38 compared with control treatments (IgG, CD38-NB, and BN-CD38Mut). Cell frequencies were normalized to the paired control human IgG treatment and shown as F.C. Overall, 2 of 7 patients were not assessed with BN-CD38Mut and CD38 NB. (L) Total AML cells were treated with 1.0 ng/mL control human IgG, CD38NB, BN-CD38 Mut, or BN-CD38 and plated in CFC assay for 14 days. Violin plot illustrates the normalized CFU F.C. for each treatment group compared with the paired IgG (CD38 NB, n = 4 PB; BN-CD38 Mut, n = 4 PB; BN-CD38, n = 11 [9 PB and 2 BM]). Each dot in each treatment group represents 1 individual patient. (M) Schematic cartoon and representative flow cytometry contour plot of the experimental design and gating strategy used to assess apoptosis of CD38neg AML blasts by autologous T cells. (N) Contour plots of 2 representative patients with AML showing annexin-V/4′,6-diamidino-2-phenylindole (DAPI) staining of the CD38neg gated population after treatment with IgG, BN-CD38Mut, or BN-CD38 SNs in the presence of autologous T cells. (O) Violin plot showing changes in induced apoptosis in each treatment group. Unpaired Student t test was used to calculate statistical significance in n = 4 patients with AML; ∗∗∗P < .001, n = 4. For panels G-H,J-L, 1-way ANOVA with multiple comparisons was used to calculate statistical significance between different groups; ∗P < .05; ∗∗P < .01; ∗∗∗P < .001; and ∗∗∗∗P < .0001. E, effector T cells; ns, not significant; T, target cancer cells.
Figure 2.
Figure 2.
BN-CD38 shows potent antileukemic efficacy in vitro and ex vivo. (A) Schematic illustration of the therapeutic rationale to target CD38neg LSCs with T-cell engagers against CD38 to eradicate AML by uncovering the IFN-γ/CD38 regulatory loop. Graphical representation of (B) BN-CD38 projected structure; (C) distance between T cell and tumor cell membranes upon TCR-MHC interaction; and (D) spatial prediction of how BN-CD38 interaction with T cell (CD3) and tumor cell (CD38) is similar to the interaction observed in the MHC-TCR complex. (E) Surface plasmon resonance (SPR) sensorgrams for CD38 and CD3 binding with different concentrations of BN-CD38. (F) THP1 green fluorescent protein–positive (GFPpos) cells were cocultured with healthy donor T cells at an E:T ratio of 1:1 overnight (16 hours) in the presence of increasing doses of BN-CD38 active (A) and BN-CD38Mut. THP1 cell killing was determined with 7-aminoactinomycin D staining and gating on GFPpos cells by flow cytometry. IC50 curves are shown for BN-CD38 and BN-CD38Mut, and data are represented as mean ± standard error of the mean (SEM) of 5 independent healthy donors. (G-H) Samples in panel F were also used to assess the induction of early (CD69) and late (CD25) T-cell activation markers in the total CD4 or CD8 T cells. Dose-dependent T-cell activation curves are represented as mean ± SEM of 3 healthy donors. Ordinary 1-way ANOVA test was used for calculation of statistical significance. (I-K) Total AML cells (n = 7) were treated with 1.0 ng/mL IgG, CD38-NB, BN-CD38 Mut, or BN-CD38 for 5 days and subjected to cell surface staining for CD34 and CD38. (I) Representative flow cytometry contour plots of 2 representative patient-derived AML samples and (J-K) violin plots show elimination of total AML cells (CD34posCD38pos blasts and CD34posCD38neg LSCs) with BN-CD38 compared with control treatments (IgG, CD38-NB, and BN-CD38Mut). Cell frequencies were normalized to the paired control human IgG treatment and shown as F.C. Overall, 2 of 7 patients were not assessed with BN-CD38Mut and CD38 NB. (L) Total AML cells were treated with 1.0 ng/mL control human IgG, CD38NB, BN-CD38 Mut, or BN-CD38 and plated in CFC assay for 14 days. Violin plot illustrates the normalized CFU F.C. for each treatment group compared with the paired IgG (CD38 NB, n = 4 PB; BN-CD38 Mut, n = 4 PB; BN-CD38, n = 11 [9 PB and 2 BM]). Each dot in each treatment group represents 1 individual patient. (M) Schematic cartoon and representative flow cytometry contour plot of the experimental design and gating strategy used to assess apoptosis of CD38neg AML blasts by autologous T cells. (N) Contour plots of 2 representative patients with AML showing annexin-V/4′,6-diamidino-2-phenylindole (DAPI) staining of the CD38neg gated population after treatment with IgG, BN-CD38Mut, or BN-CD38 SNs in the presence of autologous T cells. (O) Violin plot showing changes in induced apoptosis in each treatment group. Unpaired Student t test was used to calculate statistical significance in n = 4 patients with AML; ∗∗∗P < .001, n = 4. For panels G-H,J-L, 1-way ANOVA with multiple comparisons was used to calculate statistical significance between different groups; ∗P < .05; ∗∗P < .01; ∗∗∗P < .001; and ∗∗∗∗P < .0001. E, effector T cells; ns, not significant; T, target cancer cells.
Figure 3.
Figure 3.
IFN-γ plays a pivotal role in BN-CD38 antileukemic activity. (A-I,L-M) Total MNCs of 7 patients with AML (see supplemental Table 1) were treated with 1.0 ng/mL of BN-CD38, BN-CD38Mut, or control human IgG for 5 days. Moreover, cells from 4 of the patients were also treated with BN-CD38 (1.0 ng/mL) and 2.0 μg of αIFN-γ antibody for 5 days. The treated MNCs were subjected to CyTOF immunophenotyping comprising 36 surface markers tailored to detect AML primary cells and different immune subsets. Analysis was performed with the Cytobank platform. (A) Supervised high-fidelity FlowSOM (“self-organizing maps”) based on vi-SNE 2D analysis for 2 representative patients with AML (1 PB and 1 BM) showing that BN-CD38 reduces CD38pos and CD38neg AML cells and expands T-cell subsets. Equal number of events were analyzed for each treatment group for each patient, and bulk MNCs were gated. (B-C) Violin plots showing BN-CD38 but not BN-CD38Mut significantly decreases CD38pos and CD38neg AML cells event count. (D-F) Violin plots showing BN-CD38 and not BN-CD38Mut expands CD8pos effector memory (EM) and terminally differentiated EM CD45RApos cells (TEMRA), memory T regulatory cells (Tregs), and NK T cells. (G-H) Data-driven self-stratifying CITRUS (cluster identification, characterization, and regression) analysis of 5 CD34pos AML PB samples subjected to CyTOF immunophenotyping revealed that 7 clusters (red circles) were significantly changed (FDR < 0.01) between BN-CD38 and control groups (IgG and BN-CD38Mut). Clusters (599995, 599997, and 599998) were significantly less abundant with BN-CD38 treatment and were enriched with AML specific markers CD34, CD33, and CD117 (c-Kit), and negative for CD3 T-cell marker. Clusters (599990, 599993, 599994, and 599996) were significantly abundant with BN-CD38 treatment and are enriched with T-cell surface markers and phagocytic classical monocytes (CD14+CD16negHLA-DR+). (I) Bar graphs of 7 clusters differentially and significantly (FDR < 0.01) changed with BN-CD38 compared with control human IgG and BN-CD38Mut. (J) Total AML cells of 4 patients with AML were treated with 1.0 ng/mL BN-CD38, BN-CD38Mut, CD38 NB, and control human IgG in combination with 2.0 μg rat control IgG or 2.0 μg rat anti-human IFN-γ antibody for 48 hours. RNA was extracted and subjected to CD38 qRT-PCR. Each sample was normalized to GAPDH followed by normalization to control human IgG for each patient and shown as F.C. over IgG. Two-way ANOVA with multiple comparisons was used to calculate statistical significance between different groups; ∗∗∗∗P < .0001. (K) Cells treated in panel J were also collected and subjected to flow cytometry surface staining of CD45, CD34, and CD38. CD38 expression was determined in CD45DIM AML population. Two-way ANOVA with multiple comparisons was used to calculate statistical significance between different groups; ∗∗∗P < .001 and ∗∗∗∗P < .0001. (L) Four of the patient samples (4 PB samples from patients with CD34pos) were also treated with BN-CD38 (A; 1.0 ng/mL) and 2.0 μg of αIFN-γ antibody for 5 days. The treated MNCs were subjected to CyTOF immunophenotyping. Unsupervised high-fidelity FlowSOM (self-organizing maps) based on vi-SNE 2D analysis for PB-derived MNCs of 3 representative patients with AML showing that anti-human IFN-γ antibody restores AML cells, specifically LSCs in the presence of BN-CD38. (M) Violin plot representation showing that anti-human IFN-γ antibody in the presence of BN-CD38 rescues CD34posCD38neg LSCs compared with BN-CD38 alone. For panels B through F and panel M, event counts of BN-CD38 (A) and BN-CD38Mut were normalized to control human IgG and normalization was converted to log scale F.C. The paired Student t test was used to calculate statistical significance; ∗P < .05; ∗∗P < .01; ∗∗∗P < .001; and ∗∗∗∗P < .0001.
Figure 3.
Figure 3.
IFN-γ plays a pivotal role in BN-CD38 antileukemic activity. (A-I,L-M) Total MNCs of 7 patients with AML (see supplemental Table 1) were treated with 1.0 ng/mL of BN-CD38, BN-CD38Mut, or control human IgG for 5 days. Moreover, cells from 4 of the patients were also treated with BN-CD38 (1.0 ng/mL) and 2.0 μg of αIFN-γ antibody for 5 days. The treated MNCs were subjected to CyTOF immunophenotyping comprising 36 surface markers tailored to detect AML primary cells and different immune subsets. Analysis was performed with the Cytobank platform. (A) Supervised high-fidelity FlowSOM (“self-organizing maps”) based on vi-SNE 2D analysis for 2 representative patients with AML (1 PB and 1 BM) showing that BN-CD38 reduces CD38pos and CD38neg AML cells and expands T-cell subsets. Equal number of events were analyzed for each treatment group for each patient, and bulk MNCs were gated. (B-C) Violin plots showing BN-CD38 but not BN-CD38Mut significantly decreases CD38pos and CD38neg AML cells event count. (D-F) Violin plots showing BN-CD38 and not BN-CD38Mut expands CD8pos effector memory (EM) and terminally differentiated EM CD45RApos cells (TEMRA), memory T regulatory cells (Tregs), and NK T cells. (G-H) Data-driven self-stratifying CITRUS (cluster identification, characterization, and regression) analysis of 5 CD34pos AML PB samples subjected to CyTOF immunophenotyping revealed that 7 clusters (red circles) were significantly changed (FDR < 0.01) between BN-CD38 and control groups (IgG and BN-CD38Mut). Clusters (599995, 599997, and 599998) were significantly less abundant with BN-CD38 treatment and were enriched with AML specific markers CD34, CD33, and CD117 (c-Kit), and negative for CD3 T-cell marker. Clusters (599990, 599993, 599994, and 599996) were significantly abundant with BN-CD38 treatment and are enriched with T-cell surface markers and phagocytic classical monocytes (CD14+CD16negHLA-DR+). (I) Bar graphs of 7 clusters differentially and significantly (FDR < 0.01) changed with BN-CD38 compared with control human IgG and BN-CD38Mut. (J) Total AML cells of 4 patients with AML were treated with 1.0 ng/mL BN-CD38, BN-CD38Mut, CD38 NB, and control human IgG in combination with 2.0 μg rat control IgG or 2.0 μg rat anti-human IFN-γ antibody for 48 hours. RNA was extracted and subjected to CD38 qRT-PCR. Each sample was normalized to GAPDH followed by normalization to control human IgG for each patient and shown as F.C. over IgG. Two-way ANOVA with multiple comparisons was used to calculate statistical significance between different groups; ∗∗∗∗P < .0001. (K) Cells treated in panel J were also collected and subjected to flow cytometry surface staining of CD45, CD34, and CD38. CD38 expression was determined in CD45DIM AML population. Two-way ANOVA with multiple comparisons was used to calculate statistical significance between different groups; ∗∗∗P < .001 and ∗∗∗∗P < .0001. (L) Four of the patient samples (4 PB samples from patients with CD34pos) were also treated with BN-CD38 (A; 1.0 ng/mL) and 2.0 μg of αIFN-γ antibody for 5 days. The treated MNCs were subjected to CyTOF immunophenotyping. Unsupervised high-fidelity FlowSOM (self-organizing maps) based on vi-SNE 2D analysis for PB-derived MNCs of 3 representative patients with AML showing that anti-human IFN-γ antibody restores AML cells, specifically LSCs in the presence of BN-CD38. (M) Violin plot representation showing that anti-human IFN-γ antibody in the presence of BN-CD38 rescues CD34posCD38neg LSCs compared with BN-CD38 alone. For panels B through F and panel M, event counts of BN-CD38 (A) and BN-CD38Mut were normalized to control human IgG and normalization was converted to log scale F.C. The paired Student t test was used to calculate statistical significance; ∗P < .05; ∗∗P < .01; ∗∗∗P < .001; and ∗∗∗∗P < .0001.
Figure 4.
Figure 4.
BN-CD38 displays a strong antileukemic efficacy in vivo. (A) Schematic representation of the experimental design and treatment for in vivo studies in NSG mice xenografted with 1 million GFPposLucposTHP-1 cells. On day 18, engraftment was confirmed with bioluminescence imaging (BLI), and mice were randomized. Treatment was started on day 19, and mice were administered control human IgG or BN-CD38 (2.5 mg/kg per mouse), together with 3 million healthy donor–derived human T cells per mouse weekly by IV. Mice in the treatment group were treated once a week for 4 weeks with BN-CD38 plus T cells, whereas mice in the control group received only 2 treatments, because all control mice had died by day 32, before the next planned treatment (day 33). Mice were monitored weekly by BLI for tumor burden assessment. (B) BLI images showing tumor engraftment in the different treatment groups. (C) Bar graph showing the BLI average radiance for control human IgG– and BN-CD38–treated mice on days 25 and 29. Error bars are represented as mean ± SEM. Unpaired Student t test was used for statistical significance calculation. (D) Kaplan-Meier survival curve showing increased survival in BN-CD38–treated mice (n = 8) compared with control IgG–treated mice (n = 10). Log-rank (Mantel-Cox) test was used to determine statistical significance. (E) Kaplan-Meier survival curve showing increased survival in PDX-1 (AML-15) mice transplanted with the BM of BN-CD38–treated animals as reported in the schematic representation and treatment design in supplemental Figure 5G-J. Briefly, 1 million MNCs from a patient with AML with complex karyotype (PDX-1, AML-15) were injected by IV into irradiated NSG, and once engraftment was confirmed in the PB, mice were randomized and weekly cotreated with BN-CD38 (A, 2.5 mg/kg per mouse; n = 5), BN-CD38Mut (n = 5), or control IgG (n = 5), and 3 million healthy donor purified T cells by IV. A total of 3 treatments were administered, and mice BM cells were collected on day 42 and subjected to subsequent secondary and tertiary transplantations. Log-rank (Mantel-Cox) test was used to determine statistical significance; ∗∗∗P < .001. (F) Kaplan-Meier survival curve showing increased survival in PDX-2 (AML-22) mice engrafted with 1 million of total AML MNCs and treated with BN-CD38. Briefly, once engraftment was confirmed in week 8, mice were randomized into 4 groups: control human IgG (n = 5), BN-CD38Mut (n = 5), CD38 NB (n = 4), and BN-CD38 (n = 6). Each group received 2.5 mg/kg of respective treatment and 3 million healthy donor–derived T cells weekly at week 8, 9, 10, and 11 by IV. In week 12 and 13, mice of each group received only respective treatment and no T cells. Survival was monitored, and on week 20, BN-CD38 (A) treated mice were rechallenged with 1 million paired AML blasts (AML-22). In week 29, mice remained healthy and were humanely euthanized to assess tumor burden. Log-rank (Mantel-Cox) test was used to determine statistical significance. (G) Schematic representation of the experimental design and treatment for PDX-3 (AML-4); this model was administered with autologous T cells. Once engraftment was confirmed by flow cytometry on day 14, mice were randomized into 2 groups: BN-CD38Mut (n = 4) and BN-CD38 (n = 5). Each week mice were treated with 2.5 mg/kg of respective BIONICs and 1 million autologous T cells enriched fraction by IV. A total of 4 treatments (once a week) were administered. Mice were humanely euthanized on day 71 and assessed for tumor engraftment and T cells. (H-I) Contour plots of 1 representative mouse for each treatment group illustrate percentages of human CD33pos AML cells and human CD3pos T cells in the total BM and spleen (SP) cellular population. AML-to–T cells ratio was calculated for each mouse in 2 treatment groups, and violin plots show that BN-CD38Mut–treated mice had higher tumor burden than levels in BN-CD38–treated mice that showed T-cell expansion. Unpaired Student t test was used to calculate statistical significance; ∗∗P < .01 and ∗∗∗∗P < .0001.
Figure 5.
Figure 5.
BN-CD38 spares HSCs and noncancer immune cells. (A) Healthy donor (HD)-derived total BM MNCs were treated with 1.0 ng/mL control human IgG (n = 7), CD38 NB (n = 3), BN-CD38Mut (n = 7), and BN-CD38 (n = 7) and plated in CFC assay for 14 days. Representative images of CFC assay for 2 representative HDs’ BM MNCs showing effect of 4 treatments. Images were acquired in tiles by the City of Hope microscopy core facility using ZEN 3.1 (blue edition, Carl Zeiss Microscopy GmbH). (B) Violin plot comparing CFU of each treatment group. CFU of each treatment group was normalized to control human IgG for each HD and shown as F.C. over IgG. One-way ANOVA with multiple comparisons was used to calculate statistical significance. (C-E) Three HD-derived total BM MNCs were treated with 1.0 ng/mL control human IgG, CD38 NB, BN-CD38Mut, or BN-CD38. BM MNCs were collected at 48 and 120 hours after treatment and subjected to surface staining with CD45, CD34, and CD38. (C) Representative dot plot of 2 HDs’ BM MNCs showing effect of control human IgG, CD38NB, BN-CD38Mut, and BN-CD38 treatment on CD34posCD38pos healthy progenitors and CD34posCD38neg HSCs. (D-E) Violin plots compare the effect of different treatment groups on CD34posCD38pos healthy progenitors and CD34posCD38neg HSCs after treatment. The percent CD34posCD38pos and percent CD34posCD38neg of each treatment group was normalized to control human IgG and shown as F.C. over IgG. One-way ANOVA with multiple comparisons was used to calculate statistical significance. (F-H) HDs’ total BM MNCs (n = 3) treated in panel B were gated in total CD4 or CD8 T cells and each population was assessed for CD69 expression. (F) Violin plots compare the percent CD4posCD69pos and percent CD8posCD69pos activated T cells at 48 hours. One-way ANOVA with multiple comparisons was used to calculate statistical significance for T-cell activation. (G-H) Violin plots compare percent CD4pos and percent CD8pos T cells over the total cellular population between different treatment groups at 48 and 120 hours. Paired Student t test was used to compare percent frequencies of T cells between treatment groups. (I) HD-derived total PB MNCs were treated with 1.0 ng/mL control human IgG, CD38 NB, BN-CD38Mut, or BN-CD38 for 72 hours and gated for monocytes (n = 5), NK cells (n = 4), B cells (n = 4), and CD4pos and CD8pos T cells (n = 4), followed by gating with DAPI to assess percent killing. Violin plots compare percent killing (DAPI positivity) between different treatment groups. One-way ANOVA with multiple comparisons was used to calculate statistical significance. (J) Representative dot plot showing CD38 expression in CD45Dim population after treatment of bulk MNCs with 1.0 ng/mL of BN-CD38, BN-CD38Mut, and control human IgG. (K) Violin plot comparing CD38 surface expression in CD45Dim population of AML (n = 7: 5 PB, 1 BM, and 1 leukapheresis [LP]) and HD (n = 3 BM) MNCs treated with 1.0 ng/mL of control human IgG, BN-CD38Mut, or BN-CD38 for 48 hours. BN-CD38 and BN-CD38Mut CD38 surface expression measured by flow cytometry in MFI were normalized to control human IgG. Ordinary 1-way ANOVA with Dunnett multiple comparisons test was used to calculate significance; ∗P < .05. (L) Total CD34pos cells (HSCs and CD38+ progenitors) were isolated from HDs and cocultured with THP1 GFPpos cells (CD34neg; supplemental Figure 6J-K) at a HSCs:THP1 ratio of 1:10, and T cells were added at an E:T (T cells:THP1) of 1:1 overnight in the presence of increasing doses of BN-CD38. The experiment was repeated using n = 2 donors for a total of 4 independent replicates for each point. DAPIneg THP1 GFP and CD34pos alive cell frequencies were determined by gating in the GFP or CD34pos populations, respectively. Each dose frequency was normalized to vehicle control, and simple linear regression analyses were used to determine the BN-CD38 dose effect on THP1 and total CD34pos cells. (M) Schematic representation of the generation and treatment of CD34pos humanized NSG mouse model. Specifically, 5 × 105 CD34pos selected cells from HDs were IV injected into irradiated NSG mice. Once engraftment of human CD45pos cells was confirmed on day 150, mice were randomized into 3 groups: control human IgG (n = 4), BN-CD38Mut (n = 4), and BN-CD38 (n = 5). Each mouse was IV treated with 2.5 mg/kg and 3 million autologous T cells, as indicated. Following 3 treatments, mice were euthanized on day 173, and total BM cells were isolated and subjected to flow cytometry analysis for human immune cell engraftment (hCD45+). (N) Representative contour plots of hCD34 in hCD45pos selected cells. One representative mouse is shown for each treatment group. (O) Bar graph comparing percent of different immune subsets in human CD45pos selected cells in BM, as indicated. Ordinary 1-way ANOVA with multiple comparisons was used as statistical test. ns, not significant.
Figure 5.
Figure 5.
BN-CD38 spares HSCs and noncancer immune cells. (A) Healthy donor (HD)-derived total BM MNCs were treated with 1.0 ng/mL control human IgG (n = 7), CD38 NB (n = 3), BN-CD38Mut (n = 7), and BN-CD38 (n = 7) and plated in CFC assay for 14 days. Representative images of CFC assay for 2 representative HDs’ BM MNCs showing effect of 4 treatments. Images were acquired in tiles by the City of Hope microscopy core facility using ZEN 3.1 (blue edition, Carl Zeiss Microscopy GmbH). (B) Violin plot comparing CFU of each treatment group. CFU of each treatment group was normalized to control human IgG for each HD and shown as F.C. over IgG. One-way ANOVA with multiple comparisons was used to calculate statistical significance. (C-E) Three HD-derived total BM MNCs were treated with 1.0 ng/mL control human IgG, CD38 NB, BN-CD38Mut, or BN-CD38. BM MNCs were collected at 48 and 120 hours after treatment and subjected to surface staining with CD45, CD34, and CD38. (C) Representative dot plot of 2 HDs’ BM MNCs showing effect of control human IgG, CD38NB, BN-CD38Mut, and BN-CD38 treatment on CD34posCD38pos healthy progenitors and CD34posCD38neg HSCs. (D-E) Violin plots compare the effect of different treatment groups on CD34posCD38pos healthy progenitors and CD34posCD38neg HSCs after treatment. The percent CD34posCD38pos and percent CD34posCD38neg of each treatment group was normalized to control human IgG and shown as F.C. over IgG. One-way ANOVA with multiple comparisons was used to calculate statistical significance. (F-H) HDs’ total BM MNCs (n = 3) treated in panel B were gated in total CD4 or CD8 T cells and each population was assessed for CD69 expression. (F) Violin plots compare the percent CD4posCD69pos and percent CD8posCD69pos activated T cells at 48 hours. One-way ANOVA with multiple comparisons was used to calculate statistical significance for T-cell activation. (G-H) Violin plots compare percent CD4pos and percent CD8pos T cells over the total cellular population between different treatment groups at 48 and 120 hours. Paired Student t test was used to compare percent frequencies of T cells between treatment groups. (I) HD-derived total PB MNCs were treated with 1.0 ng/mL control human IgG, CD38 NB, BN-CD38Mut, or BN-CD38 for 72 hours and gated for monocytes (n = 5), NK cells (n = 4), B cells (n = 4), and CD4pos and CD8pos T cells (n = 4), followed by gating with DAPI to assess percent killing. Violin plots compare percent killing (DAPI positivity) between different treatment groups. One-way ANOVA with multiple comparisons was used to calculate statistical significance. (J) Representative dot plot showing CD38 expression in CD45Dim population after treatment of bulk MNCs with 1.0 ng/mL of BN-CD38, BN-CD38Mut, and control human IgG. (K) Violin plot comparing CD38 surface expression in CD45Dim population of AML (n = 7: 5 PB, 1 BM, and 1 leukapheresis [LP]) and HD (n = 3 BM) MNCs treated with 1.0 ng/mL of control human IgG, BN-CD38Mut, or BN-CD38 for 48 hours. BN-CD38 and BN-CD38Mut CD38 surface expression measured by flow cytometry in MFI were normalized to control human IgG. Ordinary 1-way ANOVA with Dunnett multiple comparisons test was used to calculate significance; ∗P < .05. (L) Total CD34pos cells (HSCs and CD38+ progenitors) were isolated from HDs and cocultured with THP1 GFPpos cells (CD34neg; supplemental Figure 6J-K) at a HSCs:THP1 ratio of 1:10, and T cells were added at an E:T (T cells:THP1) of 1:1 overnight in the presence of increasing doses of BN-CD38. The experiment was repeated using n = 2 donors for a total of 4 independent replicates for each point. DAPIneg THP1 GFP and CD34pos alive cell frequencies were determined by gating in the GFP or CD34pos populations, respectively. Each dose frequency was normalized to vehicle control, and simple linear regression analyses were used to determine the BN-CD38 dose effect on THP1 and total CD34pos cells. (M) Schematic representation of the generation and treatment of CD34pos humanized NSG mouse model. Specifically, 5 × 105 CD34pos selected cells from HDs were IV injected into irradiated NSG mice. Once engraftment of human CD45pos cells was confirmed on day 150, mice were randomized into 3 groups: control human IgG (n = 4), BN-CD38Mut (n = 4), and BN-CD38 (n = 5). Each mouse was IV treated with 2.5 mg/kg and 3 million autologous T cells, as indicated. Following 3 treatments, mice were euthanized on day 173, and total BM cells were isolated and subjected to flow cytometry analysis for human immune cell engraftment (hCD45+). (N) Representative contour plots of hCD34 in hCD45pos selected cells. One representative mouse is shown for each treatment group. (O) Bar graph comparing percent of different immune subsets in human CD45pos selected cells in BM, as indicated. Ordinary 1-way ANOVA with multiple comparisons was used as statistical test. ns, not significant.

Comment in

References

    1. Kantarjian H. Acute myeloid leukemia-major progress over four decades and glimpses into the future. Am J Hematol. 2016;91(1):131–145. - PubMed
    1. Shallis RM, Wang R, Davidoff A, Ma X, Zeidan AM. Epidemiology of acute myeloid leukemia: recent progress and enduring challenges. Blood Rev. 2019;36:70–87. - PubMed
    1. Mims AS, Blum W. Progress in the problem of relapsed or refractory acute myeloid leukemia. Curr Opin Hematol. 2019;26(2):88–95. - PubMed
    1. Vasu S, Kohlschmidt J, Mrózek K, et al. Ten-year outcome of patients with acute myeloid leukemia not treated with allogeneic transplantation in first complete remission. Blood Adv. 2018;2(13):1645–1650. - PMC - PubMed
    1. Gupta V, Tallman MS, Weisdorf DJ. Allogeneic hematopoietic cell transplantation for adults with acute myeloid leukemia: myths, controversies, and unknowns. Blood. 2011;117(8):2307–2318. - PubMed

Publication types

MeSH terms