. 2024 May:375:114741.
doi: 10.1016/j.expneurol.2024.114741. Epub 2024 Feb 21.

Nfe2l3 promotes neuroprotection and long-distance axon regeneration after injury in vivo

Affiliations

Nfe2l3 promotes neuroprotection and long-distance axon regeneration after injury in vivo

Agnieszka Lukomska et al. Exp Neurol. 2024 May.

Abstract

Nuclear factor erythroid 2 like (Nfe2l) gene family members 1-3 mediate cellular response to oxidative stress, including in the central nervous system (CNS). However, neuronal functions of Nfe2l3 are unknown. Here, we comparatively evaluated expression of Nfe2l1, Nfe2l2, and Nfe2l3 in singe cell RNA-seq (scRNA-seq)-profiled cortical and retinal ganglion cell (RGC) CNS projection neurons, investigated whether Nfe2l3 regulates neuroprotection and axon regeneration after CNS injury in vivo, and characterized a gene network associated with Nfe2l3 in neurons. We showed that, Nfe2l3 expression transiently peaks in developing immature cortical and RGC projection neurons, but is nearly abolished in adult neurons and is not upregulated after injury. Furthermore, within the retina, Nfe2l3 is enriched in RGCs, primarily neonatally, and not upregulated in injured RGCs, whereas Nfe2l1 and Nfe2l2 are expressed robustly in other retinal cell types as well and are upregulated in injured RGCs. We also found that, expressing Nfe2l3 in injured RGCs through localized intralocular viral vector delivery promotes neuroprotection and long-distance axon regeneration after optic nerve injury in vivo. Moreover, Nfe2l3 provided a similar extent of neuroprotection and axon regeneration as viral vector-targeting of Pten and Klf9, which are prominent regulators of neuroprotection and long-distance axon regeneration. Finally, we bioinformatically characterized a gene network associated with Nfe2l3 in neurons, which predicted the association of Nfe2l3 with established mechanisms of neuroprotection and axon regeneration. Thus, Nfe2l3 is a novel neuroprotection and axon regeneration-promoting factor with a therapeutic potential for treating CNS injury and disease.

Keywords: Axon regeneration; Gene therapy; Optic nerve injury; Retinal ganglion cell.


Conflict of interest statement

Declaration of competing interest The authors declare no competing interests.

Figures

Figure 1.
Figure 1.. Expression of Nfe2l1, Nfe2l2, and Nfe2l3 genes in scRNA-seq-profiled cortical projection neurons at different developmental stages
(A) UMAP of cortical projection neurons, showing cell clusters corresponding to 14-E15 (embryonic), P0 (postnatal), and adult stages of development, as marked (see Methods for details). Immature (embryonic and postnatal) cortical projection neurons are outlined with a dashed-line oval. (B-N) UMAPs showing gene expression of: neuronal markers Rbfox3/NeuN and Gap43 (B-C), glutamatergic neuron markers Vglut1 and Vglut2 (D), negative for interneuron markers Sst and Pvalb (E-F), cortical projection neuron markers Uchl1 and L1cam (G-H), adult cortical layers 5/6 projection neuron markers, which were enriched in subsets of neurons, Foxp2, Ctip2/Bcl11b, and Fezf2 (I-K), and Nfe2l1, Nfe2l2, and Nfe2l3 genes (L-N), in clusters of cortical projection neurons from different stages of development (clusters’ developmental ages are indicated in panel A). Nfe2l3 expression in immature cortical neurons overlapped with expression of adult layer 5 projection neuron markers Bcl11b and Fezf2, as indicated by a dashed red oval line outlining respective cluster in panels J-K and N. Color-coded scale bars, normalized gene expression (NE).
Figure 2.
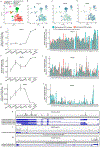
Figure 2.. Expression of Nfe2l1, Nfe2l2, and Nfe2l3 genes in scRNA-seq-profiled retinal cell types and in RGC projection neurons at different developmental stages
(A) UMAP of cell type clusters from E16, P0, adult uninjured, and adult injured (2 weeks post-ONC) retinas, as marked. RGC cluster is outlined by a dashed line. Because except for RGC most retinal cell types are not yet born in the embryonic retina, adult retina dataset was used for other retinal cell types and included proportionately fewer adult RGCs. Thus, most RGCs in the UMAP are from E16 and P0 datasets (see Methods for details). (B-D) UMAPs showing gene expression of Nfe2l1 (B), Nfe2l2 (C) and Nfe2l3 (D) in clusters of retinal cell types (per annotation in panel A). RGC cluster (comprised mostly from neonatal RGCs, as detailed in A) is outlined by a dashed line. Color-coded scale bars, normalized gene expression (NE). (E-G) Line plots of Nfe2l1 (E), Nfe2l2 (F) and Nfe2l3 (G) gene expression in scRNA-seq-profiled RGCs at different ages/conditions, as marked. Mean ± SEM of NE values are shown (see Methods for details). (H-J) Barplots showing subtype-specific expression of Nfe2l1 (H), Nfe2l2 (I), and Nfe2l3 (J) genes in uninjured and injured (2 weeks post-ONC) scRNA-seq-profiled adult RGCs. Asterisk indicates RGC clusters which did not survive 2 weeks after ONC. Mean ± SEM of NE values are shown. (K-M) Purified postnatal (P5) RGC bulk-RNA-seq reads alignment to gene loci of Nfe2l1 (K), Nfe2l2 (L), and Nfe2l3 (M), along with specific transcripts isoforms assembled by Cufflinks, respectively, and annotated with Ensembl transcript IDs (shown on the left side of the panels). Visualization with IGV viewer.
Figure 3.
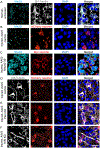
Figure 3.. Validation of Nfe2l3 expression and AAV2 vectors transduction in RGCs
(A) Representative confocal images of the retinal flatmounts’ ganglion cell layer horizontal sections from adult (10 weeks old) mice co-immunostained for Nfe2l3 and βIII-Tubulin (Tuj1; an RGC marker within the retina), and counterstained with DAPI (to label nuclei), show modest Nfe2l3 signal in uninjured Tuj1+/DAPI+ RGCs. (B-F) Mice (8 weeks old) were pre-treated with AAV2 vectors (which selectively transduce the RGCs within the retina) expressing mCherry (control), myc-tagged Nfe2l3, anti-Pten shRNA, or anti-Klf9 shRNA. ONC injury was performed 2 weeks later. Animals were sacrificed for histological analysis 2 weeks after ONC. Representative confocal images of the retinal flatmounts’ horizontal sections co-immunostained for Myc reporter and Nfe2l3 or Tuj1, and counterstained with DAPI, show marginal Nfe2l3 signal in the injured control mCherry+/DAPI+ RGCs (B), which also became punctate relative to the diffuse RGC soma labeling in the uninjured condition (shown in A). However, Nfe2l3 signal in the injured Nfe2l3-treated Myc+/DAPI+ RGCs is robust (C). A subset of the Tuj1+/DAPI+ RGCs are also mCherry reporter+, in the AAV2 mCherry (control), anti-Pten shRNA, and anti-Klf9 shRNA-treated conditions, as marked (D-F). OE = Overexpression; KD = Knockdown. Confocal microscopy, 63x Oil objective; Scale bar, 20 μm.
Figure 4.
Figure 4.. Nfe2l3 promotes RGC survival after optic nerve injury
(A) Experimental timeline: 8 weeks old mice were pre-treated with AAV2 vectors expressing Nfe2l3, anti-Pten shRNA, anti-Klf9 shRNA, or mCherry control. ONC injury was performed 2 weeks later. Animals were sacrificed for histological analysis 2 weeks after ONC. Axonal tracer CTB was injected intravitreally prior to sacrifice. (B) Representative images of the retinal flatmounts immunostained for an RGC marker βIII-Tubulin (Tuj1 antibody) at 2 weeks after ONC, pre-treated with AAV2 expressing Nfe2l3, anti-Pten shRNA, anti-Klf9 shRNA, or mCherry control, as marked. OE = Overexpression; KD = Knockdown. Scale bar, 20 μm. (C-D) Quantitation of RGC survival in retinal flatmounts immunostained for an RGC marker βIII-Tubulin (Tuj1 antibody) at 2 weeks after ONC, pre-treated with AAV2 expressing Nfe2l3, anti-Pten shRNA, anti-Klf9 shRNA, or mCherry control, as marked (C). Data analyzed using ANOVA, overall F = 1017.9, p < 0.001, with p-values of pairwise comparisons determined by posthoc LSD. Significant difference (p < 0.05) indicated by an asterisk * (D). Mean ± SEM shown, n = 4 retinas per group.
Figure 5.
Figure 5.. Nfe2l3 promotes robust axon regeneration after optic nerve injury
(A-B) Representative images of the optic nerve longitudinal sections with CTB-labeled axons at 2 weeks after ONC from the animals pre-treated with expressing Nfe2l3, anti-Pten shRNA, anti-Klf9 shRNA, or mCherry control, as marked (A). Insets: Representative images of the optic nerve regions proximal and distal to the injury site are magnified for better visualization of the axons or their absence (B). The edges of the tissue were optically trimmed (i.e., cropped-out) due to artefactual autofluorescence that is common at tissue edges (see Methods). OE = Overexpression; KD = Knockdown. Scale bars, 500 μm (main panels), 50 μm (insets). (C-D) Quantitation of CTB-labeled regenerating axons at 2 weeks after ONC, at increasing distances from the injury site, after pre-treatment with AAV2 expressing Nfe2l3, anti-Pten shRNA, anti-Klf9 shRNA, or mCherry control, as marked (C). Data analyzed using repeated measures ANOVA, sphericity assumed, overall F = 13.2, p < 0.01, with p-values of pairwise comparisons determined by posthoc LSD shown in the inset table, and significant differences (p < 0.05) indicated by an asterisk * (D). Mean ± SEM shown; n = 4 optic nerves per group.
Figure 6.
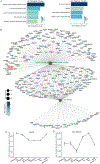
Figure 6.. Nfe2l3-associated gene ontology enriched in Nfe2l3-expressing RGCs
(A) Barplots showing gene ontology (GO) annotations for biological process (BP; left) and molecular function (MF; right), which were enriched within the Nfe2l3-associated genes meaningfully expressed (>= 1 NE) in Nfe2l3+ neonatal RGCs relative to all genes expressed (>= 0.1 NE) in all neonatal RGCs (FC > 0.25-fold, p < 0.05), ordered by adjusted p-values (shown on x-axis in −log10; determined by the R packages gprofiler2 and enrichplot), with terms in the upper rows corresponding to the most significant enrichment (indicated by the lower adjusted p-value; up to top 5 shown, and only 4 were significant for MF). Color-coded scale bar indicates GO terms’ fold-change (FC) enrichment. See methods for more details. (B) Gene-Concept Network Plot of genes associated with the top GO:BP and GO:MF terms by p-value significance. GO terms shown as gray circles (i.e., nodes), with circle size (per scale on the side) indicating the number of genes within that node. Color-coded scale bar indicates each gene’s normalized expression (NE) in neonatal RGCs (see Methods for details). Nfe2l3 and Gsk3b genes are outlined by dashed line boxes. (C-D) Line plots of Gsk3b (C) and Mtor (Mtorc1) (D) gene expression in scRNA-seq-profiled RGCs at different ages/conditions, as marked. Mean ± SEM of normalized expression (NE) values are shown (see Methods for details).
Figure 7.
Figure 7.. Experimental upregulation of Nfe2l3 does not significantly alter levels of p-S6 in injured RGCs.
(A-B) Representative confocal images of the retinal flatmounts’ ganglion cell layer horizontal sections 2 weeks after ONC injury from animals pre-treated with control AAV2 expressing mCherry reporter, immunostained for p-S6, and counterstained with DAPI (A). Inset from A shown enlarged for better visualization of subsets of mCherry+/p-S6+ and mCherry+/p-S6- RGCs (B). (C-D) Representative confocal images of the retinal flatmounts’ ganglion cell layer horizontal sections 2 weeks after ONC injury from animals pre-treated with AAV2 expressing myc-tagged Nfe2l3, immunostained for p-S6, and counterstained with DAPI (C). Inset from C shown enlarged for better visualization of subsets of Myc+/p-S6+ and Myc+/p-S6- RGCs (D). OE = Overexpression. Scale bars, 25 μm (main panels), 6.5 μm (insets). (E) Quantification of the percent of p-S6+/mCherry+ of the total mCherry+ RGCs per retina, at 2 weeks after ONC, compared to the percent of p-S6+/Myc+ of the total Myc+ RGCs per retina, did not show a significant difference between the mCherry control or Nfe2l3 transduced conditions (mean ± SEM shown, n = 3 retinas per group; *p = 0.86 by independent samples t-test, 2-tailed). N.S. = Not significant.

Similar articles

Cited by

References

    1. Sykiotis GP, Bohmann D. Stress-activated cap'n'collar transcription factors in aging and human disease. Sci Signal. Mar 09 2010;3(112):re3. doi:10.1126/scisignal.3112re3 - DOI - PMC - PubMed
    1. Liu P, Kerins MJ, Tian W, Neupane D, Zhang DD, Ooi A. Differential and overlapping targets of the transcriptional regulators NRF1, NRF2, and NRF3 in human cells. J Biol Chem. November 29 2019;294(48):18131–18149. doi:10.1074/jbc.RA119.009591 - DOI - PMC - PubMed
    1. Sankaranarayanan K, Jaiswal AK. Nrf3 negatively regulates antioxidant-response element-mediated expression and antioxidant induction of NAD(P)H:quinone oxidoreductase1 gene. J Biol Chem. Dec 03 2004;279(49):50810–7. doi:10.1074/jbc.M404984200 - DOI - PubMed
    1. Waku T, Hagiwara T, Tamura N, et al. NRF3 upregulates gene expression in SREBP2-dependent mevalonate pathway with cholesterol uptake and lipogenesis inhibition. iScience. Oct 22 2021;24(10):103180. doi:10.1016/j.isci.2021.103180 - DOI - PMC - PubMed
    1. Chowdhury AMMA, Katoh H, Hatanaka A, et al. Multiple regulatory mechanisms of the biological function of NRF3 (NFE2L3) control cancer cell proliferation. Sci Rep. October 02 2017;7(1):12494. doi:10.1038/s41598-017-12675-y - DOI - PMC - PubMed