Review
. 2024 Mar;6(3):e211-e221.
doi: 10.1016/S2589-7500(23)00250-9.

Normative modelling of brain morphometry across the lifespan with CentileBrain: algorithm benchmarking and model optimisation

Collaborators, Affiliations
Review

Normative modelling of brain morphometry across the lifespan with CentileBrain: algorithm benchmarking and model optimisation

Ruiyang Ge et al. Lancet Digit Health. 2024 Mar.

Abstract

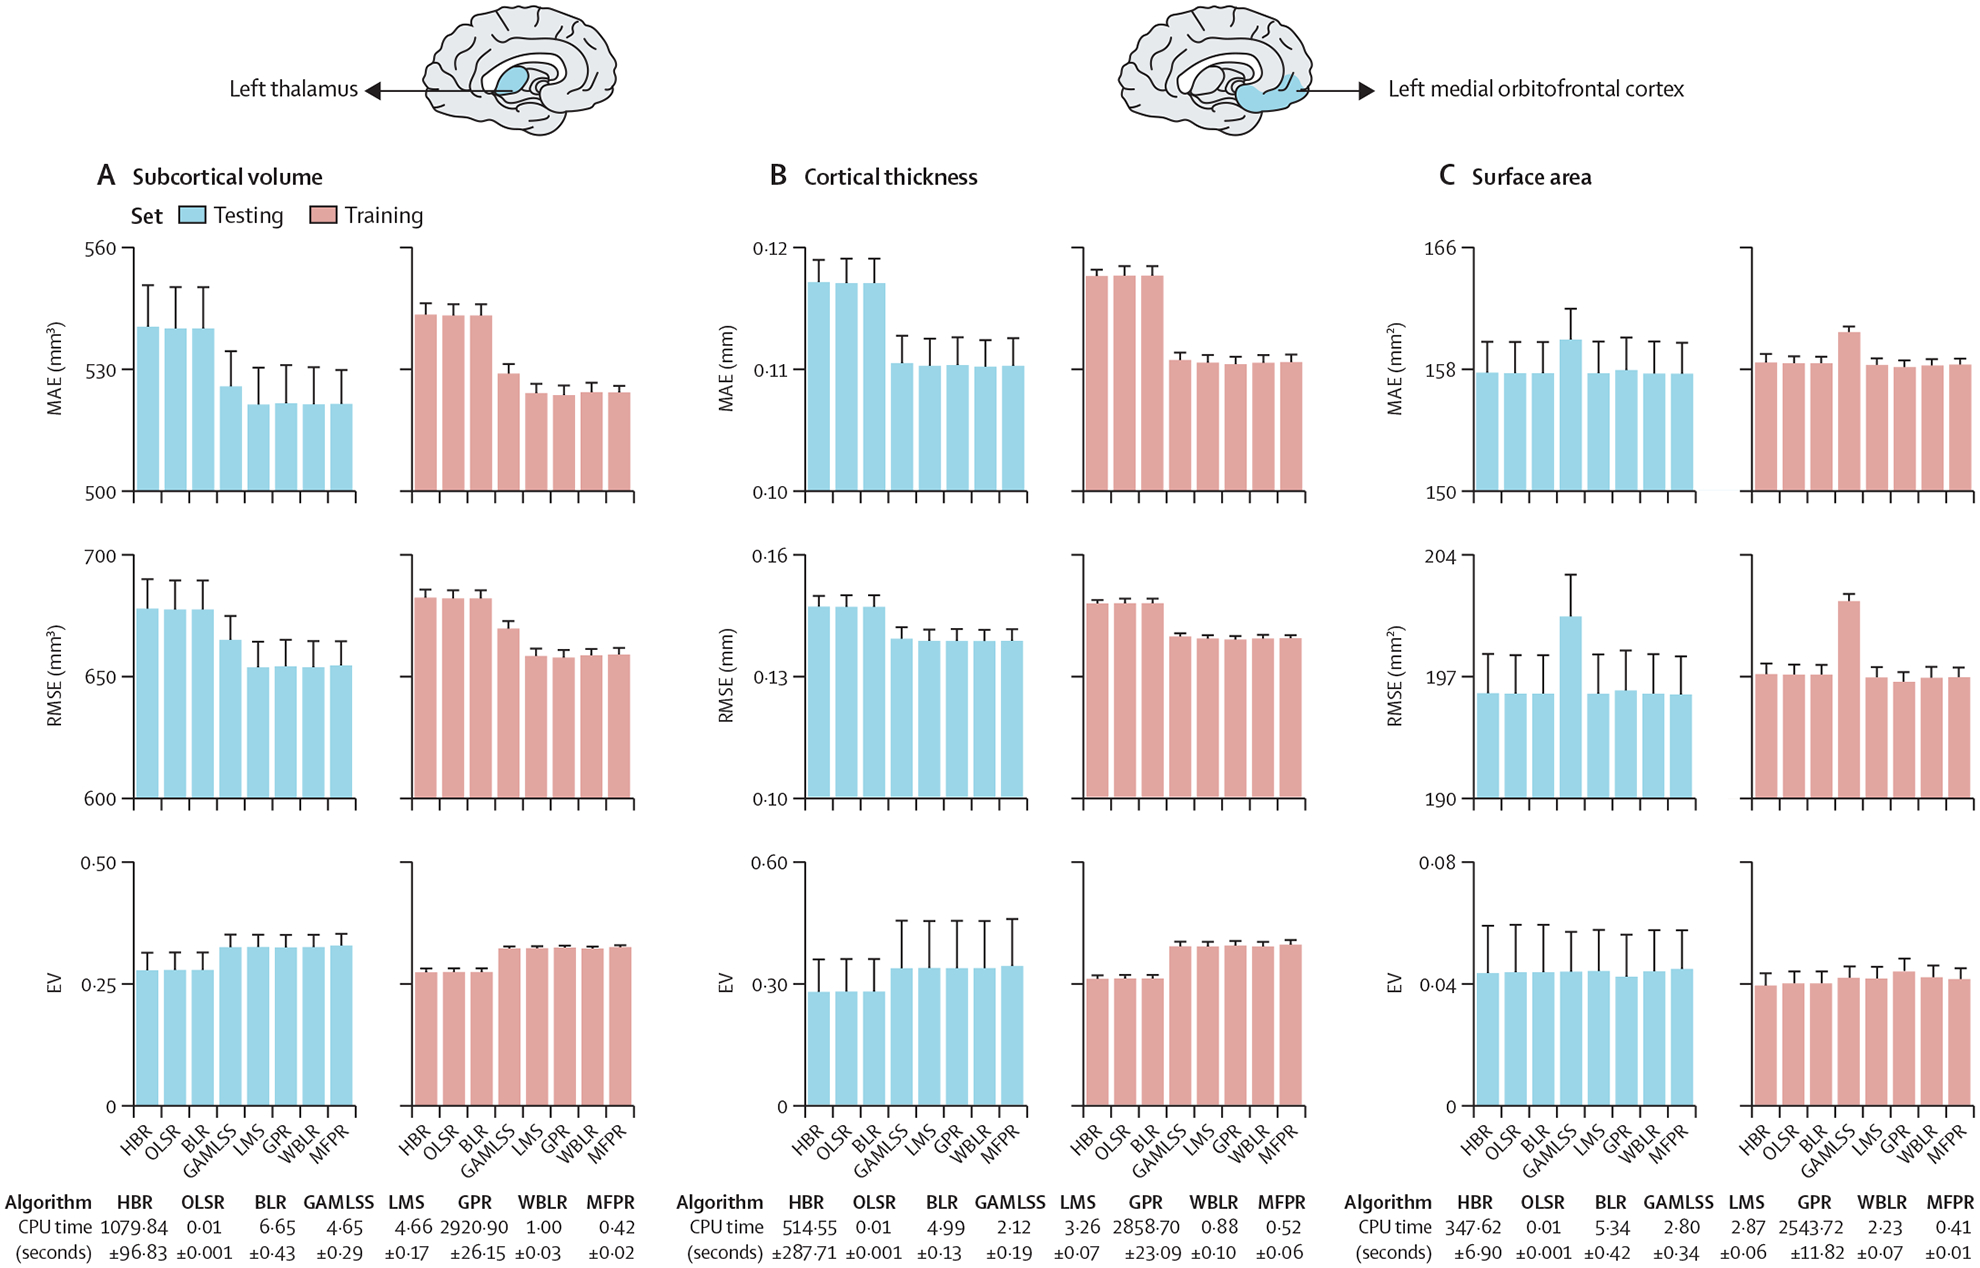
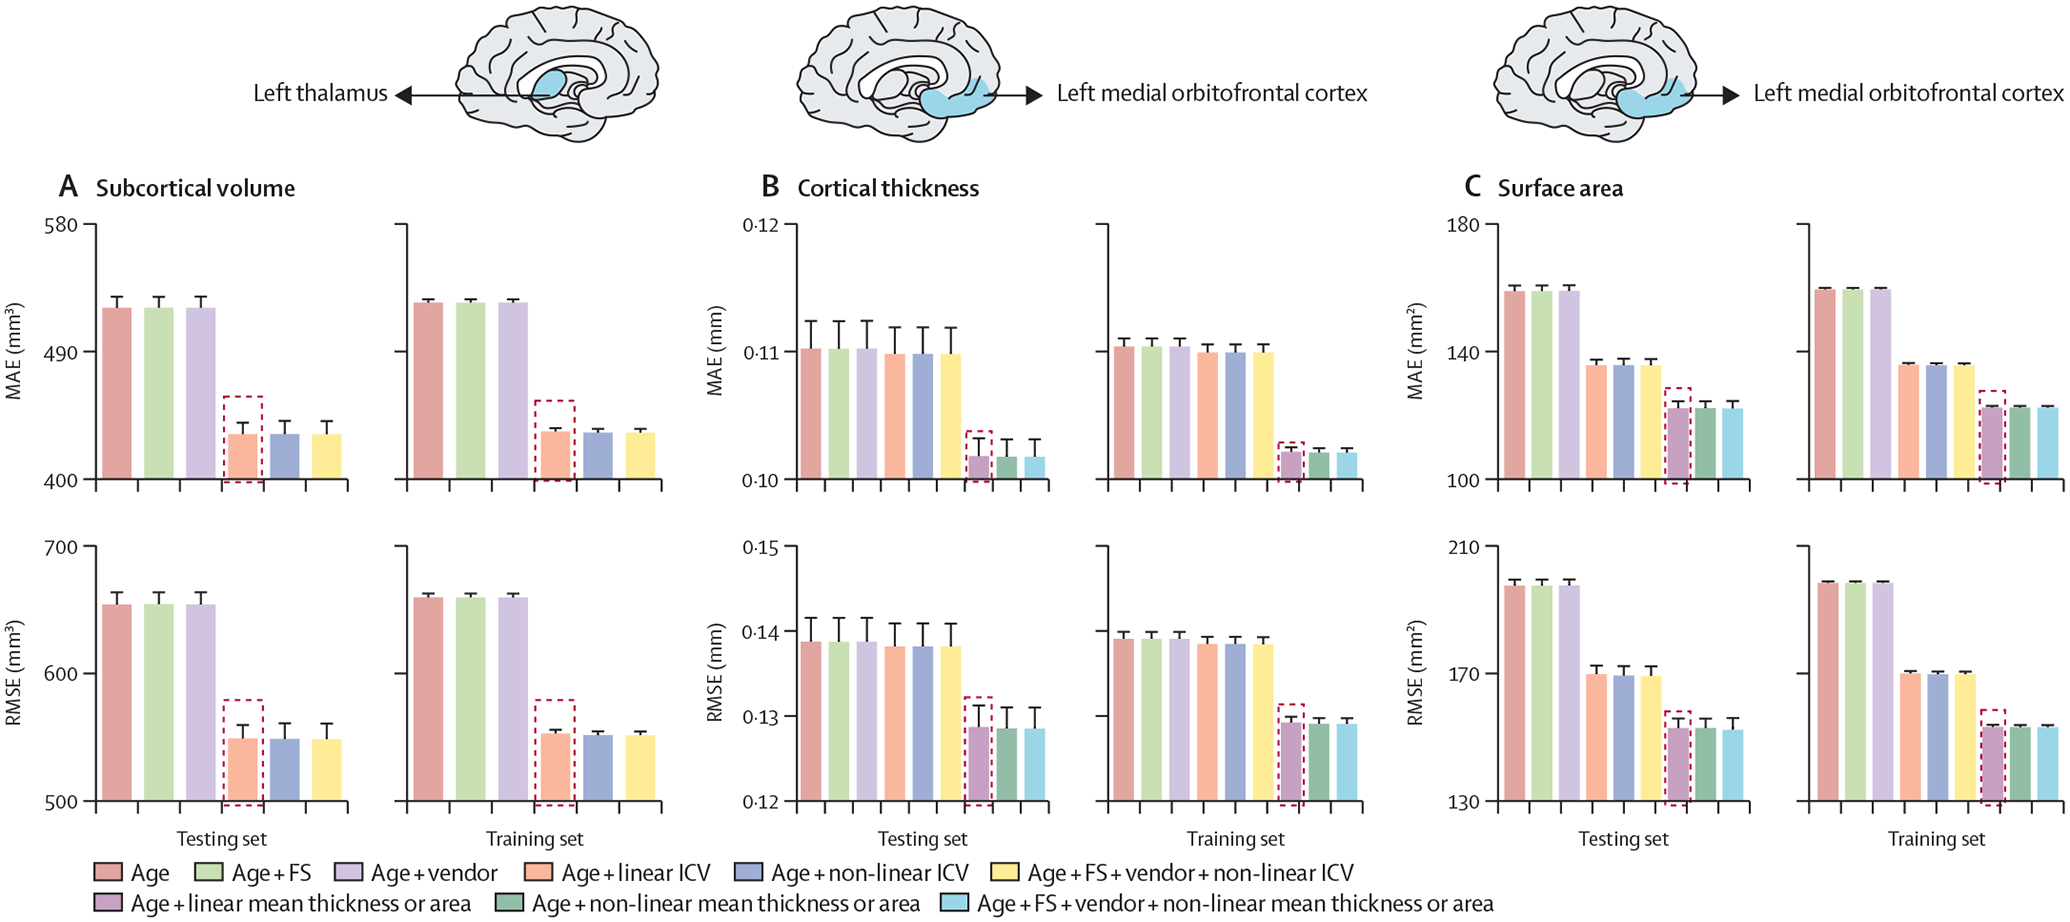
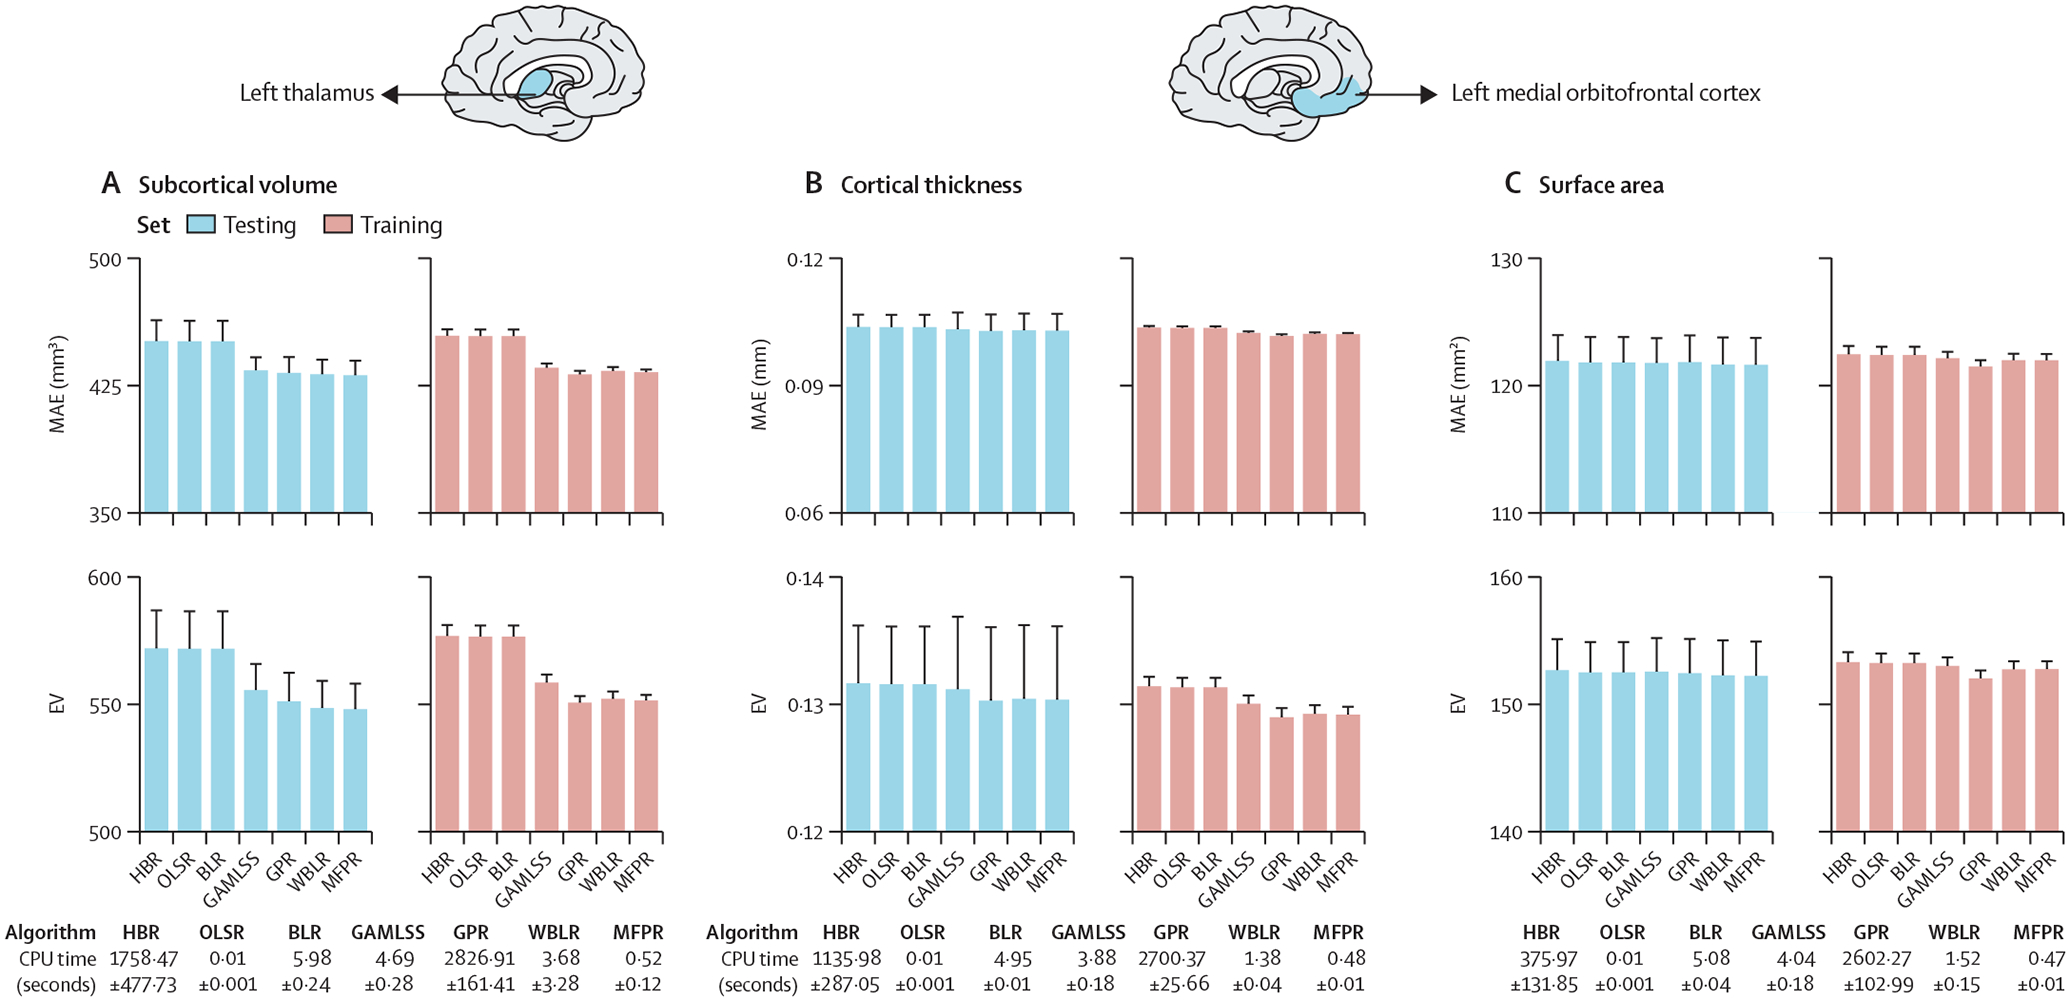
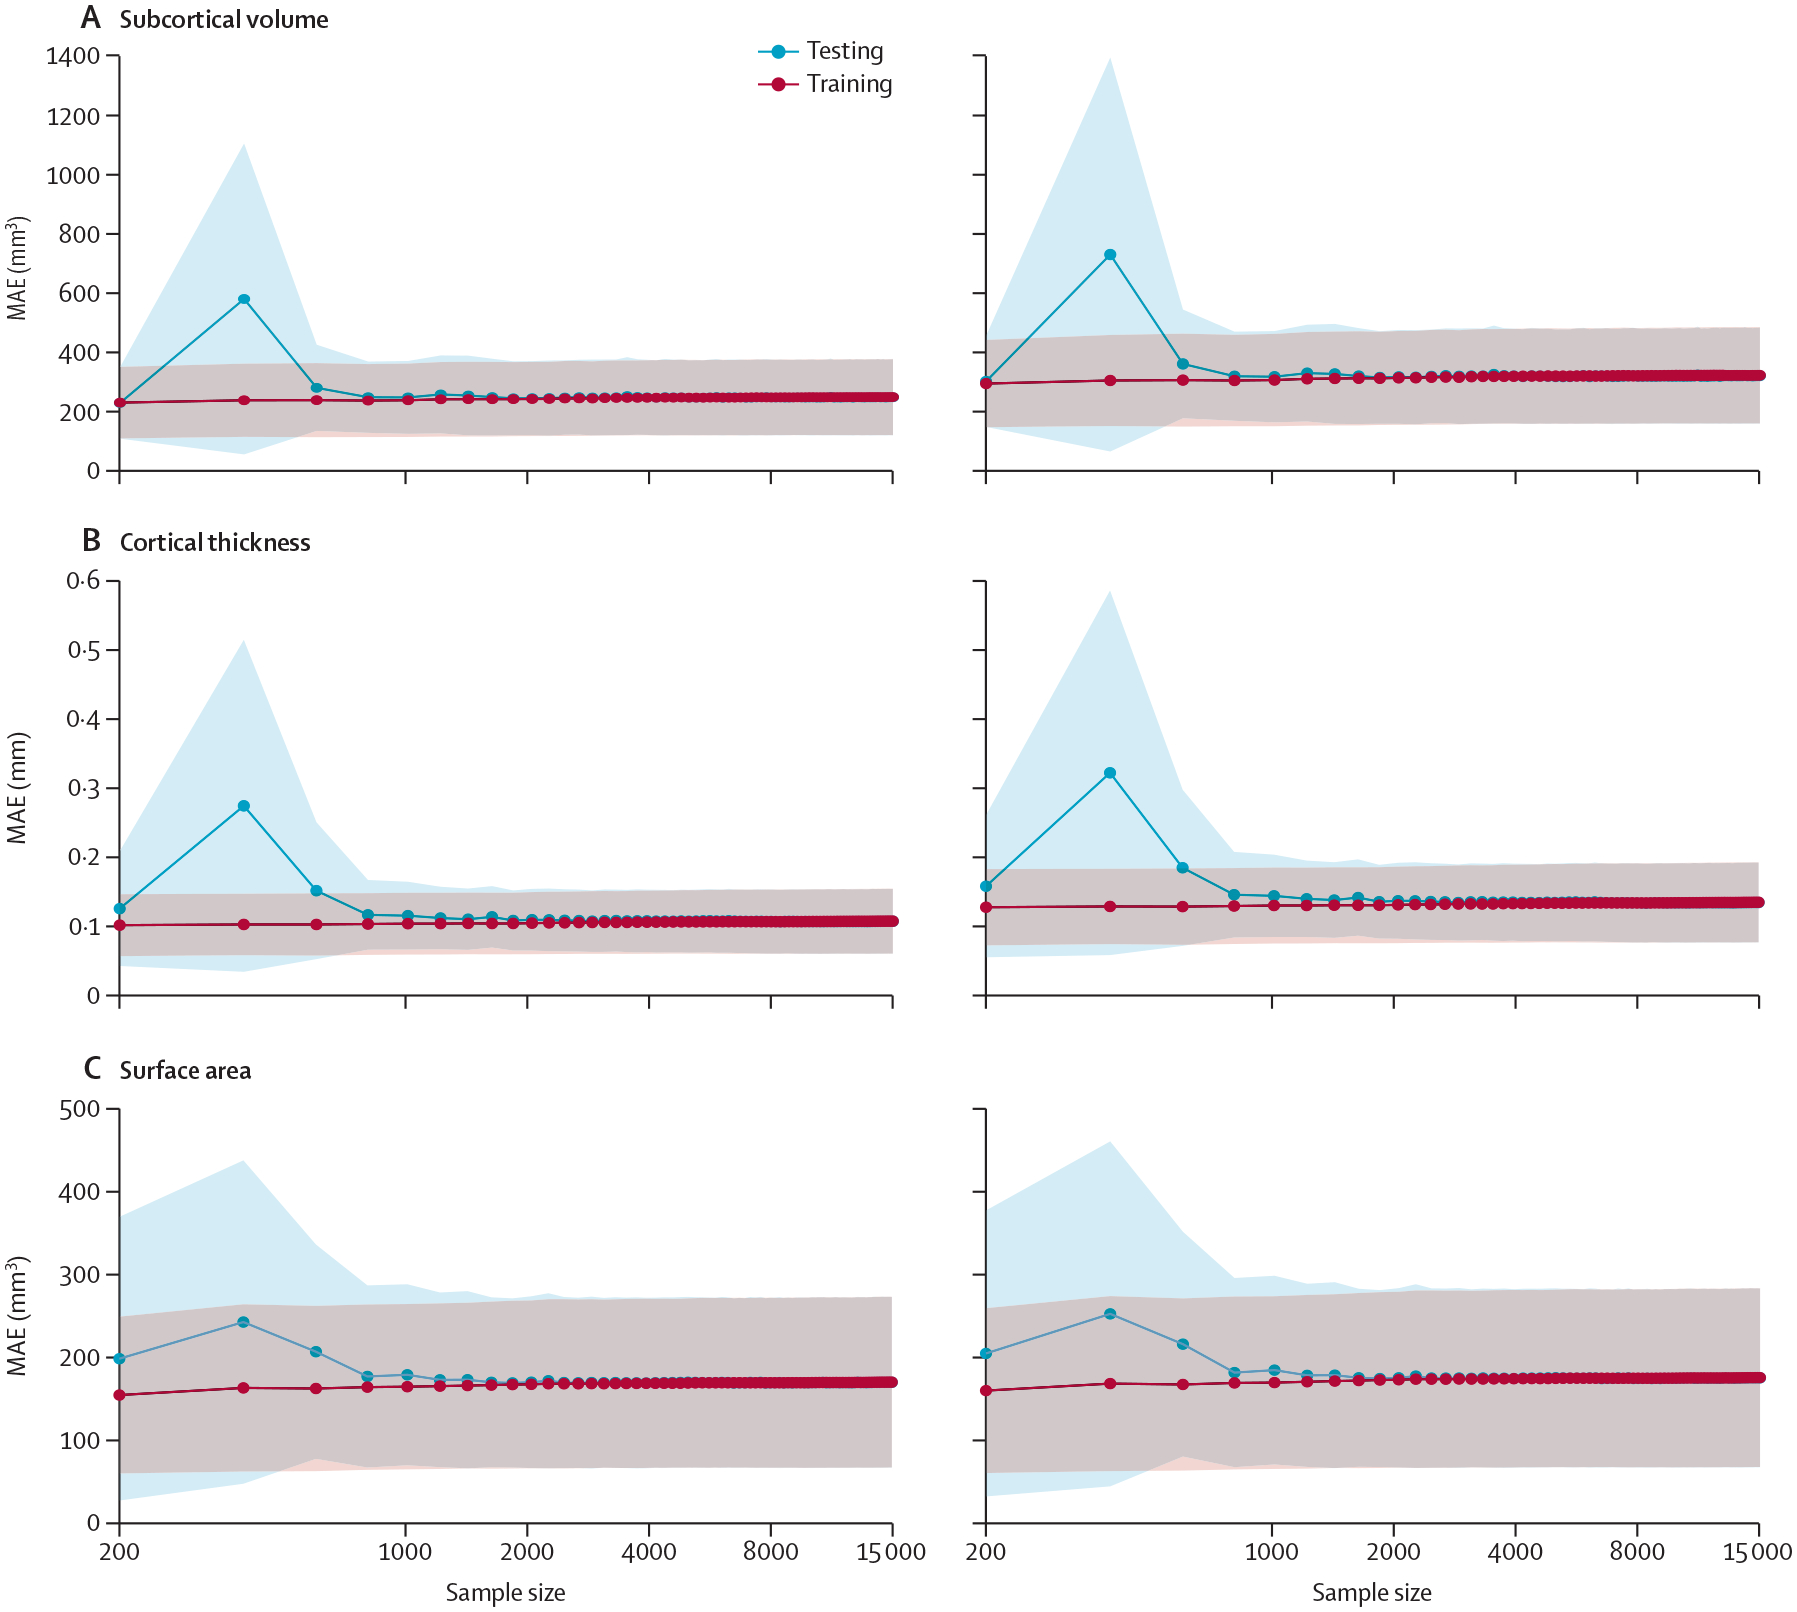
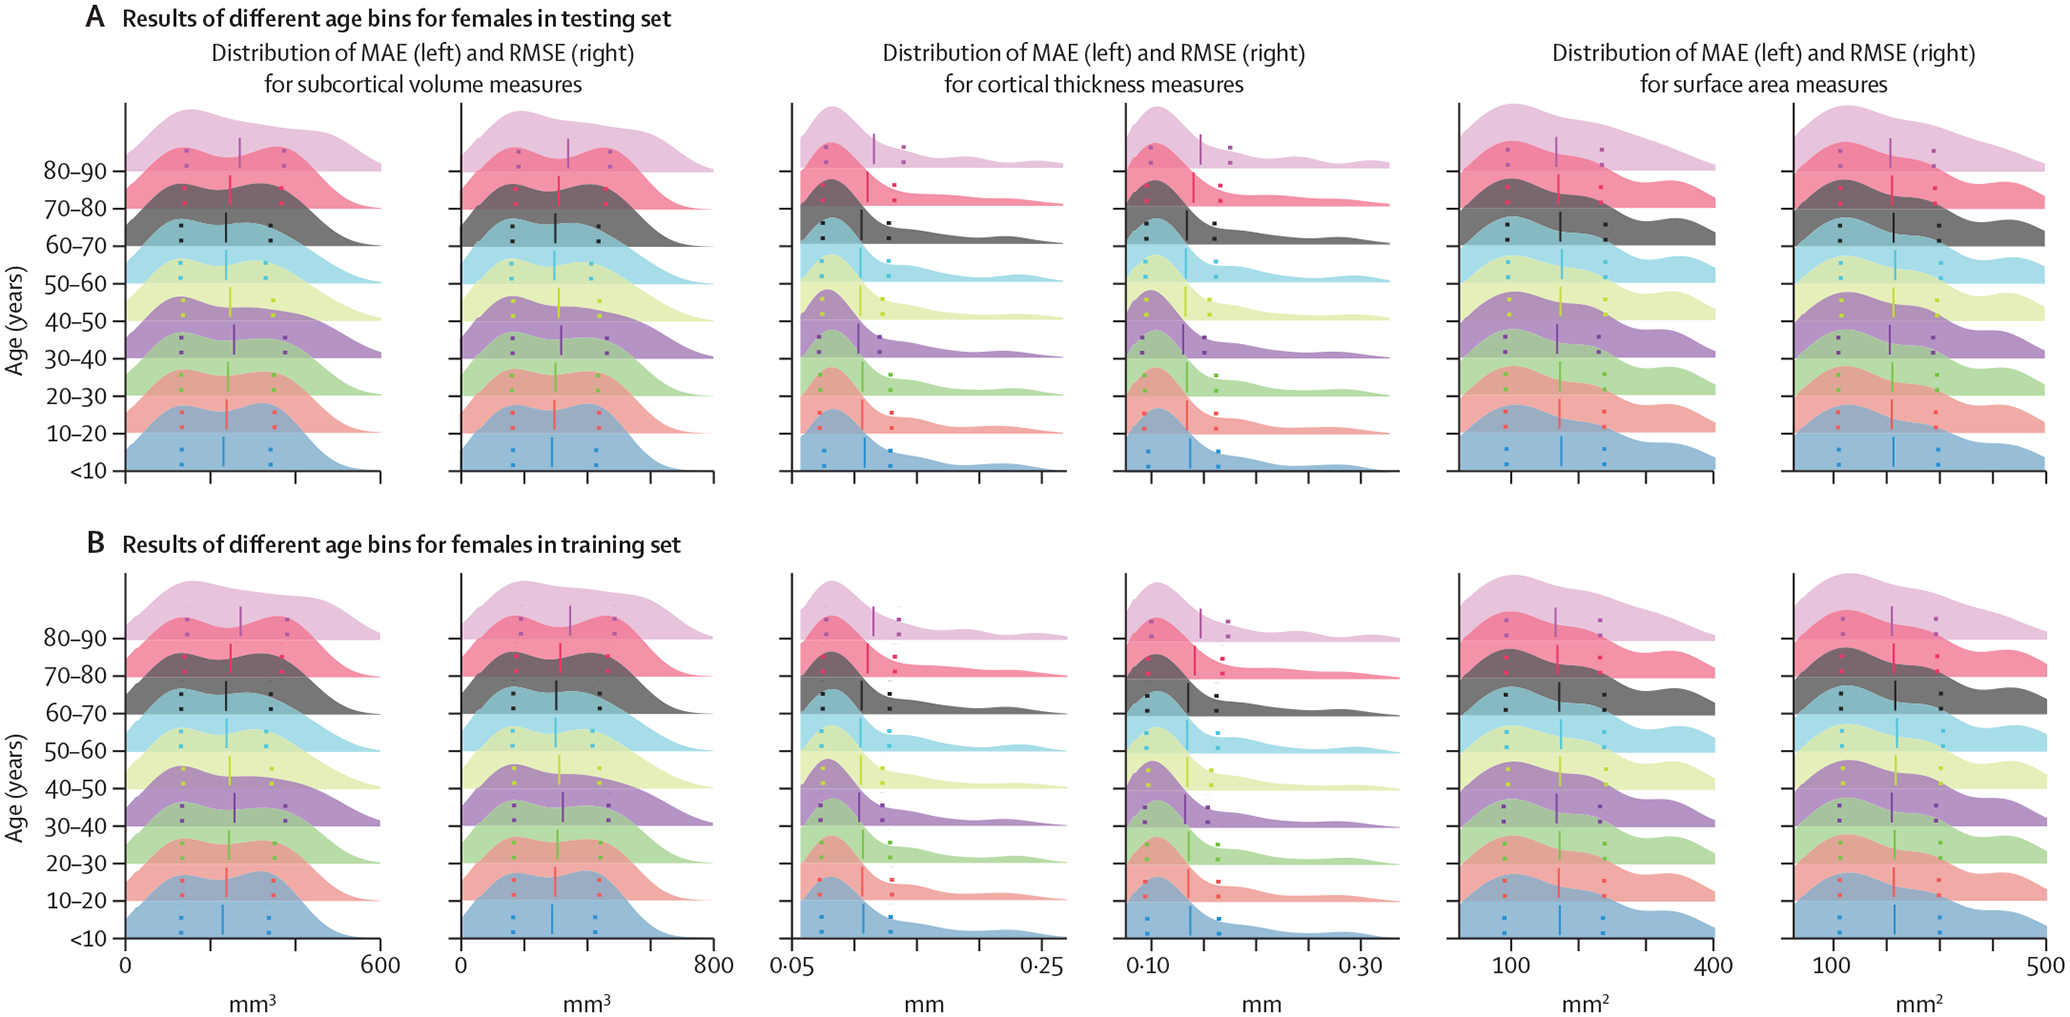
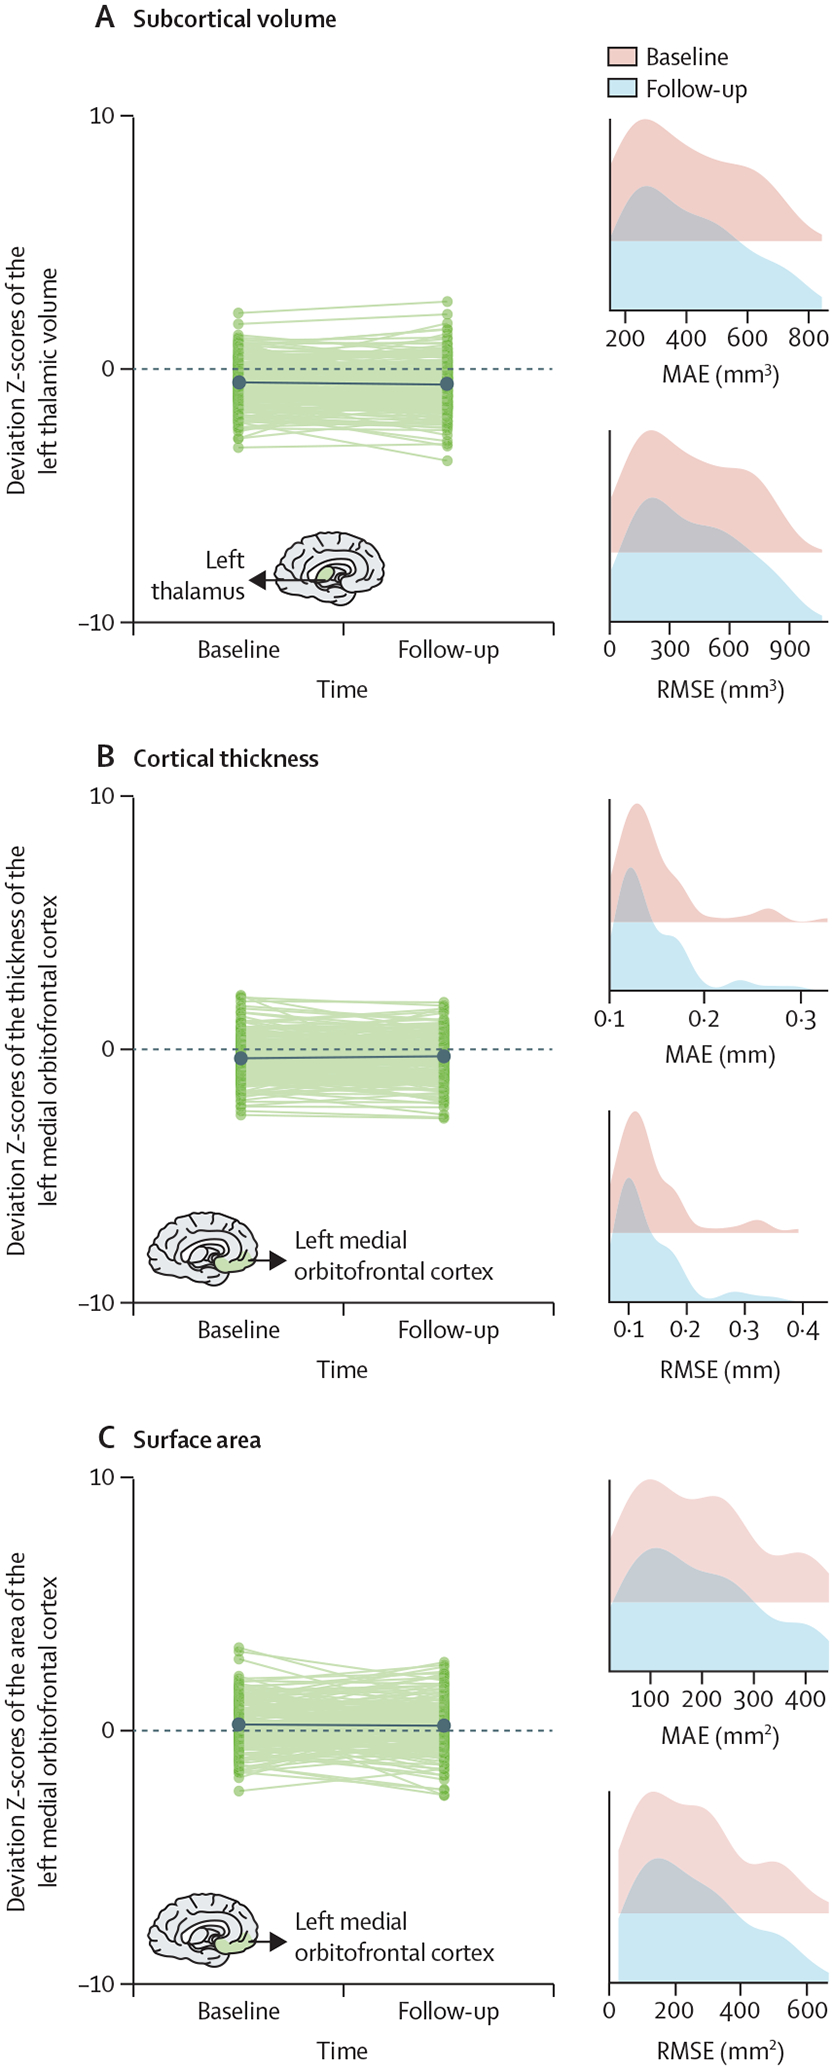
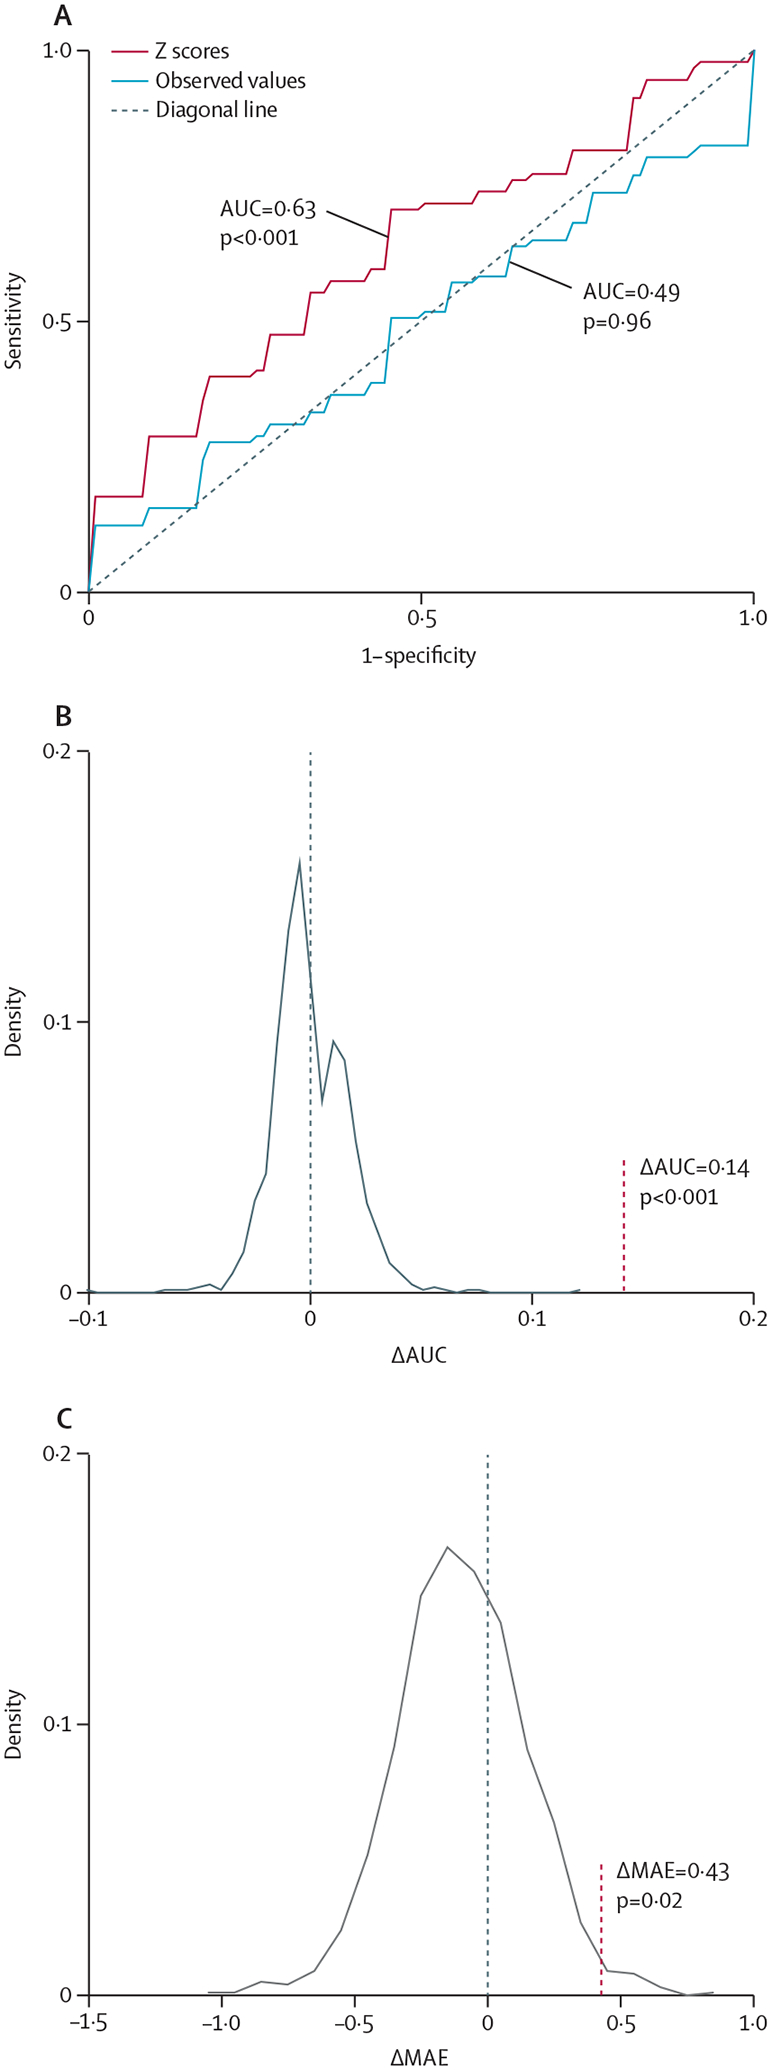
The value of normative models in research and clinical practice relies on their robustness and a systematic comparison of different modelling algorithms and parameters; however, this has not been done to date. We aimed to identify the optimal approach for normative modelling of brain morphometric data through systematic empirical benchmarking, by quantifying the accuracy of different algorithms and identifying parameters that optimised model performance. We developed this framework with regional morphometric data from 37 407 healthy individuals (53% female and 47% male; aged 3-90 years) from 87 datasets from Europe, Australia, the USA, South Africa, and east Asia following a comparative evaluation of eight algorithms and multiple covariate combinations pertaining to image acquisition and quality, parcellation software versions, global neuroimaging measures, and longitudinal stability. The multivariate fractional polynomial regression (MFPR) emerged as the preferred algorithm, optimised with non-linear polynomials for age and linear effects of global measures as covariates. The MFPR models showed excellent accuracy across the lifespan and within distinct age-bins and longitudinal stability over a 2-year period. The performance of all MFPR models plateaued at sample sizes exceeding 3000 study participants. This model can inform about the biological and behavioural implications of deviations from typical age-related neuroanatomical changes and support future study designs. The model and scripts described here are freely available through CentileBrain.


Conflict of interest statement

Declaration of interests SSH is supported by the US National Institutes of Health (NIH)'s National Institute of Mental Health (T32MH122394) and received a travel award from the Society of Biological Psychiatry to attend the annual meeting in 2023. HB declares an institutional grant from the Australian National Health and Medical Research Council; has received compensation for being on an advisory board or a consultant to Biogen, Eisai, Eli Lilly, Roche, and Skin2Neuron; payment for being on the Cranbrook Care Medical Advisory Board; and honoraria for being on the Montefiore Homes Clinical Advisory Board. RMB and HEHP declare partial funding through the Geestkracht programme of the Dutch Health Research Council (Zon-Mw, grant No 10–000–1001) and matching funds from participating pharmaceutical companies (ie, Lundbeck, AstraZeneca, Eli Lilly, and Janssen Cilag), universities (Academic Psychiatric Centre of the Academic Medical Center, University Medical Center Groningen, Maastricht University Medical Centre, and University Medical Center Utrecht), and mental health care organisations (GGZ Ingeest, Arkin, Dijk en Duin, GGZ Rivierduinen, Erasmus Medical Centre, GGZ Noord Holland Noord, Lentis, GGZ Friesland, GGZ Drenthe, Dimence, Mediant, GGNet Warnsveld, Yulius Dordrecht, Parnassia psycho-medical center The Hague, GGzE, GGZ Breburg, GGZ Oost-Brabant, Vincent van Gogh voor Geestelijke Gezondheid, Mondriaan, Virenze riagg, Zuyderland GGZ, MET GGZ, Universitair Centrum Sint-Jozef Kortenberg, CAPRI University of Antwerp, PC Ziekeren Sint-Truiden, PZ Sancta Maria Sint-Truiden, GGZ Overpelt, OPZ Rekem, Altrecht, and GGZ Centraal and Delta); and received funding from Nederlandse Organisatie voor Wetenschappelijk Onderzoek (NWO 51·02·061 to HEHP, NWO 51·02·062 to DIB, NWO–NIHC Programs of excellence 433–09–220 to HEHP, NWO-MagW 480–04–004 to DIB, and NWO/SPI 56–464–14192 to DIB), FP7 Ideas: European Research Council (ERC-230374 to DIB), and Universiteit Utrecht (High Potential Grant to HEHP). RB declares funding by the NIH's National Institute on Aging (R01AG067420); received compensation for being on the scientific advisory board from Alkermes and Cognito Therapeutics with no conflict to the present work; received honoraria from academic institutions for talks (all under $1000) and $1000 for speaking at a Massachusetts General Hospital and Harvard Medical School course; received travel fees for services to attend the annual meeting from the Simons Foundation; serves as a Director on the Simons Foundation Collaborative Initiative on Aging; is a paid scientific advisory board member for philanthropic grants for The Foundation for OCD Research and the Klarman Family Foundation. BF has received educational speaking fees from Medice. DG reports funding from the NIH. UD is funded through the German Research Foundation (DFG; DA 1151/9–1, DA 1151/10–1, DA 1151/11–1). GS declares funding from the European Commission, DFG, and National Science Foundation of China. CKT has received grants from the Research Council of Norway and the Norwegian Regional Health Authority, unrelated to the current work. HW reports funding from the German Research Foundation (WA 1539/11–1). NJ reports funding from the NIH and compensation from the International Neuropsychological Society. PMT declares a grant from the NIH and travel funded by NIH grants. All other authors declare no competing interests.

Figures

Figure 1:
Figure 1:. Flowchart of normative model optimisation
The study sample was stratified by sex and then split into training (80%) and testing (20%) datasets, followed by outlier removal, and mean-centring. Normative models were generated through eight different algorithms and compared in terms of accuracy and computational efficiency. Explanatory variables were added to identify the appropriate combination for optimal model performance.
Figure 2:
Figure 2:. Illustrative examples of comparative algorithm performance
Algorithm performance for each regional morphometric measure was assessed separately in males and females with the MAE, RMSE, EV, and CPU time. The MAE, RMSE, EV, and CPU times of the models for left thalamic volume (A), the left medial orbitofrontal cortical thickness (B), and left medial orbitofrontal cortical surface area (C) as exemplars here for females and in appendix 1 (p 4) for males. The pattern identified was the same across all region-specific models and in both sexes (appendix 1 pp 5–6). Note that scales on y axes differ between plots. BLR=Bayesian linear regression. CPU=central processing unit. EV=explained variance. GAMLSS=generalised additive models for location, scale, and shape. GPR=Gaussian process regression. HBR=hierarchical Bayesian regression. LMS=Lambda (λ), Mu (μ), Sigma (σ) method. MAE=mean absolute error. MFPR=multivariate fractional polynomial regression. OLSR=ordinary least squares regression. RMSE=root mean square error. WBLR=warped Bayesian linear regression.
Figure 3:
Figure 3:. Illustrative examples of the performance of MFPR-derived models as a function of explanatory variables
For each regional morphometric measure, sex-specific models derived from all algorithms were trained and tested using nine different covariate combinations that included effects of age, FS version, Euler’s number, scanner vendor, ICV, and global estimates of mean cortical thickness or total area. The MAE and RMSE of models for left thalamic volume (A), the left medial orbitofrontal cortical thickness (B), and left medial orbitofrontal cortical surface area (C) derived from MFPR for females are presented as exemplars; the optimal variable combination is marked with a dashed frame. The corresponding data for males are presented in appendix 1 (p 7). The data for other regions are shown in appendix 1 (pp 8–12). In both sexes, the pattern identified was identical for all region-specific models. Note that scales on y axes differ between plots. FS=FreeSurfer. ICV=intracranial volume. MAE=mean absolute error. MFPR=multivariate fractional polynomial regression. RMSE=root mean square error.
Figure 4:
Figure 4:. Illustrative examples of the comparative performance of optimised models derived from OLSR, BLR, HBR, GPR, GAMLSS, WBLR, and MFPR
Region-specific models with the optimised covariate combination were estimated in males and females separately with OLSR, BLR, HBR, GPR, GAMLSS, WBLR, and MFPR. Model performance was assessed in terms of MAE, RMSE, and CPU time. The MAE, RSME, and CPU time of the models for left thalamic volume (A), the left medial orbitofrontal cortical thickness (B), and left medial orbitofrontal cortical surface area (C) in females are presented as exemplars and in appendix 1 (p 10, figure S9) for males. Note that scales on y axes differ between plots. BLR=Bayesian linear regression. CPU=central processing unit. GAMLSS=generalised additive models for location, scale, and shape. GPR=Gaussian process regression. HBR=hierarchical Bayesian regression. MAE=mean absolute error. MFPR=multivariate fractional polynomial regression. OLSR=ordinary least squares regression. RMSE=root mean square error. WBLR=warped Bayesian linear regression.
Figure 5:
Figure 5:. Performance of region-specific MFPR-derived models as a function of sample size
Models for each regional morphometric measure were estimated in random sex-specific subsets of 200–15 000 participants, in increments of 200, generated from the study sample. Each line represents the values of the MAE or RMSE derived from the optimised MFPR models of all regional morphometric measure as a function of sample size; shadowed area represents the SD. The pattern identified was identical in both sexes. The data for females are shown here and for males in appendix 1 (p 13). Note that scales on y axes differ between plots. MAE=mean absolute error. MFPR=multivariate fractional polynomial regression. RMSE=root mean square error.
Figure 6:
Figure 6:. Performance of region-specific models in distinct age bins
Sex-specific and region-specific models of all morphometric measures for different age bins were estimated by partitioning the sex-specific training and testing subsets of the study sample into nine age bins (ie, aged ≤10 years; aged <10 years to ≤20 years; aged <20 years to ≤30 years; aged <30 years to ≤40 years; aged <40 years to ≤50 years; aged <50 years to ≤60 years; aged <60 years to ≤70 years; aged <70 years to ≤80 years; aged <80 years to ≤90 years). Details are provided in appendix 5. The figure presents the distribution of the MAE and the RMSE across all region-specific models in females in the training (A) and testing (B) subset. The pattern was identical in both sexes and the results for males are presented in appendix 1 (p 14). Note that scales on y axes differ between plots. MAE=mean absolute error. RMSE=root mean square error.
Figure 7:
Figure 7:. Stability of the normative deviation scores (Z-scores) in longitudinal neuroimaging data
We illustrate the stability of the optimised MFPR-derived models over an average interval of 2 years in data from the SLIM and QTAB study samples using the left thalamic volume (A), the left medial orbitofrontal cortical thickness (B), and surface area (C) as exemplars. Within each panel, the left-hand figure shows the Z-scores of each participant at baseline and follow-up and the right-hand figure shows the distribution of the MAE and RMSE at baseline and follow-up. Note that scales on x axes differ between plots. MAE=mean absolute error. MFPR=multivariate fractional polynomial regression. RMSE=root mean square error. SLIM=Southwest Longitudinal Imaging Multimodal Study. QTAB= Queensland Twin Adolescent Brain Study.
Figure 8:
Figure 8:. Accuracy of diagnostic classification and accuracy of psychotic symptom prediction using brain regional normative deviation scores or observed neuromorphometric data
The diagnostic classification accuracy in the HCP-EP sample (A): receiver operating characteristic curves of the models distinguishing patients from controls with the observed regional neuromorphometric measures (blue curve) or the deviation Z-scores from the normative model (red curve); the AUC difference between a support vector machine classifier using the observed regional neuromorphometric measures and another using regional normative deviation scores (Z-scores) derived from the optimised MFPR model was examined through 1000 permutations (B): the AUC difference is marked by a vertical dotted line; the predictive accuracy of psychotic symptoms in the HCP-EP sample (C): the MAE difference between a ridge regression using the observed regional neuromorphometric measures and another using Z-scores derived from the optimised MFPR model was examined through 1000 permutations, the MAE difference is marked by a vertical dotted line. Information on other models is provided in appendix 1 (p 22). Note that scales on axes differ between plots. AUC=area under the curve. HCP-EP=Human Connectome Project-Early Psychosis. MFPR=multivariate fractional polynomial regression.

Update of

  • Normative Modeling of Brain Morphometry Across the Lifespan Using CentileBrain: Algorithm Benchmarking and Model Optimization.
    Ge R, Yu Y, Qi YX, Fan YV, Chen S, Gao C, Haas SS, Modabbernia A, New F, Agartz I, Asherson P, Ayesa-Arriola R, Banaj N, Banaschewski T, Baumeister S, Bertolino A, Boomsma DI, Borgwardt S, Bourque J, Brandeis D, Breier A, Brodaty H, Brouwer RM, Buckner R, Buitelaar JK, Cannon DM, Caseras X, Cervenka S, Conrod PJ, Crespo-Facorro B, Crivello F, Crone EA, de Haan L, de Zubicaray GI, Di Giorgio A, Erk S, Fisher SE, Franke B, Frodl T, Glahn DC, Grotegerd D, Gruber O, Gruner P, Gur RE, Gur RC, Harrison BJ, Hatton SN, Hickie I, Howells FM, Hulshoff Pol HE, Huyser C, Jernigan TL, Jiang J, Joska JA, Kahn RS, Kalnin AJ, Kochan NA, Koops S, Kuntsi J, Lagopoulos J, Lazaro L, Lebedeva IS, Lochner C, Martin NG, Mazoyer B, McDonald BC, McDonald C, McMahon KL, Nakao T, Nyberg L, Piras F, Portella MJ, Qiu J, Roffman JL, Sachdev PS, Sanford N, Satterthwaite TD, Saykin AJ, Schumann G, Sellgren CM, Sim K, Smoller JW, Soares J, Sommer IE, Spalletta G, Stein DJ, Tamnes CK, Thomopolous SI, Tomyshev AS, Tordesillas-Gutiérrez D, Trollor JN, van 't Ent D, van den Heuvel OA, van Erp TG, van Haren NE, Vecchio D, Veltman DJ, Walter H, Wang Y, Weber B, Wei D, Wen W, Westlye LT, Wierenga LM, Williams SC, Wright… See abstract for full author list ➔ Ge R, et al. bioRxiv [Preprint]. 2023 Dec 2:2023.01.30.523509. doi: 10.1101/2023.01.30.523509. bioRxiv. 2023. Update in: Lancet Digit Health. 2024 Mar;6(3):e211-e221. doi: 10.1016/S2589-7500(23)00250-9. PMID: 38076938 Free PMC article. Updated. Preprint.

References

    1. Bethlehem RAI, Seidlitz J, White SR, et al. Brain charts for the human lifespan. Nature 2022; 604: 525–33. - PMC - PubMed
    1. Dima D, Modabbernia A, Papachristou E, et al. Subcortical volumes across the lifespan: data from 18,605 healthy individuals aged 3–90 years. Hum Brain Mapp 2022; 43: 452–69. - PMC - PubMed
    1. Frangou S, Modabbernia A, Williams SCR, et al. Cortical thickness across the lifespan: data from 17,075 healthy individuals aged 3–90 years. Hum Brain Mapp 2022; 43: 431–51. - PMC - PubMed
    1. Potvin O, Dieumegarde L, Duchesne S, et al. NOMIS: quantifying morphometric deviation from normality over the lifetime in the adult human brain. bioRxiv 2022; published online Feb 23. 10.1101/2021.01.25.428063 (preprint). - DOI
    1. Villalón-Reina JE, Moreau CA, Nir TM, et al. Multi-site normative modeling of diffusion tensor imaging metrics using hierarchical Bayesian regression. In: Wang L, Dou Q, Fletcher P, Speidel S, Li S, eds. Medical image computing and computer assisted intervention—MICCAI 2022. Cham: Springer, 2022: 207–17.

Publication types