. 2024 Mar 12;57(3):587-599.e4.
doi: 10.1016/j.immuni.2024.01.017. Epub 2024 Feb 22.

SARS-CoV-2-infection- and vaccine-induced antibody responses are long lasting with an initial waning phase followed by a stabilization phase

Collaborators, Affiliations

SARS-CoV-2-infection- and vaccine-induced antibody responses are long lasting with an initial waning phase followed by a stabilization phase

Komal Srivastava et al. Immunity. .

Abstract

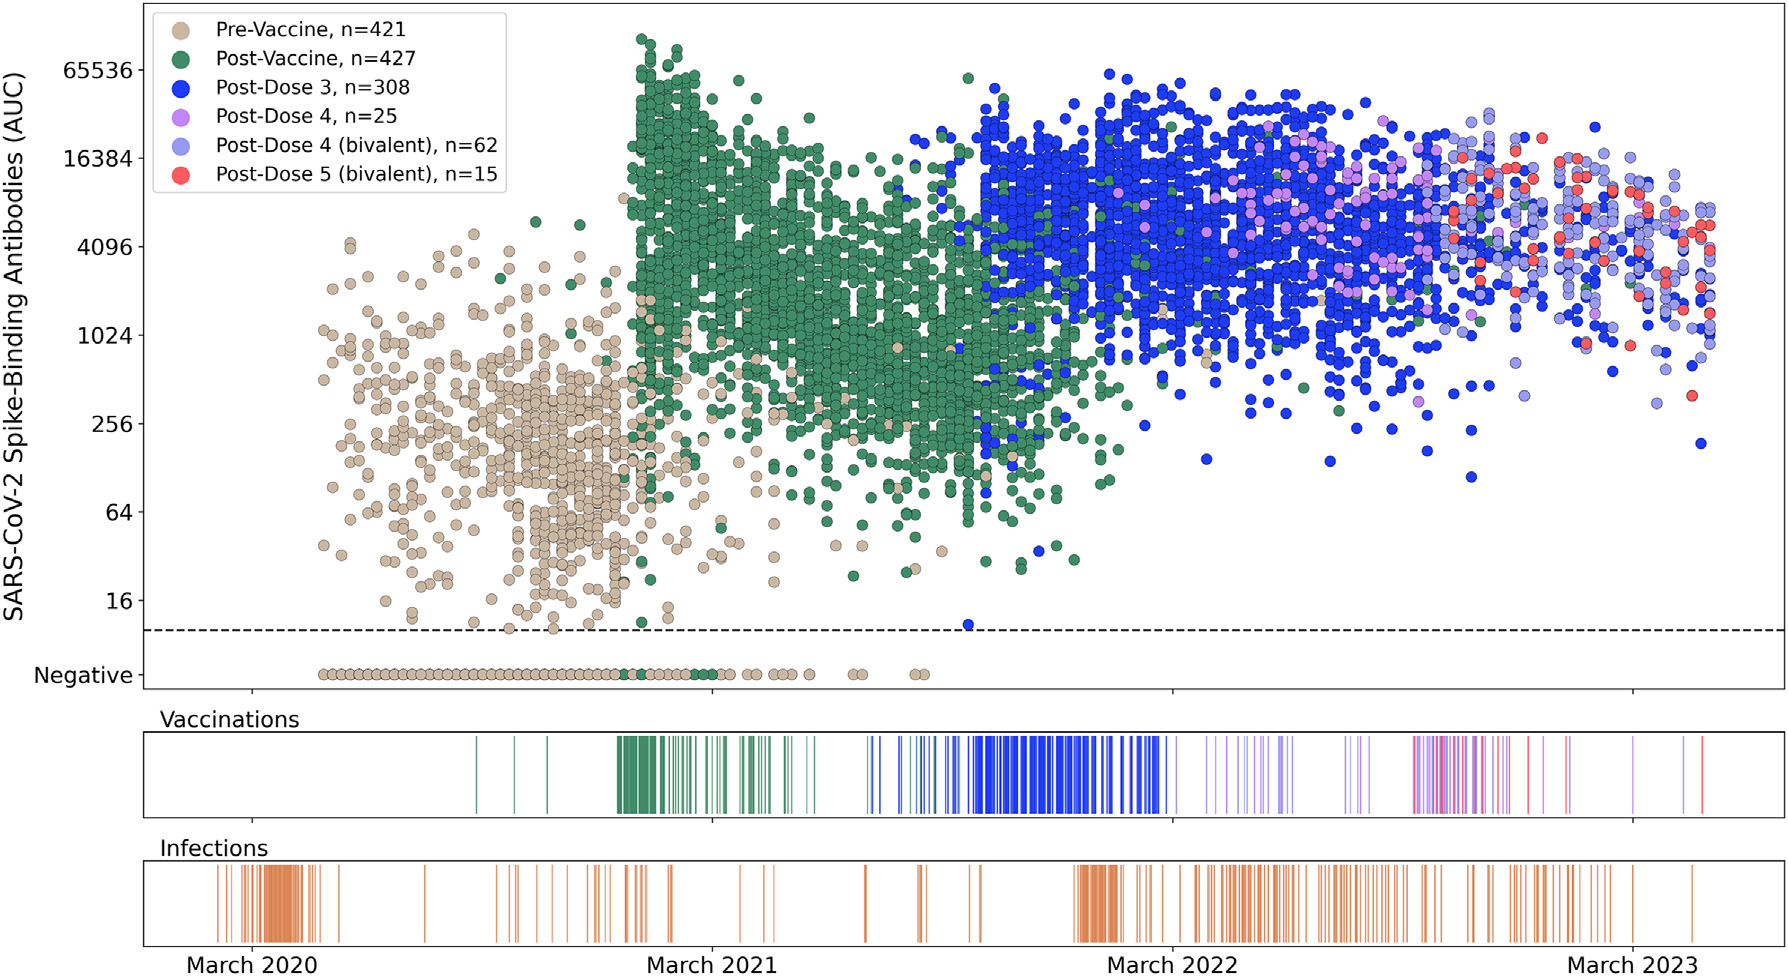
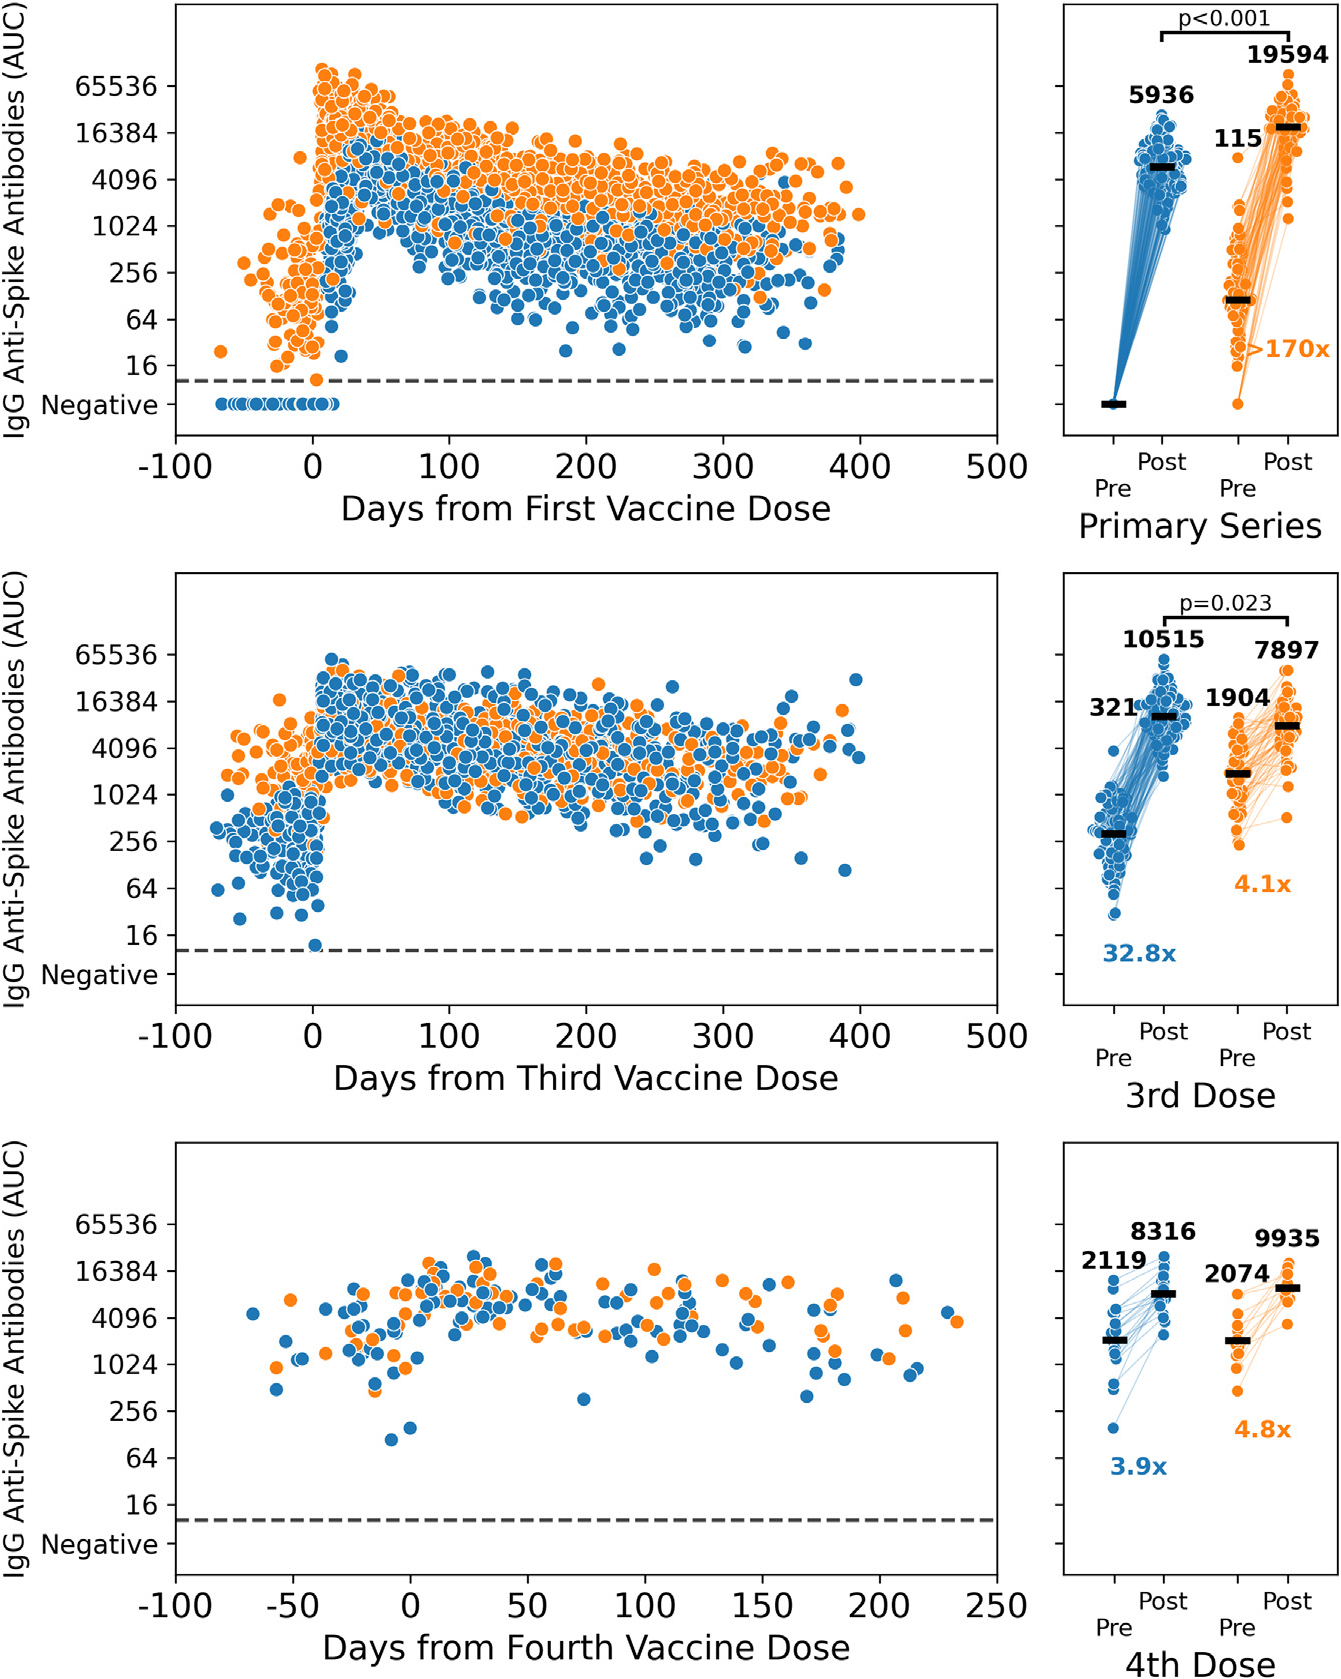
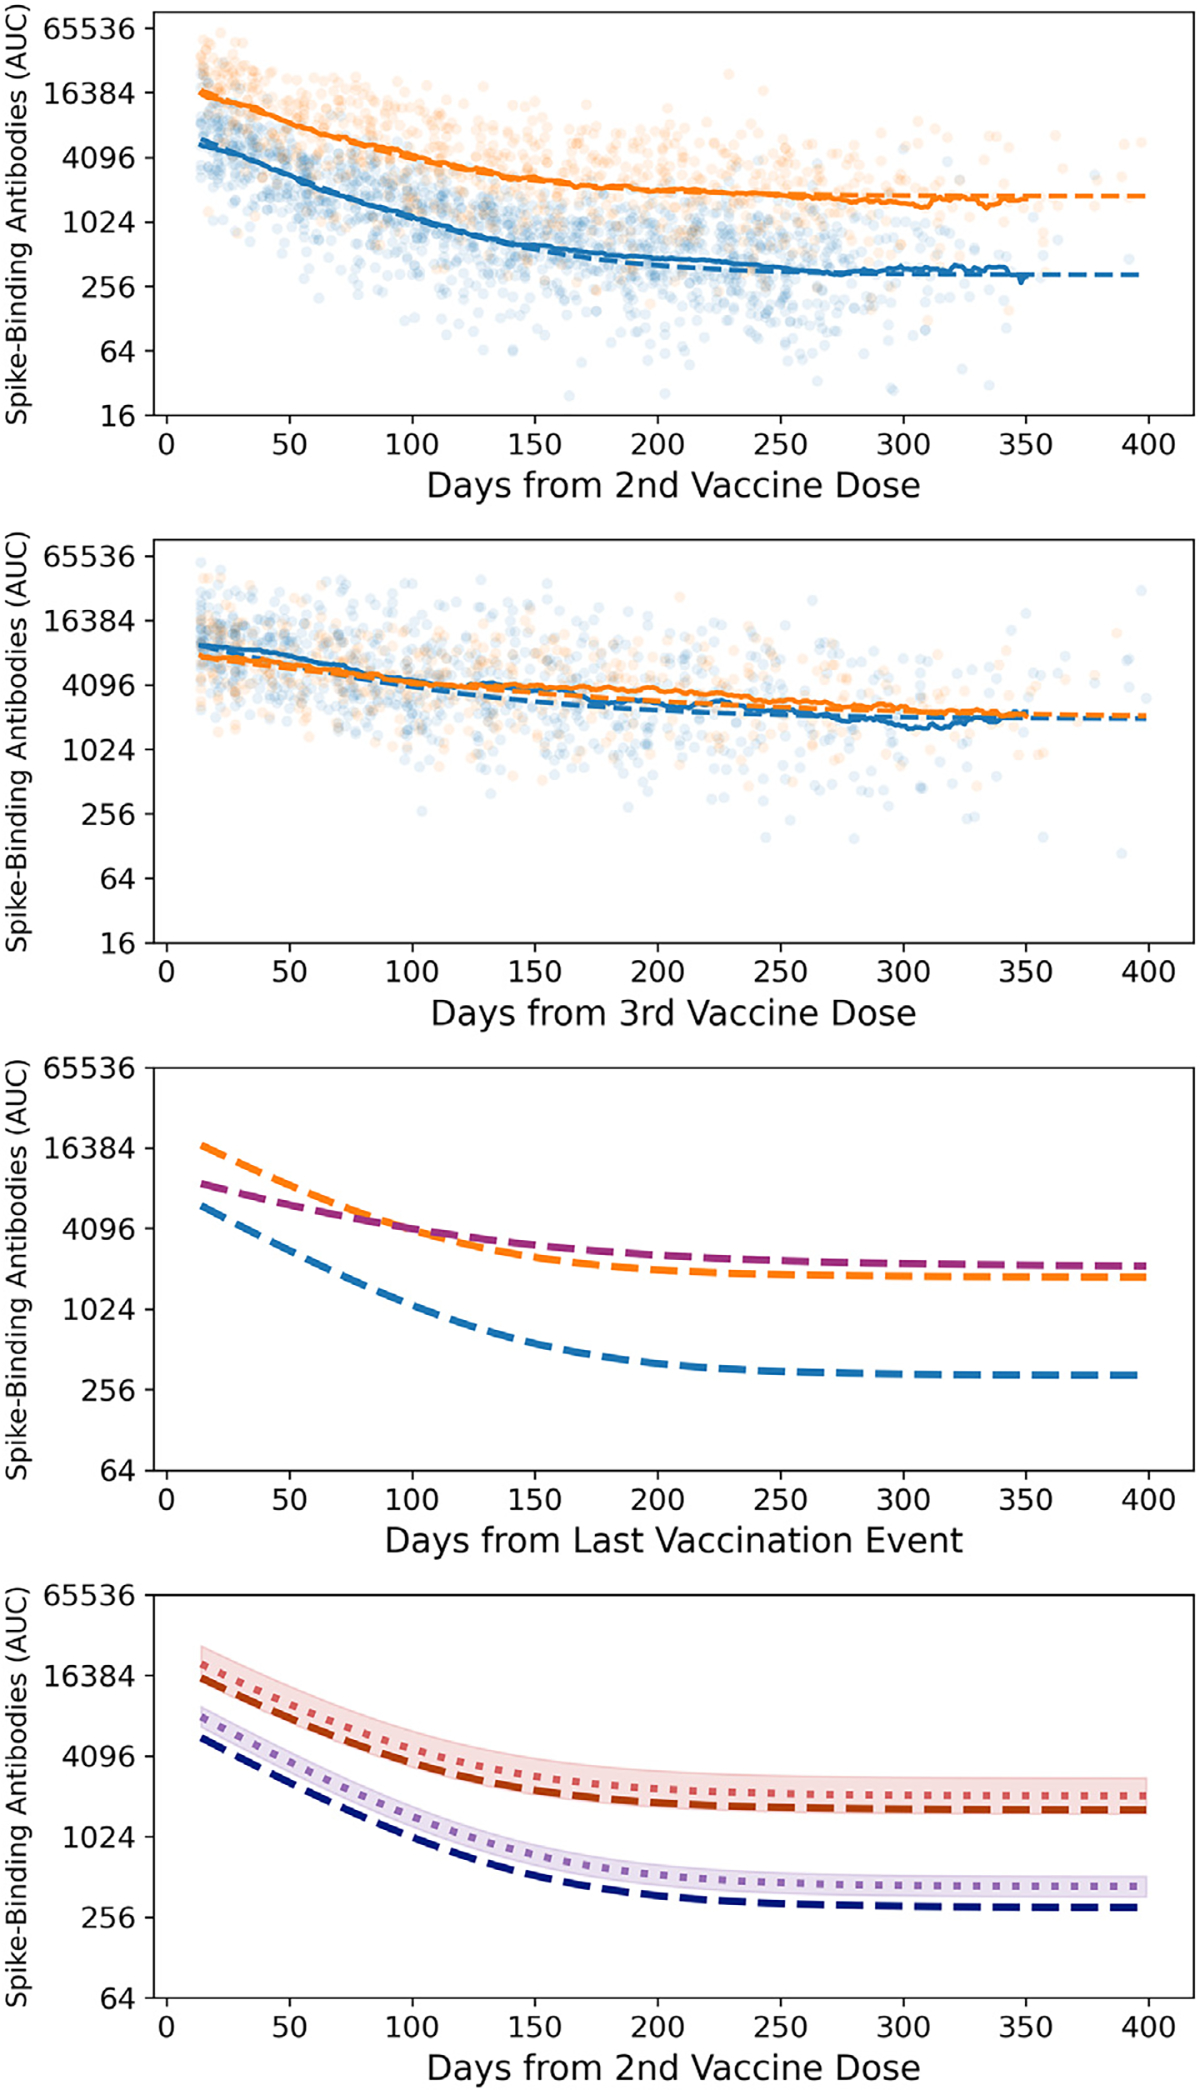
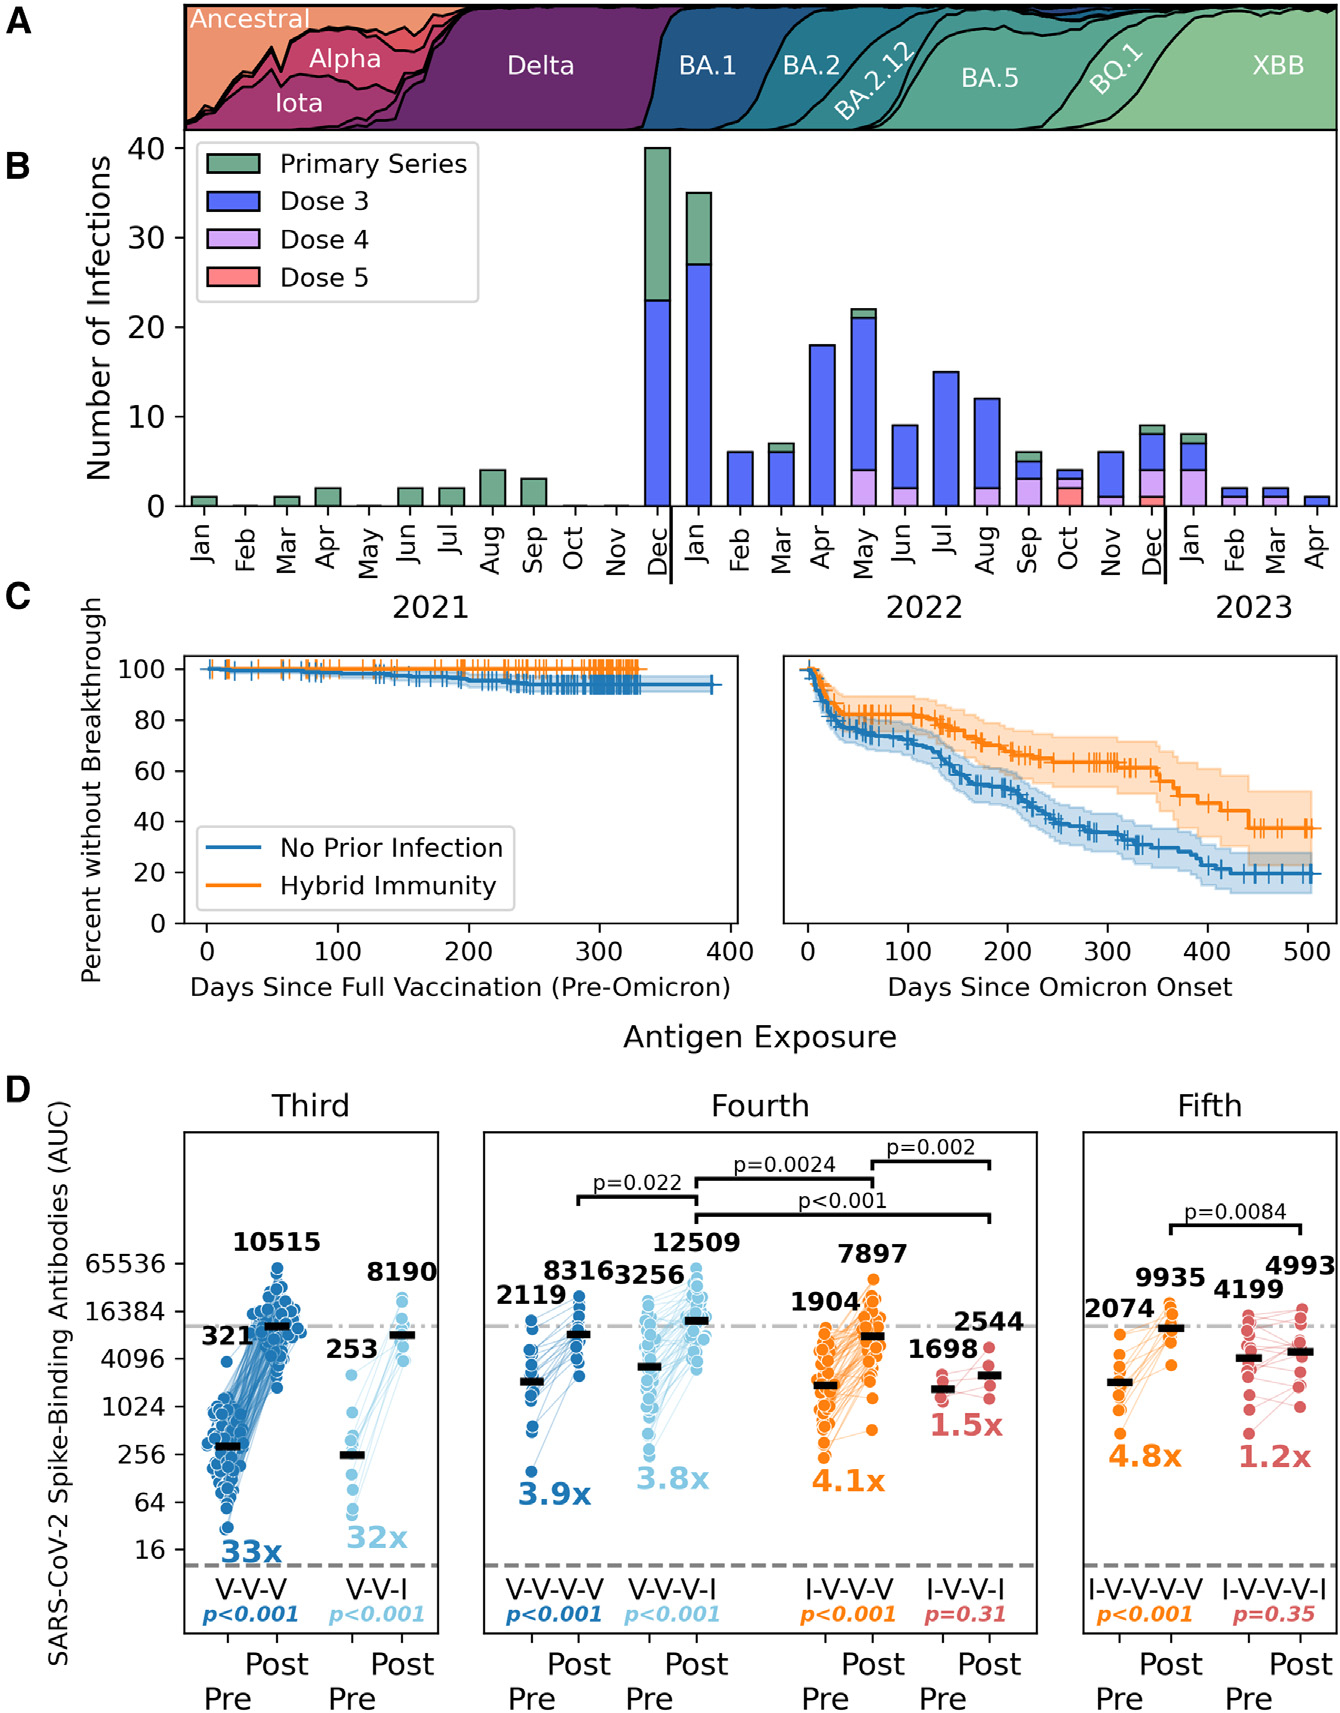
It is thought that mRNA-based vaccine-induced immunity to severe acute respiratory syndrome coronavirus 2 (SARS-CoV-2) wanes quickly, based mostly on short-term studies. Here, we analyzed the kinetics and durability of the humoral responses to SARS-CoV-2 infection and vaccination using >8,000 longitudinal samples collected over a 3-year period in New York City. Upon primary immunization, participants with pre-existing immunity mounted higher antibody responses faster and achieved higher steady-state antibody titers than naive individuals. Antibody kinetics were characterized by two phases: an initial rapid decay, followed by a stabilization phase with very slow decay. Booster vaccination equalized the differences in antibody concentration between participants with and without hybrid immunity, but the peak antibody titers decreased with each successive antigen exposure. Breakthrough infections increased antibodies to similar titers as an additional vaccine dose in naive individuals. Our study provides strong evidence that SARS-CoV-2 antibody responses are long lasting, with initial waning followed by stabilization.

Keywords: COVID-19 vaccines; SARS-CoV-2 immunity; SARS-CoV-2 variants; antibodies; breakthrough infections; durability; hybrid immunity; longitudinal study; modeling antibody kinetics; reactogenicity.


Conflict of interest statement

Declaration of interests The Icahn School of Medicine at Mount Sinai has filed patent applications relating to SARS-CoV-2 serological assays and NDV-based SARS-CoV-2 vaccines that list F.K. as co-inventor. V.S. is also listed on the SARS-CoV-2 serological assays patent. Mount Sinai has spun out a company, Kantaro, to market serological tests for SARS-CoV-2. F.K. has consulted for CureVac, Merck, and Pfizer, and is currently consulting for 3rd Rock Ventures, GSK, Gritstone, and Avimex, and he is a co-founder and scientific advisory board member of CastleVax. The Krammer laboratory is also collaborating with Pfizer on animal models of SARS-CoV-2.

Figures

Figure 1.
Figure 1.. Longitudinal SARS-CoV-2 spike-binding antibody titers in 496 PARIS participants over 3 years provide personalized immune histories
(A) Each dot represents a distinct study visit at which spike-binding antibody titers were measured. Samples are colored by prior vaccination status (2,091 samples pre-vaccination, 3,180 samples post-primary immunization [dose 1 and dose 2], 2,364 samples post-dose 3, 110 samples post-monovalent dose 4, 240 samples post-bivalent dose 4, and 56 samples post-bivalent dose 5). Each SARS-CoV-2 antibody titer measurement (AUC, area under the curve) is anchored on the Monday of the corresponding week. A small amount of normally distributed noise has been added to the log2-transformed data (σ = 0.1), with >95% of transformed values within 15% of the original value to preserve participants’ confidentiality. (B and C) SARS-CoV-2 infections (B) and vaccinations (C) events are depicted on the same timeline as the antibody values. Three participants received their primary immunization as part of the Pfizer vaccine trials. The vaccination event colors in the ribbon graph correspond to colors of points after the respective event in the antibody scatterplot shown in (A). See also Figure S1.
Figure 2.
Figure 2.. Immunogenicity of the different SARS-CoV-2 vaccine doses is dependent upon infection history prior to primary immunization
Longitudinal spike-binding antibodies measurements (n = 4,620) for PARIS participants with (orange) or without (blue) pre-existing SARS-CoV-2 immunity. (A) Longitudinal antibody follow-up post-vaccination for 179 participants with no prior SARS-CoV-2 infection (blue, 1,671 samples) and 111 participants with a pre-vaccine SARS-CoV-2 infection (orange, 1,083 samples). The right panel has matched pre- and post-vaccine time points for 150 previously naive participants and 92 participants with hybrid immunity. (B) Longitudinal antibody follow-up pre- and post-3rd dose for participants with (83 participants, 585 samples) and without (160 participants, 1,106 samples) prior SARS-CoV-2 infection. The right panel has matched pre- and post-3rd dose time points for 64 participants with prior infection and 126 participants without hybrid immunity. (C) Longitudinal antibody follow-up before and after the 4th vaccine dose is shown for 15 participants with SARS-CoV-2 infection prior to 4th dose (67 samples) and 26 participants without hybrid immunity (108 samples). The right panel has matched pre- and post-4th dose time points for 13 participants with prior infection and 21 participants without hybrid immunity. Time points post-breakthrough infection were excluded from the analysis. Pre-vaccination time points were collected within 10 weeks prior to vaccination, whereas peak post-vaccine time points were 1–5 weeks after administration of the vaccine dose (the 2nd dose, in the case of the primary series). The increase in spike-binding antibodies post-vaccination was statistically significant for all recipients (p < 0.0001, Wilcoxon signed rank). Peak antibody titers post-primary vaccination were higher in the hybrid immunity group (p < 0.0001, Mann-Whitney U) compared with the vaccine-only immunity group. After 3rd dose, peak antibody titers were modestly elevated in the vaccination-only immunity group compared with those in the hybrid immunity group (p = 0.023, Mann-Whitney U). Peak antibody titers post-dose 4 were comparable between groups). See also Figure S2.
Figure 3.
Figure 3.. Modeling antibody kinetics after primary and booster vaccinations show an initial decay followed by a stabilization phase
(A) We generated independent model predictions for the longitudinal post-vaccination antibody titers in 359 participants with (orange dashed line, 126 participants, 850 samples) and without (blue dashed line, 233 participants, 1,443 samples) SARS-CoV-2 infection prior to primary immunization. The rolling 49-day geometric means for each group are shown as solid lines. (B) We fitted the same model to the longitudinal post-boost antibody titers of 223 participants (80 participants with hybrid immunity, 482 samples; 143 vaccine-only participants, 844 samples). The rolling 49-day geometric means for each group are shown as solid lines. (C) The model estimates for the dynamics predicted by the post-vaccine model stratified by infection status shown in (A) to a combined post-boost model in dark pink (223 participants, 1,326 samples). (D) The impact of vaccine type on antibody titers, with the fixed effect due to vaccine type separating model predictions for Pfizer recipients (dark blue and dark red dashed lines) and those for Moderna recipients (purple and red dotted lines). 95% confidence intervals of the fixed effect size are represented by the shaded area. Time points after breakthrough infections were excluded from the analysis. 95% confidence intervals are based on a T distribution with standard deviations calculated as part of the model fitting procedure. The vaccine type had a statistically significant effect in participants with vaccine-only immunity (67% increase, p < 0.001). See also Figures S3 and S4 and Tables S1 and S2.
Figure 4.
Figure 4.. Hybrid immunity provides protection from infection with pre-Omicron variants and determines responses to subsequent vaccine doses and/or breakthrough infections
(A) The changing SARS-CoV-2 variant landscape in New York City is depicted for the period spanning January 2021 to April 2023. (B) The number of breakthrough infections in vaccinated PARIS participants is shown by calendar month (2021–2023). The number of vaccine doses that participants with breakthrough infections received prior to infection is identified by the different colors. (C) The frequency of breakthrough infections changed after the emergence of Omicron variants in mid-December 2021. Participants with hybrid immunity were only experiencing breakthrough infections with antigenically diverse Omicron variants (right panel). The differences between vaccinated participants with and without hybrid immunity before (left) and after (right) the appearance of Omicron variants is captured by Kaplan-Meier plots. (D) The impact of infection and vaccination on spike-binding antibody titers is shown. Vaccination events are shown in blue and orange, with infection events shown in light blue and red. Participants are categorized by number of prior exposures and SARS-CoV-2 infection status prior to initial immunization. Second breakthrough infections are excluded. 3rd dose (dark blue, n = 126) is compared with post-vaccine break-through (light blue, n= 12). 4th dose (dark blue, n = 21) is paired with the breakthrough post-3rd dose (light blue, n = 54). 3rd dose in previously infected participants (orange, n = 64) is paired with breakthrough re-infection post-vaccine (red, n = 5). Finally, antibody titers mounted in response to the 4th dose in previously infected participants (orange, n = 13) are compared those mounted after breakthrough re-infections after the 3rd dose (red, n = 17). Statistical comparisons within groups (Wilcoxon signed rank test) and fold change in geometric means are reported below each group. Statistically significant differences in post-exposure antibodies at the p < 0.05 level (Mann-Whitney U test) are reported.
Figure 5.
Figure 5.. Hybrid immunity modulates the reactogenicity of sequential SARS-CoV-2 vaccination (doses 1, 2, and 3)
(A and B) Each line represents the post vaccine side effects reported by the same participant. Data shown are based on 684 surveys completed by 228 participants (160 initially naive [70%] in A and 68 with hybrid immunity [30%] in B) after the 1st, 2nd, and 3rd vaccine dose. The order of the symptoms depicted is divided into side effects at the local injection site (pain [1], erythema [2], induration [3], lymphadenopathy [4], gray bands) and systemic in nature (fatigue [5], headache [6], myalgia [7], chills [8], arthralgia [9], fever [10], nausea/emesis [11], pharyngitis [12], dark gray background). Participants are split into groups based on pre-vaccine infection status and ordered by UPGMA clustering based on the Jaccard metric with optimal leaf ordering (trees shown on the left, colored clusters contain all nodes at distance less than 0.7). The presence of a symptom is indicated by a light blue bar. Bar plots for the overall frequency of each symptom are shown above the longitudinal data for each group. Vaccine type, boost type, infection status, and gender for each participant are annotated on the right. See also Figure S5 and Tables S3 and S4.

References

    1. Carreño JM, Alshammary H, Tcheou J, Singh G, Raskin AJ, Kawabata H, Sominsky LA, Clark JJ, Adelsberg DC, Bielak DA, et al. (2022). Activity of convalescent and vaccine serum against SARS-CoV-2 Omicron. Nature 602, 682–688. - PubMed
    1. Menegale F, Manica M, Zardini A, Guzzetta G, Marziano V, d’Andrea V, Trentini F, Ajelli M, Poletti P, and Merler S (2023). Evaluation of waning of SARS-CoV-2 vaccine-induced immunity: A systematic review and meta-analysis. JAMA Netw. Open 6, e2310650. - PMC - PubMed
    1. Zaeck LM, GeurtsvanKessel CH, and de Vries RD (2023). COVID-19 vaccine effectiveness and evolving variants: understanding the immunological footprint. Lancet Respir. Med. 11, 395–396. - PMC - PubMed
    1. DeGrace MM, Ghedin E, Frieman MB, Krammer F, Grifoni A, Alisoltani A, Alter G, Amara RR, Baric RS, Barouch DH, et al. (2022). Defining the risk of SARS-CoV-2 variants on immune protection. Nature 605, 640–652. - PMC - PubMed
    1. Feikin DR, Higdon MM, Abu-Raddad LJ, Andrews N, Araos R, Goldberg Y, Groome MJ, Huppert A, O’Brien KL, Smith PG, et al. (2022). Duration of effectiveness of vaccines against SARS-CoV-2 infection and COVID-19 disease: results of a systematic review and meta-regression. Lancet 399, 924–944. - PMC - PubMed

Publication types