

Investigating sources of non-response bias in a population-based seroprevalence study of vaccine-preventable diseases in the Netherlands
- PMID: 38395775
- PMCID: PMC10885624
- DOI: 10.1186/s12879-024-09095-5
Investigating sources of non-response bias in a population-based seroprevalence study of vaccine-preventable diseases in the Netherlands
Abstract
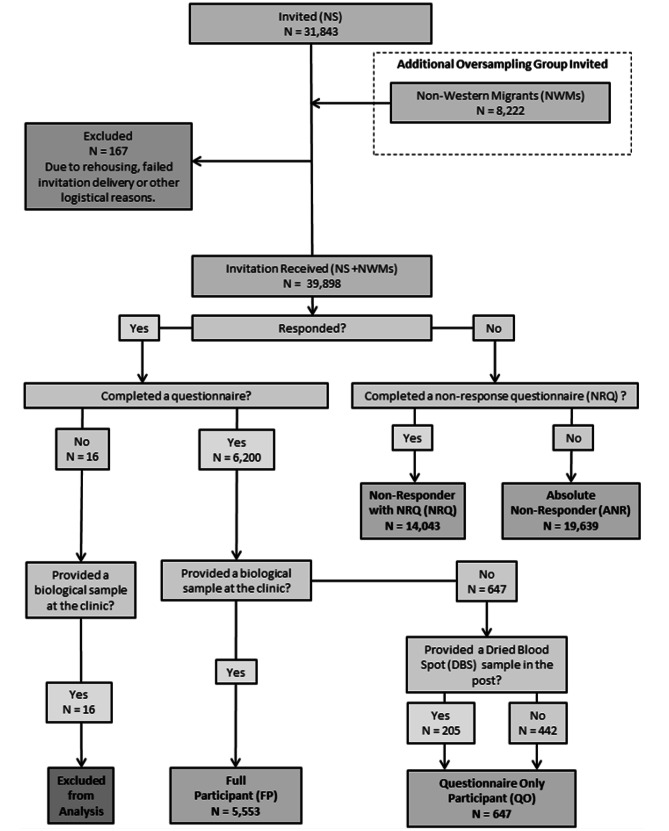
Background: PIENTER 3 (P3), conducted in 2016/17, is the most recent of three nationwide serological surveys in the Netherlands. The surveys aim to monitor the effects of the National Immunisation Programme (NIP) by assessing population seroprevalence of included vaccine preventable diseases (VPDs). The response rate to the main sample was 15.7% (n = 4,983), following a decreasing trend in response compared to the previous two PIENTER studies (P1, 55.0%; 1995/1996 [n = 8,356] and P2, 33.0%; 2006/2007 [n = 5,834]). Non-responders to the main P3 survey were followed-up to complete a "non-response" questionnaire, an abridged 9-question version of the main survey covering demographics, health, and vaccination status. We assess P3 representativeness and potential sources of non-response bias, and trends in decreasing participation rates across all PIENTER studies.
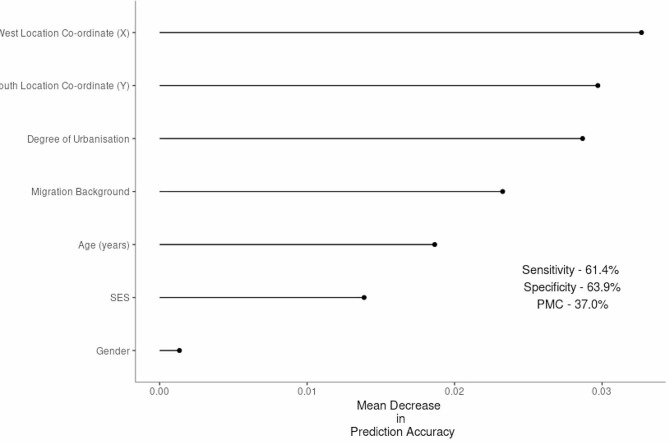
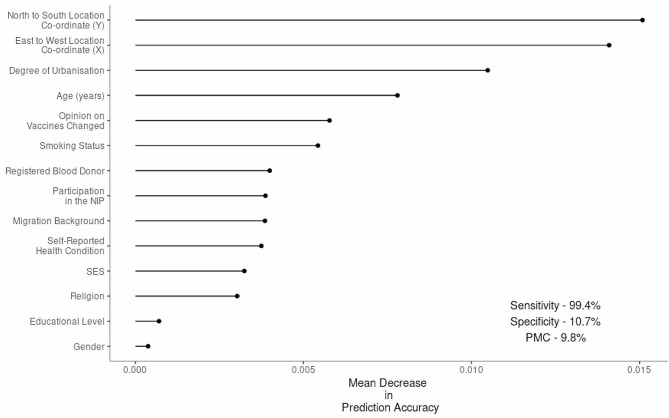
Methods: P3 invitees were classified into survey response types: Full Participants (FP), Questionnaire Only (QO), Non-Response Questionnaire (NRQ) and Absolute Non-Responders (ANR). FP demographic and health indicator data were compared with Dutch national statistics, and then the response types were compared to each other. Random forest algorithms were used to predict response type. Finally, FPs from all three PIENTERs were compared to investigate the profile of survey participants through time.
Results: P3 FPs were in general healthier, younger and higher educated than the Dutch population. Random forest was not able to differentiate between FPs and ANRs, but when predicting FPs from NRQs we found evidence of healthy-responder bias. Participants of the three PIENTERs were found to be similar and are therefore comparable through time, but in line with national trends we found P3 participants were less inclined to vaccinate than previous cohorts.
Discussion: The PIENTER biobank is a powerful tool to monitor population-level protection against VPDs across 30 years in The Netherlands. However, future PIENTER studies should continue to focus on improving recruitment from under-represented groups, potentially by considering alternative and mixed survey modes to improve both overall and subgroup-specific response. Whilst non-responder bias is unlikely to affect seroprevalence estimates of high-coverage vaccines, the primary aim of the PIENTER biobank, other studies with varied vaccination/disease exposures should consider the influence of bias carefully.
Keywords: National immunization programme; Non-response bias; Seroprevalence; Survey.
© 2024. The Author(s).
Conflict of interest statement
The authors declare no competing interests.
Figures

Similar articles
-
Third national biobank for population-based seroprevalence studies in the Netherlands, including the Caribbean Netherlands.BMC Infect Dis. 2019 May 28;19(1):470. doi: 10.1186/s12879-019-4019-y. BMC Infect Dis. 2019. PMID: 31138148 Free PMC article.
-
Disease burden of varicella versus other vaccine-preventable diseases before introduction of vaccination into the national immunisation programme in the Netherlands.Euro Surveill. 2019 May;24(18):1800363. doi: 10.2807/1560-7917.ES.2019.24.18.1800363. Euro Surveill. 2019. PMID: 31064637 Free PMC article.
-
Lagging Immune Response to Haemophilus influenzae Serotype b (Hib) Conjugate Vaccine after the Primary Vaccination with Hib of Infants in The Netherlands.Vaccines (Basel). 2020 Jun 30;8(3):347. doi: 10.3390/vaccines8030347. Vaccines (Basel). 2020. PMID: 32629935 Free PMC article.
-
Seroepidemiology: an underused tool for designing and monitoring vaccination programmes in low- and middle-income countries.Trop Med Int Health. 2016 Sep;21(9):1086-98. doi: 10.1111/tmi.12737. Epub 2016 Jul 1. Trop Med Int Health. 2016. PMID: 27300255 Review.
-
Strengthening vaccination policies in Latin America: an evidence-based approach.Vaccine. 2013 Aug 20;31(37):3826-33. doi: 10.1016/j.vaccine.2012.12.062. Epub 2013 Jan 25. Vaccine. 2013. PMID: 23357196 Review.
Cited by
-
Association Between SARS-CoV-2 Vaccination and Development of Antinuclear Antibodies Among Students.J Prim Care Community Health. 2024 Jan-Dec;15:21501319241273213. doi: 10.1177/21501319241273213. J Prim Care Community Health. 2024. PMID: 39257165 Free PMC article.
-
Potential value streams of an integrated Canadian serosurveillance network.Can J Public Health. 2025 Jun 30. doi: 10.17269/s41997-025-01075-9. Online ahead of print. Can J Public Health. 2025. PMID: 40588636
-
Seroprevalence of Toxoplasma gondii and associated risk factors for infection in the Netherlands: third cross-sectional national study.Epidemiol Infect. 2023 Jul 28;151:e136. doi: 10.1017/S095026882300122X. Epidemiol Infect. 2023. PMID: 37503608 Free PMC article.
-
Trends in Chlamydia trachomatis IgG seroprevalence in the general population of the Netherlands over 20 years.Sex Transm Infect. 2024 Jan 17;100(1):31-38. doi: 10.1136/sextrans-2023-055888. Sex Transm Infect. 2024. PMID: 37985129 Free PMC article.
-
Dietary greenhouse gas emissions and resource use among Bavarian adults: associations with sociodemographics and food choices.Front Nutr. 2025 Apr 9;12:1542254. doi: 10.3389/fnut.2025.1542254. eCollection 2025. Front Nutr. 2025. PMID: 40271426 Free PMC article.
References
-
- Giesecke J. Seroepidemiology. Modern infectious disease epidemiology: Hodder Arnold; 2002. p. 188– 98.
-
- Osborne K. JW, E. Miller. The European sero-epidemiology network. Eurosurveillance. 1997;2(4). - PubMed
-
- de Voer RM, Mollema L, Schepp RM, de Greeff SC, van Gageldonk PG, de Melker HE, et al. Immunity against Neisseria meningitidis serogroup C in the Dutch population before and after introduction of the meningococcal c conjugate vaccine. PLoS ONE. 2010;5(8):e12144. doi: 10.1371/journal.pone.0012144. - DOI - PMC - PubMed
MeSH terms
LinkOut - more resources
Full Text Sources
Miscellaneous
