. 2024 Feb 23;15(1):1657.
doi: 10.1038/s41467-024-46043-y.

Metabolomic machine learning predictor for diagnosis and prognosis of gastric cancer

Affiliations

Metabolomic machine learning predictor for diagnosis and prognosis of gastric cancer

Yangzi Chen et al. Nat Commun. .

Abstract

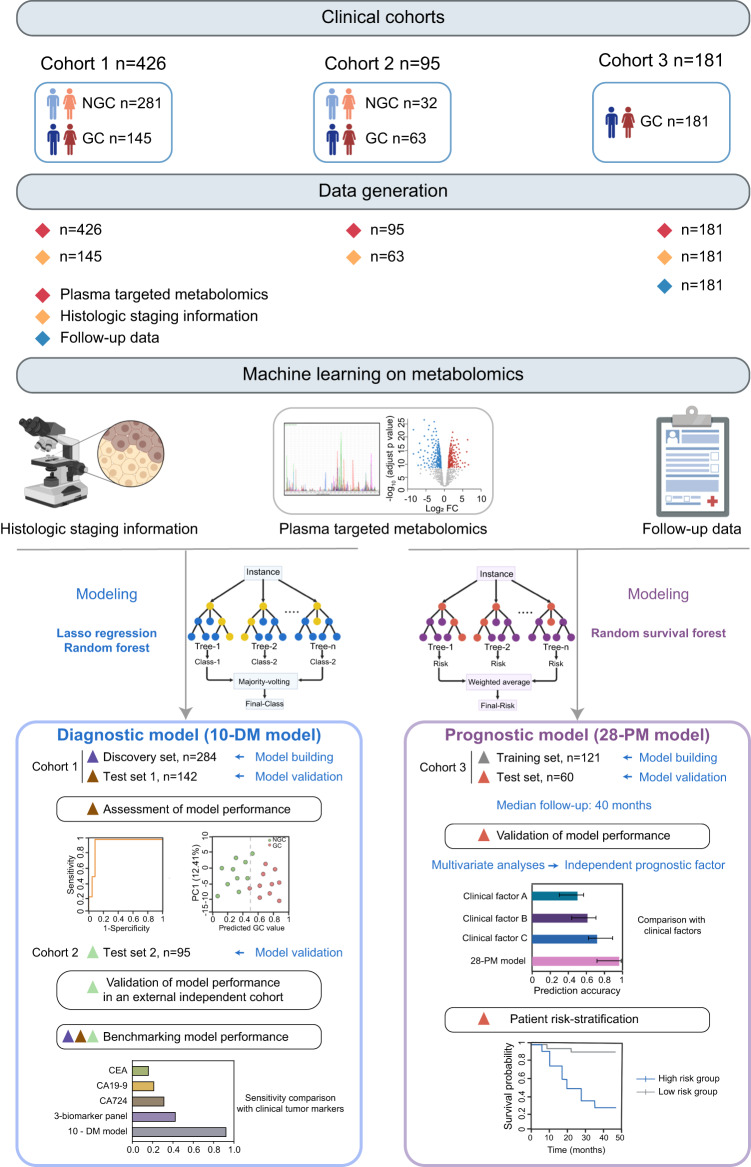
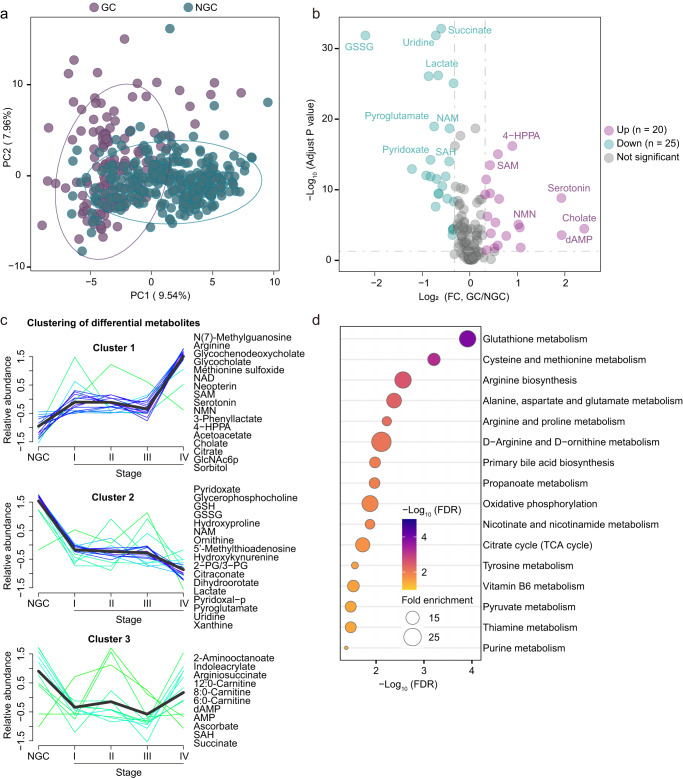
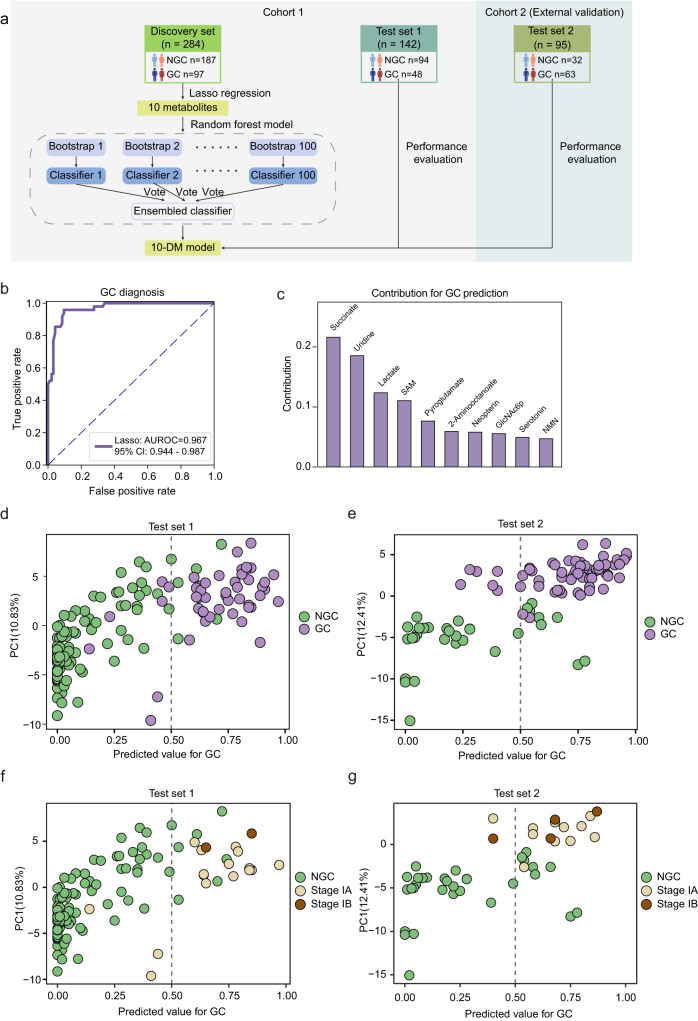
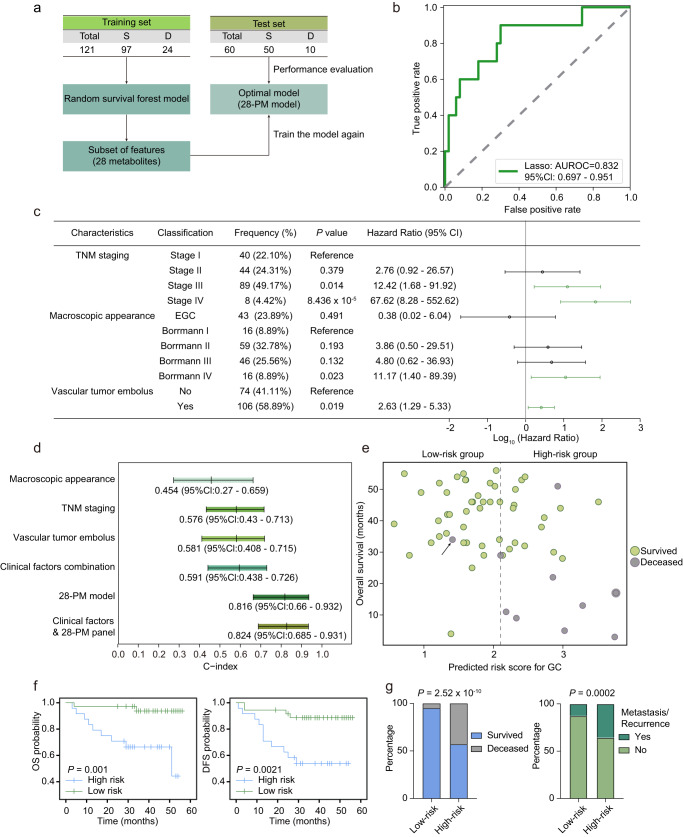
Gastric cancer (GC) represents a significant burden of cancer-related mortality worldwide, underscoring an urgent need for the development of early detection strategies and precise postoperative interventions. However, the identification of non-invasive biomarkers for early diagnosis and patient risk stratification remains underexplored. Here, we conduct a targeted metabolomics analysis of 702 plasma samples from multi-center participants to elucidate the GC metabolic reprogramming. Our machine learning analysis reveals a 10-metabolite GC diagnostic model, which is validated in an external test set with a sensitivity of 0.905, outperforming conventional methods leveraging cancer protein markers (sensitivity < 0.40). Additionally, our machine learning-derived prognostic model demonstrates superior performance to traditional models utilizing clinical parameters and effectively stratifies patients into different risk groups to guide precision interventions. Collectively, our findings reveal the metabolic landscape of GC and identify two distinct biomarker panels that enable early detection and prognosis prediction respectively, thus facilitating precision medicine in GC.


Conflict of interest statement

The authors declare no competing interests.

Figures

Fig. 1
Fig. 1. Schematic overview of the study.
Overview of the study design. The illustration was created with a full license on BioRender.com. A total of 702 individuals were included in the study, and their plasma samples underwent targeted metabolomics analysis. The metabolic profiles of gastric cancer (GC) patients and non-GC controls (NGC) in Cohort 1 (n = 426) were compared to depict the metabolic reprogramming in GC. Using the metabolomics data from Cohort 1 and machine learning techniques, a diagnostic model for GC (10-DM model) was created and validated. This model was further verified in the test set 2 (Cohort 2, n = 95). Metabolomics data from Cohort 3 (n = 181) patients and their clinical features were analyzed using a machine learning algorithm to develop a prognostic model (28-PM model). The performance of these two models was benchmarked against clinically used biomarkers/clinical features. Different colored triangles in the figure represent various participant groups used for model construction, validation, and comparison processes. Source data are provided as a Source Data file.
Fig. 2
Fig. 2. Reprogrammed plasma metabolic landscape of GC patients compared with non-GC controls.
a Principal Component Analysis (PCA) of the Cohort 1 (n = 426) plasma-targeted metabolomics data comparing GC patients (colored in purple) and NGC controls (colored in green). b Volcano plot of the detected metabolites in Cohort 1 plasma metabolomics (GC patients versus NGC controls). Significantly differential metabolites are colored in purple (upregulated) and green (downregulated); the others are colored in gray. Two-sided Wilcoxon rank-sum test followed by Benjamini–Hochberg (BH) multiple comparison test with false discovery rate (FDR) < 0.05 and fold change (FC) > 1.25 or < 0.8. c Mfuzz clustering of metabolic trajectories during GC progression using the differential metabolites according to the metabolic changes’ similarity. Representative metabolites of each cluster are presented on the side. d Kyoto Encyclopedia of Genes and Genomes (KEGG) metabolic pathways enriched by significantly differential metabolites between GC patients and NGC controls. One-sided Fisher’s exact test followed by BH multiple comparison tests was used and only pathways with FDR < 0.05 were presented. Source data are provided as a Source Data file.
Fig. 3
Fig. 3. Machine learning-derived prediction model based on plasma metabolome for GC diagnosis.
a Design of the modeling workflow. LASSO regression and random forest algorithm were adopted for feature selection and model training. The 10-DM model was validated in a test set and an external test set. The illustration was created with a full license on BioRender.com. b The Receiver operating characteristic (ROC) curve for the diagnosis of GC patients in the test set 1. A 95% confidence interval was calculated based on the mean and covariance of one thousand random sampling tests. c Contribution of the ten metabolites to the 10-DM model. dg, The prediction performance of the 10-DM model for distinguishing GC (colored in purple) from NGC (colored in green) in the test set 1 (d) and the test set 2 (e) and for distinguishing stage I GC patients (stage IA colored in yellow and stage IB colored in brown) from NGC in the test set 1 (f) and the test set 2 (g). The dotted line represented the cutoff value of 0.50 used to separate the predicted NGC (on the left side) from GC (on the right side). Source data are provided as a Source Data file.
Fig. 4
Fig. 4. The prognostic model outperformed clinical parameters in predicting outcomes of GC patients.
a Schematic outline of the prognostic model design. S survived, D deceased. b ROC curve analysis of the test set. 95% CI was calculated based on the mean and covariance of one thousand random sampling tests. c Forest plot of clinical parameters with significant prognostic relevance identified by univariate Cox regression analysis. Parameters with a P < 0.05 were considered statistically significant and represented by green lines. The center dots and lines represent HR and 95% Cl scaled by log 10. EGC, early gastric cancer. P-values of TNM staging, macroscopic appearance, and vascular tumor embolus were calculated based on data from n = 181, 180, and 180 independent samples respectively. d C-index values comparison of the macroscopic appearance, TNM staging, vascular tumor embolus, and the 28-PM model in the test set (n = 60). C-index and the 95% Cl were presented under the relative colored bars. e Prognostic prediction of the test set patients (n = 60) using the 28-PM model. The dotted line drawn at the cutoff value of 2.1 divided the patients into high- and low-risk groups. Green circles and gray circles represent survived and deceased in the test set. The arrow pointed out the deceased patient dying of a heart attack. f Kaplan–Meier curves showing the overall survival (OS) and disease-free survival (DFS) of test set GC patients (n = 60) stratified by prognostic risk scores (cutoff = 2.1). P-values were calculated with a two-sided log-rank test. g The high-risk group presented a higher proportion of deceased and relapse/metastasis. A two-sided Fisher’s exact test was used to calculate the P-value. Source data are provided as a Source Data file.

References

    1. Sung H, et al. Global Cancer Statistics 2020: GLOBOCAN estimates of incidence and mortality worldwide for 36 cancers in 185 countries. CA Cancer J. Clin. 2021;71:209–249. doi: 10.3322/caac.21660. - DOI - PubMed
    1. Koo MM, et al. Presenting symptoms of cancer and stage at diagnosis: evidence from a cross-sectional, population-based study. Lancet Oncol. 2020;21:73–79. doi: 10.1016/S1470-2045(19)30595-9. - DOI - PMC - PubMed
    1. Suzuki T, Kitagawa Y, Nankinzan R, Yamaguchi T. Early gastric cancer diagnostic ability of ultrathin endoscope loaded with laser light source. World J. Gastroenterol. 2019;25:1378–1386. doi: 10.3748/wjg.v25.i11.1378. - DOI - PMC - PubMed
    1. Smyth EC, Nilsson M, Grabsch HI, van Grieken NC, Lordick F. Gastric cancer. Lancet. 2020;396:635–648. doi: 10.1016/S0140-6736(20)31288-5. - DOI - PubMed
    1. Thrift AP, El-Serag HB. Burden of gastric cancer. Clin. Gastroenterol. Hepatol. 2020;18:534–542. doi: 10.1016/j.cgh.2019.07.045. - DOI - PMC - PubMed