

Dipterocarpoidae genomics reveal their demography and adaptations to Asian rainforests
- PMID: 38395938
- PMCID: PMC10891123
- DOI: 10.1038/s41467-024-45836-5
Dipterocarpoidae genomics reveal their demography and adaptations to Asian rainforests
Abstract
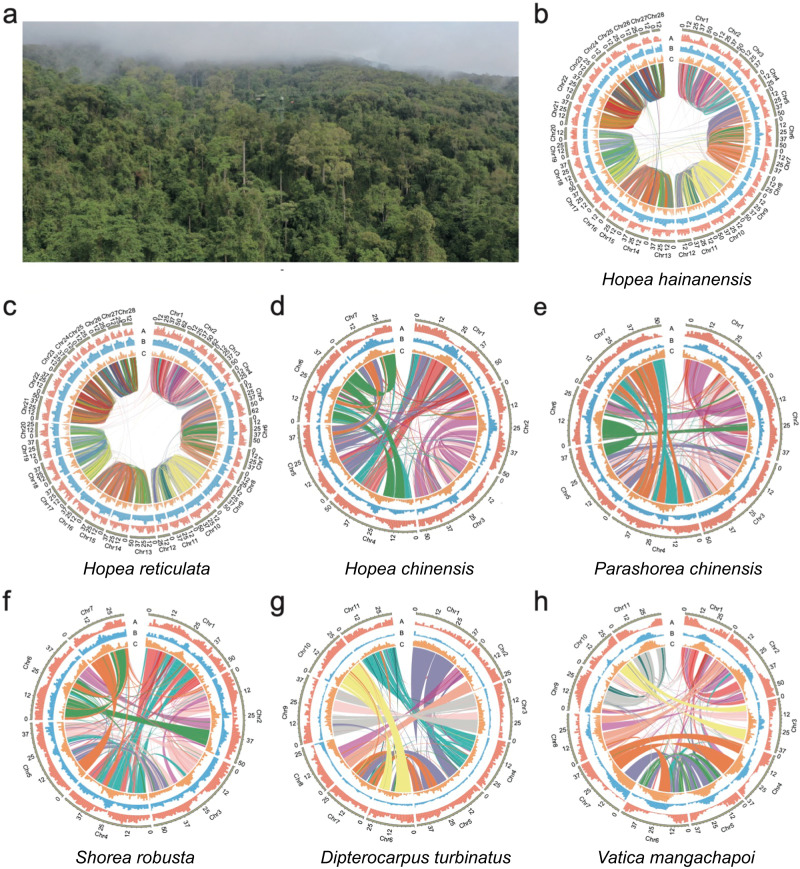
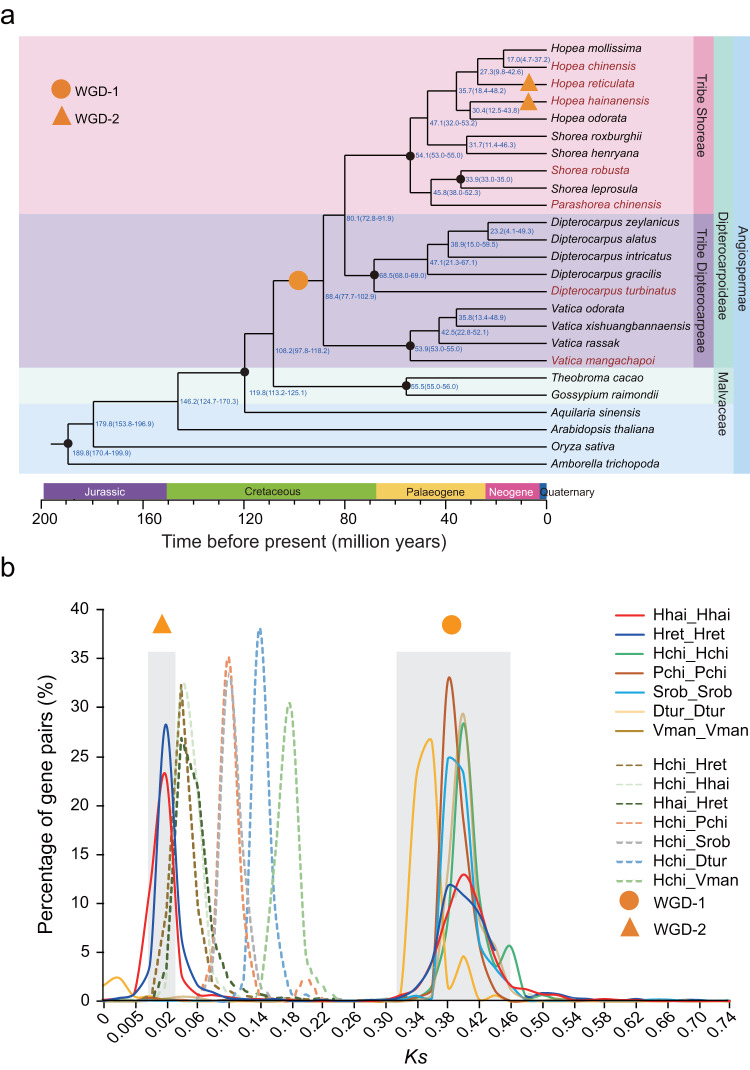
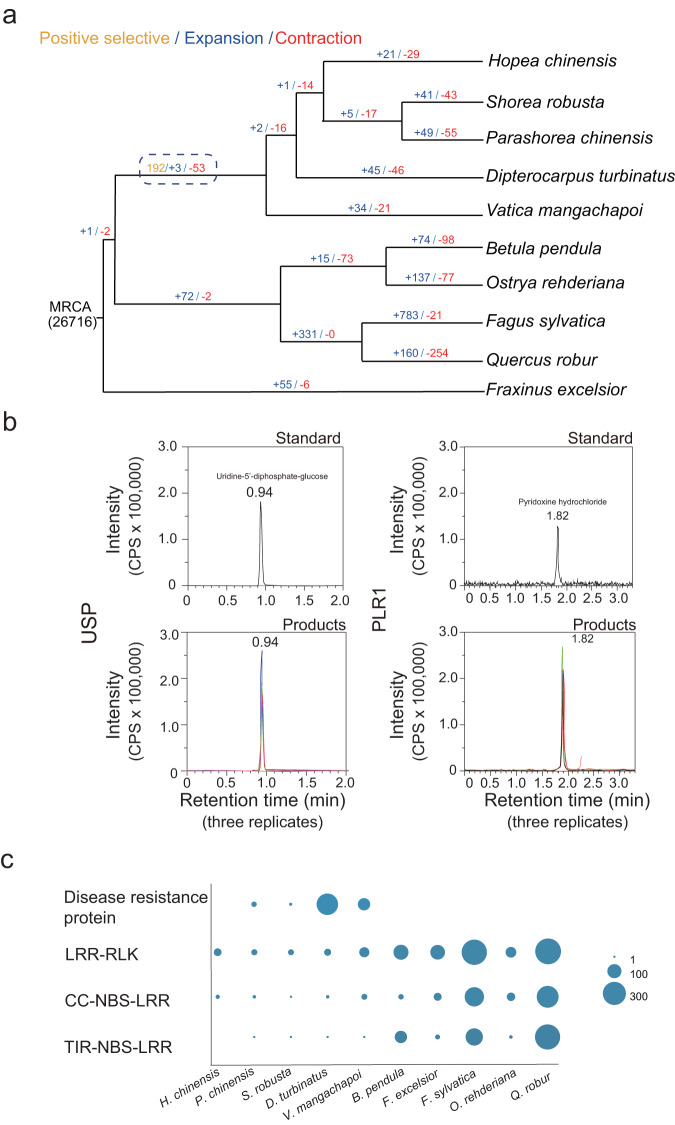
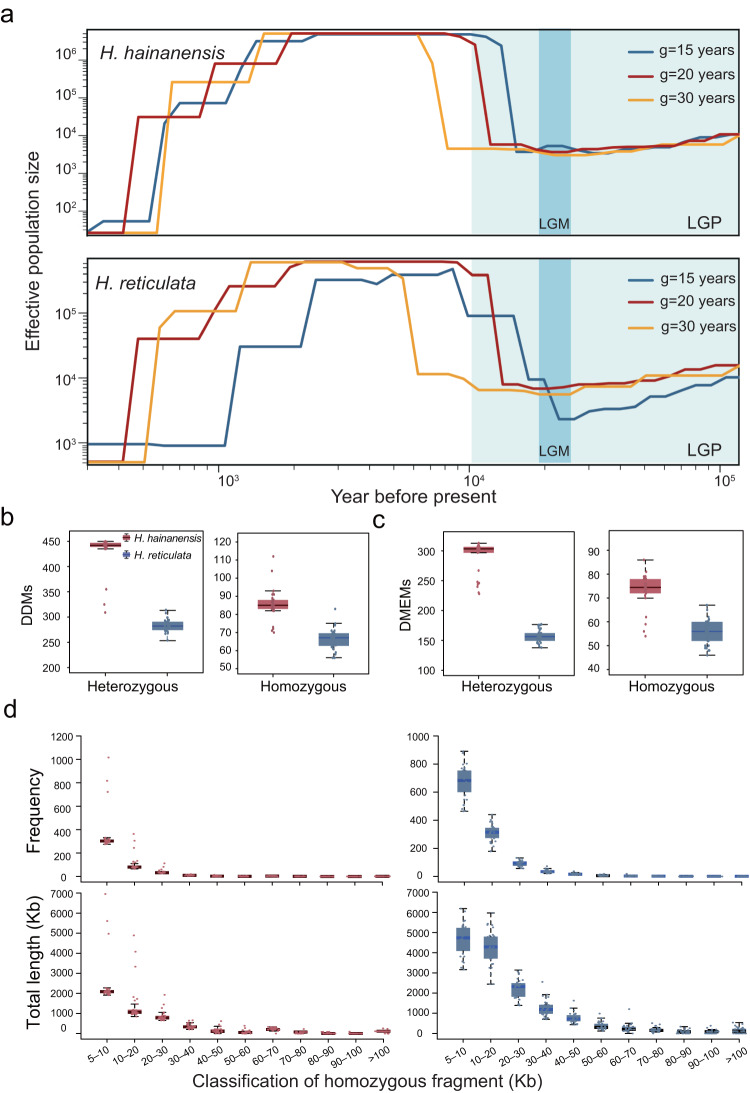
Dipterocarpoideae species form the emergent layer of Asian rainforests. They are the indicator species for Asian rainforest distribution, but they are severely threatened. Here, to understand their adaptation and population decline, we assemble high-quality genomes of seven Dipterocarpoideae species including two autotetraploid species. We estimate the divergence time between Dipterocarpoideae and Malvaceae and within Dipterocarpoideae to be 108.2 (97.8‒118.2) and 88.4 (77.7‒102.9) million years ago, and we identify a whole genome duplication event preceding dipterocarp lineage diversification. We find several genes that showed a signature of selection, likely associated with the adaptation to Asian rainforests. By resequencing of two endangered species, we detect an expansion of effective population size after the last glacial period and a recent sharp decline coinciding with the history of local human activities. Our findings contribute to understanding the diversification and adaptation of dipterocarps and highlight anthropogenic disturbances as a major factor in their endangered status.
© 2024. The Author(s).
Conflict of interest statement
The authors declare no competing interests.
Figures
Similar articles
-
Potential risk of dipterocarps in the marginal Asian rainforests: low population size and high genomic erosion.BMC Biol. 2025 Jun 9;23(1):161. doi: 10.1186/s12915-025-02275-y. BMC Biol. 2025. PMID: 40484938 Free PMC article.
-
The genome of Shorea leprosula (Dipterocarpaceae) highlights the ecological relevance of drought in aseasonal tropical rainforests.Commun Biol. 2021 Oct 7;4(1):1166. doi: 10.1038/s42003-021-02682-1. Commun Biol. 2021. PMID: 34620991 Free PMC article.
-
Thirteen Dipterocarpoideae genomes provide insights into their evolution and borneol biosynthesis.Plant Commun. 2022 Nov 14;3(6):100464. doi: 10.1016/j.xplc.2022.100464. Epub 2022 Oct 27. Plant Commun. 2022. PMID: 36303430 Free PMC article.
-
From sequences to sustainability: Exploring dipterocarp genomes for oleoresin production, timber quality, and conservation.Plant Sci. 2024 Sep;346:112139. doi: 10.1016/j.plantsci.2024.112139. Epub 2024 Jun 3. Plant Sci. 2024. PMID: 38838990 Review.
-
Genomics: cracking the mysteries of walnuts.J Genet. 2019 Jun;98(2):33. J Genet. 2019. PMID: 31204723 Review.
Cited by
-
Mast seeding is stronger in taller plants.Front Plant Sci. 2024 Jul 9;15:1382824. doi: 10.3389/fpls.2024.1382824. eCollection 2024. Front Plant Sci. 2024. PMID: 39045592 Free PMC article.
-
Potential risk of dipterocarps in the marginal Asian rainforests: low population size and high genomic erosion.BMC Biol. 2025 Jun 9;23(1):161. doi: 10.1186/s12915-025-02275-y. BMC Biol. 2025. PMID: 40484938 Free PMC article.
References
-
- Pimm SL, et al. The biodiversity of species and their rates of extinction, distribution, and protection. Science. 2014;344:1246752. - PubMed
-
- Hoffmann AA, Sgrò CM. Climate change and evolutionary adaptation. Nature. 2011;470:479–485. - PubMed
-
- Svenning JC, Eiserhardt WL, Normand S, Ordonez A, Sandel B. The influence of paleoclimate on present-day patterns in biodiversity and ecosystems. Annu. Rev. Ecol. Evol. Syst. 2015;46:551–572.
-
- Tong X, et al. Back to the brink: phylogeography and demographic history of the endangered Torreya jackii. J. Syst. Evol. 2021;60:1158–1171.
MeSH terms
Grants and funding
LinkOut - more resources
Full Text Sources
