. 2024 Feb 23;12(1):12.
doi: 10.1038/s41413-024-00315-x.

Piezo1 expression in chondrocytes controls endochondral ossification and osteoarthritis development

Affiliations

Piezo1 expression in chondrocytes controls endochondral ossification and osteoarthritis development

Laura J Brylka et al. Bone Res. .

Abstract

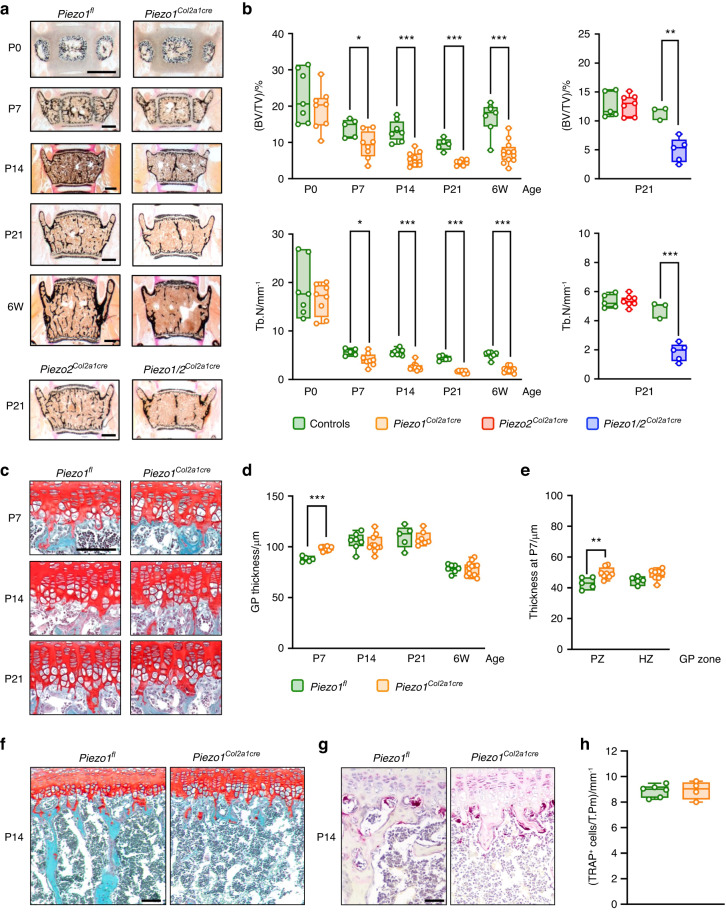
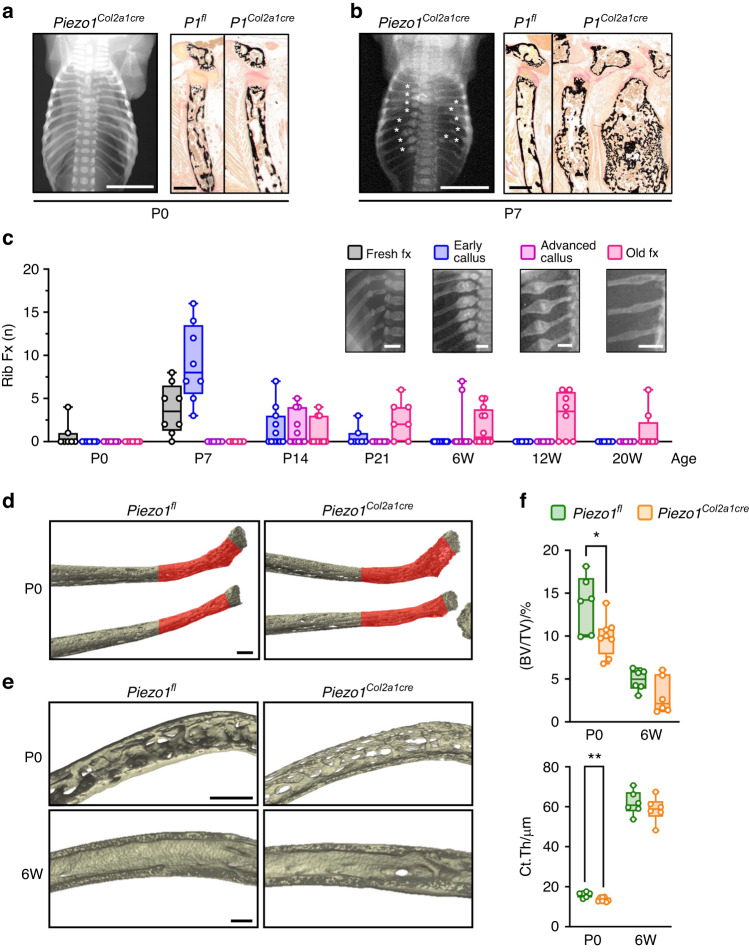
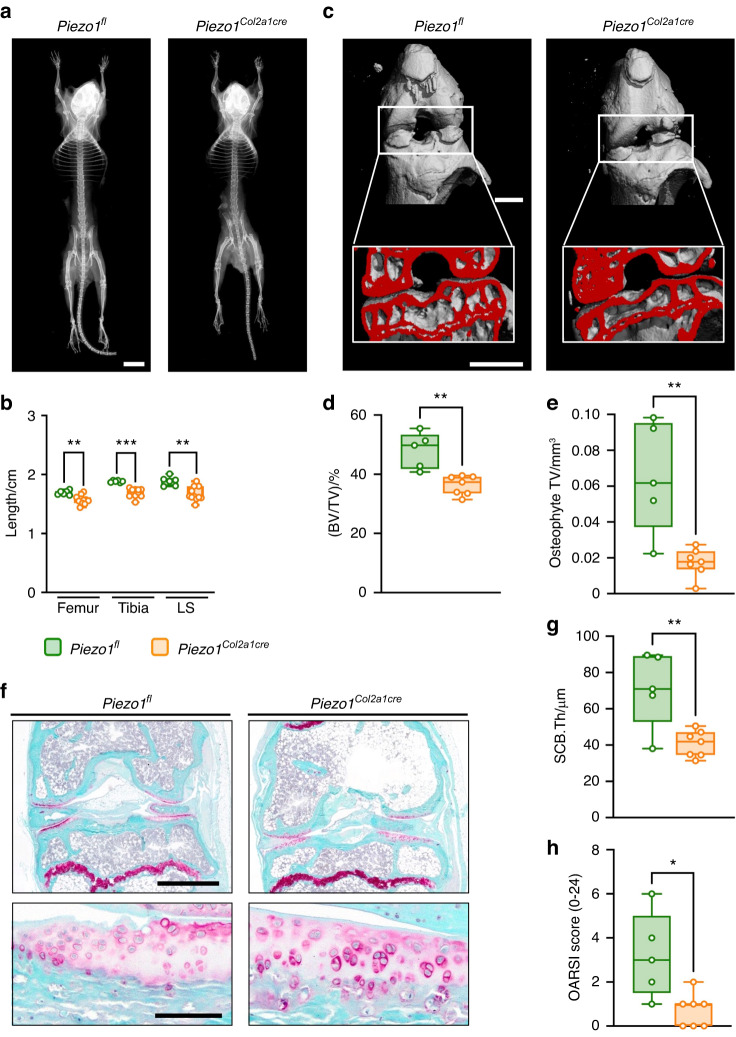
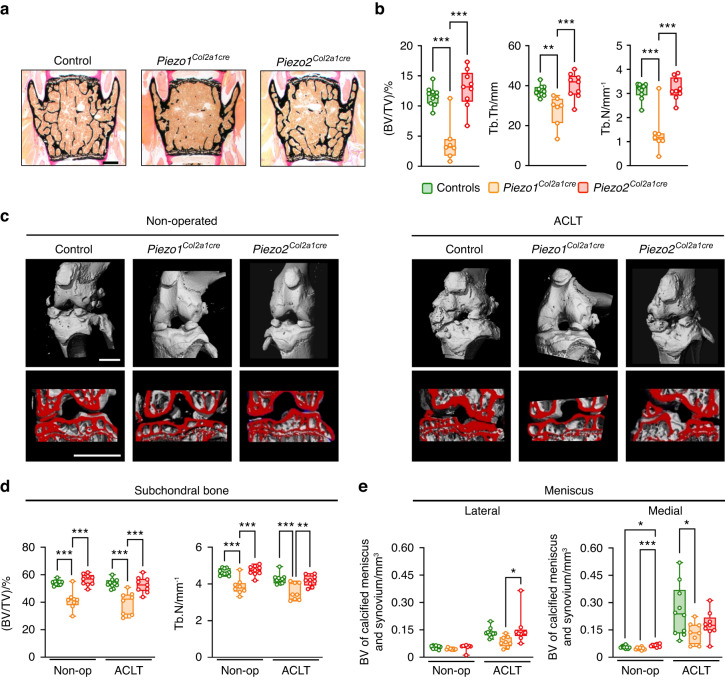
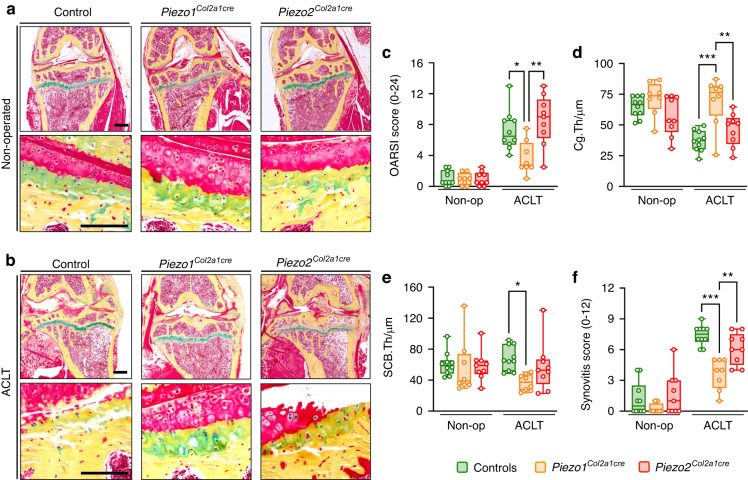
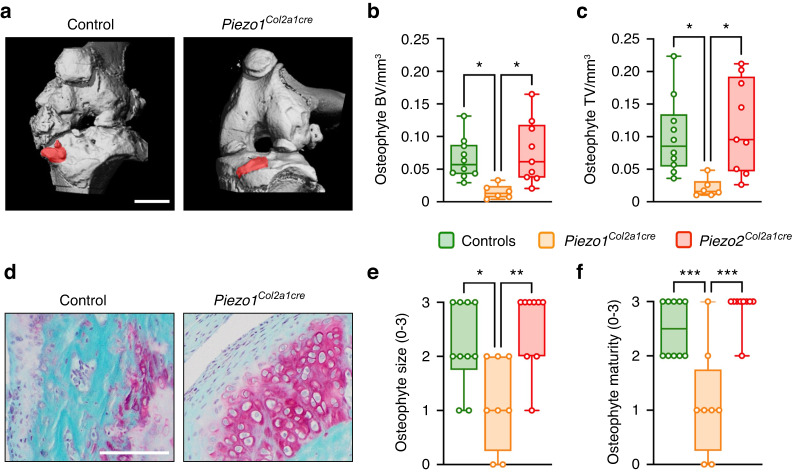
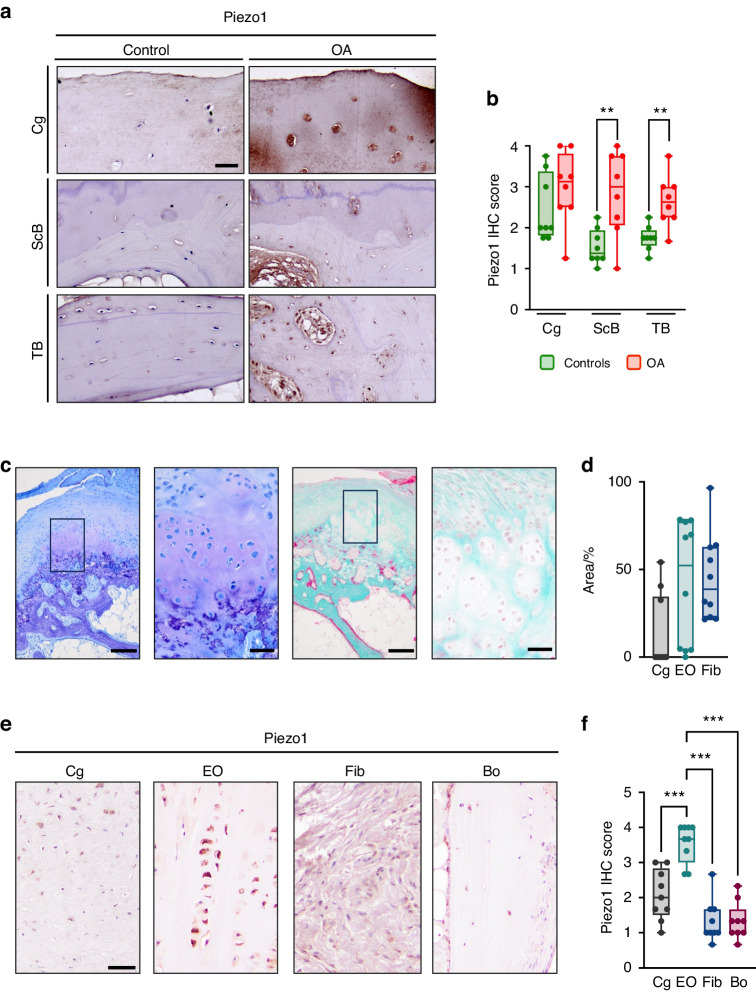
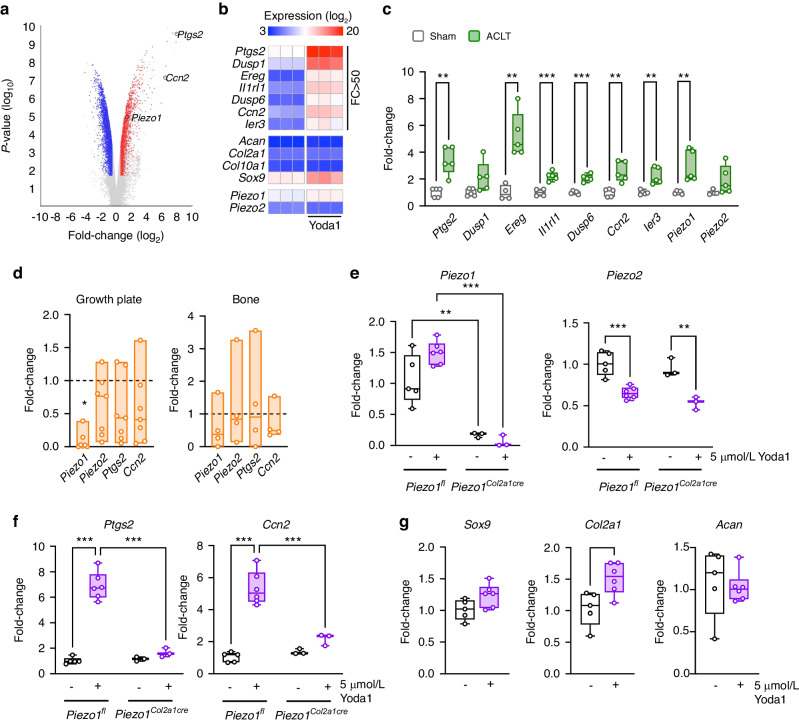
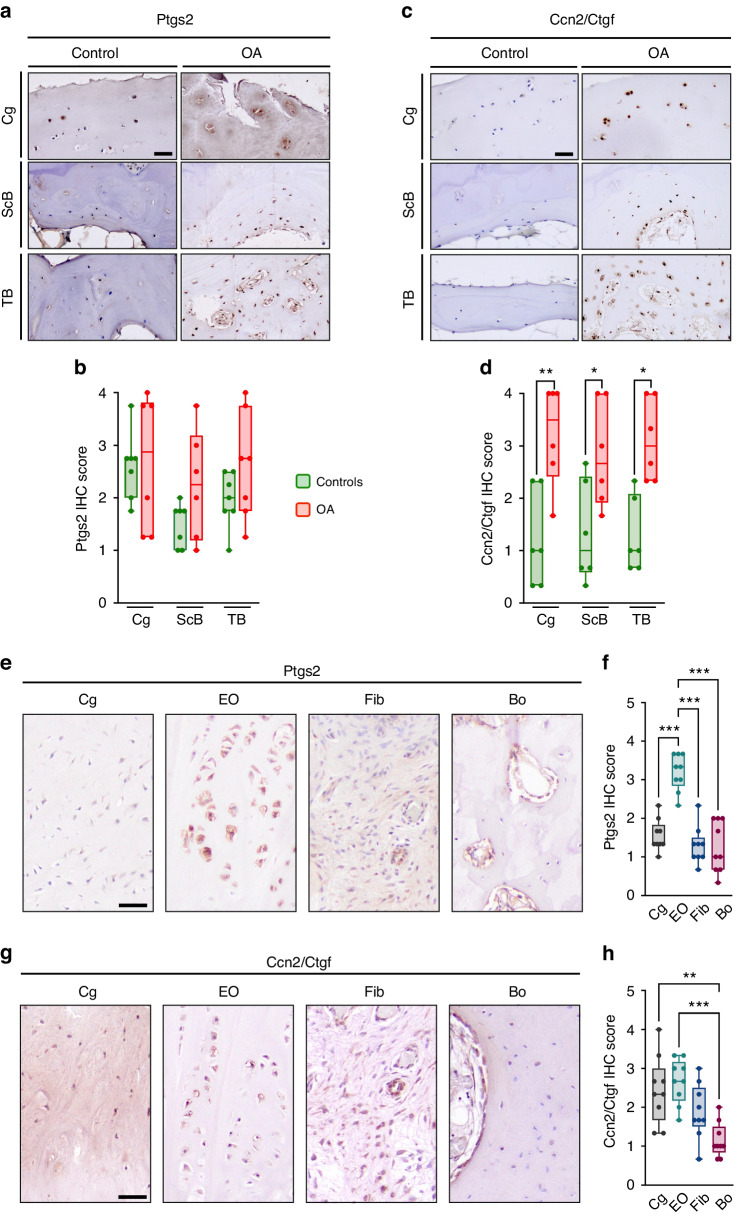
Piezo proteins are mechanically activated ion channels, which are required for mechanosensing functions in a variety of cell types. While we and others have previously demonstrated that the expression of Piezo1 in osteoblast lineage cells is essential for bone-anabolic processes, there was only suggestive evidence indicating a role of Piezo1 and/or Piezo2 in cartilage. Here we addressed the question if and how chondrocyte expression of the mechanosensitive proteins Piezo1 or Piezo2 controls physiological endochondral ossification and pathological osteoarthritis (OA) development. Mice with chondrocyte-specific inactivation of Piezo1 (Piezo1Col2a1Cre), but not of Piezo2, developed a near absence of trabecular bone below the chondrogenic growth plate postnatally. Moreover, all Piezo1Col2a1Cre animals displayed multiple fractures of rib bones at 7 days of age, which were located close to the growth plates. While skeletal growth was only mildly affected in these mice, OA pathologies were markedly less pronounced compared to littermate controls at 60 weeks of age. Likewise, when OA was induced by anterior cruciate ligament transection, only the chondrocyte inactivation of Piezo1, not of Piezo2, resulted in attenuated articular cartilage degeneration. Importantly, osteophyte formation and maturation were also reduced in Piezo1Col2a1Cre mice. We further observed increased Piezo1 protein abundance in cartilaginous zones of human osteophytes. Finally, we identified Ptgs2 and Ccn2 as potentially relevant Piezo1 downstream genes in chondrocytes. Collectively, our data do not only demonstrate that Piezo1 is a critical regulator of physiological and pathological endochondral ossification processes, but also suggest that Piezo1 antagonists may be established as a novel approach to limit osteophyte formation in OA.


Conflict of interest statement

The authors declare no competing interests.

Figures

Fig. 1
Fig. 1
Inactivation of Piezo1 in chondrocytes impairs postnatal trabecular bone formation. a Representative von Kossa-stained sections of vertebral bodies from Piezo1fl and Piezo1Col2a1Cre littermates immediately after birth (P0), at postnatal days 7, 14 and 21 (P7, P14, P21) or at 6 weeks of age (6 W). Mineralized bone is stained in black. Scale bars: 500 µm. Bottom images show representative sections of vertebral bodies from Piezo2Col2a1Cre and Piezo1/2Col2a1Cre mice at postnatal day 21. b Histomorphometric quantification of the trabecular bone volume per tissue volume (BV/TV) and the trabecular number (Tb.N) in mice of different ages and genotypes, as indicated (n ≥ 3). c Representative Safranin O-stained sections of the lumbar spine showing growth plates from Piezo1fl and Piezo1Col2a1Cre littermates at postnatal day 7, 14 and 21. Cartilage is stained in red. Scale bar: 100 µm. d Histomorphometric quantification of the growth plate (GP) thickness in mice of different ages and genotypes, as indicated (n ≥ 5). e Histomorphometric quantification of proliferative zone (PZ) and hypertrophic zone (HZ) thickness in mice at P7 (n ≥ 5). f Representative Safranin O-stained sections of the lumbar spine in mice at P14, demonstrating the absence of trabecular bone structures below the growth plate in Piezo1Col2a1Cre mice. Scale bar: 250 µm. g Representative sections of the lumbar spine at the age of P14 stained for TRAP activity. Scale bar: 50 µm. h Quantification of the number of TRAP-positive cells per tissue perimeter (TRAP+ cells/T.Pm) below the growth plate (n ≥ 4). Statistical analysis was conducted with Student’s t test comparing different genotypes for each age. *P < 0.05, **P < 0.01, ***P < 0.001
Fig. 2
Fig. 2
Inactivation of Piezo1 in chondrocytes causes rib fractures in neonatal mice. Representative contact radiographs and histology images of rib bones from Piezo1fl and Piezo1Col2a1Cre littermates a immediately after birth (P0) or b at postnatal day 7 (P7), as indicated. Scale bar in radiographs: 5 mm, in histological sections: 250 µm. c Quantification of rib fractures in Piezo1Col2a1Cre mice immediately after birth (P0), at postnatal days 7, 14 and 21 (P7, P14, P21) or at 6, 12 and 20 weeks of age (6 W, 12 W, 20 W). Scale bars: 2 mm. d Representative µCT images of rib bones from Piezo1fl and Piezo1Col2a1Cre littermates immediately after birth (P0), indicating the analyzed region of interest in red. Scale bar: 50 µm. e Representative close-up cross-sectioned µCT reconstructions of the quantified areas from Piezo1fl and Piezo1Col2a1Cre littermates at P0 and at 6 weeks of age (6 W). Scale bar: 100 µm. f Quantification of the trabecular bone volume per tissue volume (BV/TV) and the cortical thickness (Ct.Th) in mice with different ages and genotypes, as indicated. n ≥ 6. Statistical analysis was conducted with Student’s t test comparing different genotypes for each age. *P < 0.05, **P < 0.01
Fig. 3
Fig. 3
Inactivation of Piezo1 in chondrocytes attenuates OA development in aged (60-week-old) mice. a Representative contact radiographs of Piezo1fl and Piezo1Col2a1Cre mice, demonstrating mildly reduced body length in Piezo1Col2a1Cre mice. Scale bar: 10 mm b Quantification of the skeletal length of the femur, tibia, and lumbar spine (LS). c Representative µCT images of knee joints from Piezo1fl and Piezo1Col2a1Cre mice. Scale bars: 1 mm. d Quantification of subchondral bone volume fraction (BV/TV). e Quantification of the osteophyte total volume (TV). f Representative Safranin-O staining of undecalcified knee joint sections from Piezo1fl and Piezo1Col2a1Cre mice. Top panel: overview, scale bar: 1 mm. Bottom panel: detailed view of the articular cartilage, scale bar: 100 µm. g Histomorphometric quantification of the subchondral bone plate thickness (SCB.Th). h Quantification of the OARSI score in knee joints of 60-week-old Piezo1fl and Piezo1Col2a1Cre mice (n ≥ 5). Statistical analysis was conducted with Student’s t test. *P < 0.05, **P < 0.01, ***P < 0.001
Fig. 4
Fig. 4
Inactivation of Piezo1 in chondrocytes impairs trabecular bone mass and limits OA development after ACLT. a Representative von Kossa-stained sections of undecalcified vertebral bodies of control, Piezo1Col2a1cre, and Piezo2Col2a1Cre mice. Scale bar: 500 µm. b Histomorphometric quantification of trabecular bone volume (BV/TV), trabecular thickness (Tb. Th), and trabecular number (Tb. N) (n ≥ 8). c Representative µCT images of knee joints from non-operated and ACLT control, Piezo1Col2a1cre, and Piezo2Col2a1Cre mice showing reduced subchondral bone volume in non-operated and ACLT Piezo1Col2a1cre but not Piezo2Col2a1Cre mice, scale bars: 1 mm. d µCT-based quantification of subchondral bone volume fraction (BV/TV) and trabecular number (Tb.N). e µCT-based quantification of calcified meniscus and synovium assessed in the lateral and medial joint compartment of non-operated and ACLT control, Piezo1Col2a1cre, and Piezo2Col2a1Cre mice
Fig. 5
Fig. 5
Inactivation of Piezo1 in chondrocytes attenuates cartilage degradation and inflammation after ACLT. a Movat pentachrome-stained sections of undecalcified non-operated knee joints from control, Piezo1Col2a1cre, and Piezo2Col2a1Cre mice. Top panel: overview, scale bar: 500 µm; bottom panel: detailed view of the osteochondral unit, scale bar: 100 µm. b Movat pentachrome-stained sections of undecalcified anterior cruciate ligament transected (ACLT) knee joints from control, Piezo1Col2a1cre, and Piezo2Col2a1Cre mice. Top panel: overview, scale bar: 500 µm; bottom panel: detailed view of the osteochondral unit, scale bar: 100 µm. c Histomorphometric quantification of the OARSI score, d cartilage thickness (Cg. Th), e subchondral bone plate thickness (SCB. Th), and f synovitis score (n ≥ 8). Statistical analysis was conducted with one-way ANOVA (Tukey). *P < 0.05, **P < 0.01, ***P < 0.001
Fig. 6
Fig. 6
Osteophyte formation and maturation are markedly reduced in Piezo1Col2a1cre mice. a Representative µCT images of knee joints after ACLT from control and Piezo1Col2a1Cre mice showing smaller osteophytes in Piezo1Col2a1Cre mice, scale bar: 1 mm. b µCT-based quantification of the bone volume (BV) of osteophytes and c osteophyte total volume (TV). d Representative, Safranin-O stained image of tibial osteophytes highlighting the immature cartilaginous osteophyte composition in Piezo1Col2a1Cre mice, scale bar: 100 µm. e Quantification of osteophyte size and f osteophyte maturity. n ≥ 8. Statistical analysis was conducted with one-way ANOVA (Tukey). *P < 0.05, **P < 0.01, ***P < 0.001
Fig. 7
Fig. 7
Piezo1 expression is increased in human OA. a Representative histological images of femoral head sections stained for Piezo1 by immunohistochemistry, scale bar: 50 µm. b Quantification of Piezo1 expression in the articular cartilage (Cg), subchondral bone (ScB), and trabecular bone (TB) (n ≥ 8). c Representative images of toluidine-blue- (left) and trichrome-goldner-stained (right) sections of human osteophyte specimens. Boxes in the overview images (scale bar: 200 µm) indicate the position of the images shown at higher magnification (scale bar: 50 µm). d Histomorphometric quantification of the area of the various regions of the osteophyte rim. Cg: cartilage; EO: zones of endochondral ossification; Fib: fibrotic areas. e Representative histological images of human osteophyte sections stained for Piezo1 by immunohistochemistry, scale bar: 50 µm. f Quantification of Piezo1 expression in cartilage (Cg), zones of endochondral ossification (EO), fibrotic areas (Fib) and bone (Bo) (n ≥ 8). Statistical analysis was conducted with Student’s t test comparing control and OA samples (b), or one-way ANOVA (Tukey) (f). **P < 0.01, ***P < 0.001
Fig. 8
Fig. 8
Piezo1 activation results in a specific transcriptional response. a Volcano plot showing differentially expressed genes in chondrogenic ATCD5 cells treated with the Piezo1 agonist Yoda1 (5 μM) or DMSO for 6 h. b Heat map showing the seven genes with a more than 50-fold change (FC > 50) after Yoda1 treatment, four established chondrocyte markers, as well as Piezo1 and Piezo2. Data are shown as log2 expression values. c Expression analysis by qRT-PCR for the indicated genes in knee joints of mice 8 weeks after ACLT compared to sham-operated controls (n = 5). d Expression analysis by qRT-PCR of the indicated genes in growth plate (left) and bone (right) of Piezo1Col2a1Cre mice relative to controls (indicated by dashed line). e Expression analysis by qRT-PCR of Piezo1 and Piezo2 in cultured primary chondrocytes isolated from Piezo1fl and Piezo1Col2a1Cre mice treated with Yoda1 or DMSO. f Expression analysis by qRT-PCR of Ptgs2 and Ccn2 in the same samples. g Expression analysis of Sox9, Col2a1 and Acan in cultured primary chondrocytes from control mice treated with Yoda1 or DMSO. Statistical analysis was conducted with Student’s t test (c, g) or two-way ANOVA (Tukey) (e, f). *P < 0.05, **P < 0.01, ***P < 0.001
Fig. 9
Fig. 9
Ptgs2 and Ccn2/Ctgf are expressed in human osteophytes. a Representative histological images of femoral head sections stained for Ptgs2 by immunohistochemistry, scale bar: 50 µm. b Quantification of Ptgs2 expression in the articular cartilage, subchondral bone, and trabecular bone. c Representative histological images of femoral head sections stained for Ccn2/Ctgf by immunohistochemistry, scale bar: 50 µm. d Quantification of Ccn2/Ctgf expression in the articular cartilage, subchondral bone, and trabecular bone (n ≥ 8). e Representative histological images of human osteophyte sections stained for Ptgs2 by immunohistochemistry, scale bar: 50 µm. f Quantification of Ptgs2 expression in cartilage (Cg), zones of endochondral ossification (EO), fibrotic areas (Fib) and bone (Bo). g Representative histological images of human osteophyte sections stained for Ccn2/Ctgf by immunohistochemistry, scale bar: 50 µm. h Quantification of Ccn2/Ctgf expression in cartilage (Cg), zones of endochondral ossification (EO), fibrotic areas (Fib) and bone (Bo) (n ≥ 8). Statistical analysis was conducted with Student’s t test comparing control and OA samples (b, d), or with one-way ANOVA (Tukey) (f, h), *P < 0.05, **P < 0.01, ***P < 0.001

References

    1. Martino F, Perestrelo AR, Vinarsky V, Pagliari S, Forte G. Cellular mechanotransduction: from tension to function. Front. Physiol. 2018;9:824. doi: 10.3389/fphys.2018.00824. - DOI - PMC - PubMed
    1. Stewart S, Darwood A, Masouros S, Higgins C, Ramasamy A. Mechanotransduction in osteogenesis. Bone Joint Res. 2020;9:1–14. doi: 10.1302/2046-3758.91.BJR-2019-0043.R2. - DOI - PMC - PubMed
    1. Zhao Z, et al. Mechanotransduction pathways in the regulation of cartilage chondrocyte homoeostasis. J. Cell Mol. Med. 2020;24:5408–5419. doi: 10.1111/jcmm.15204. - DOI - PMC - PubMed
    1. Syeda R. Physiology and pathophysiology of mechanically activated PIEZO channels. Annu. Rev. Neurosci. 2021;44:383–402. doi: 10.1146/annurev-neuro-093020-120939. - DOI - PubMed
    1. Qin L, et al. Roles of mechanosensitive channel Piezo1/2 proteins in skeleton and other tissues. Bone Res. 2021;9:44. doi: 10.1038/s41413-021-00168-8. - DOI - PMC - PubMed

Publication types