. 2024 Feb 23;15(1):1684.
doi: 10.1038/s41467-024-46077-2.

Virtual histological staining of unlabeled autopsy tissue

Affiliations

Virtual histological staining of unlabeled autopsy tissue

Yuzhu Li et al. Nat Commun. .

Abstract

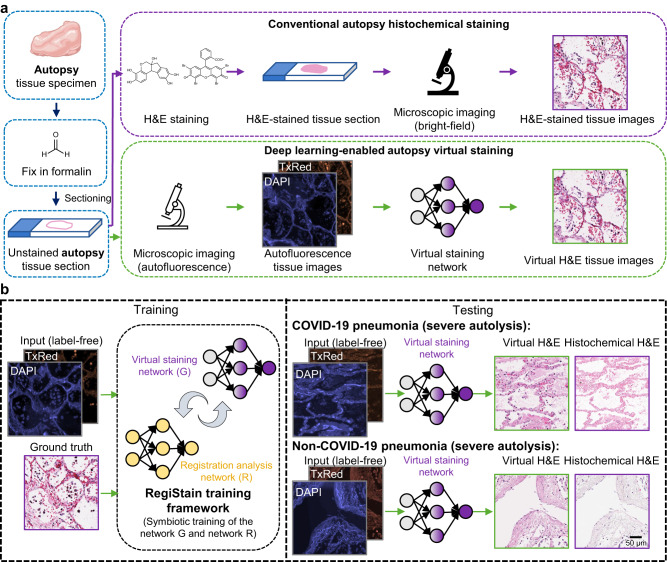
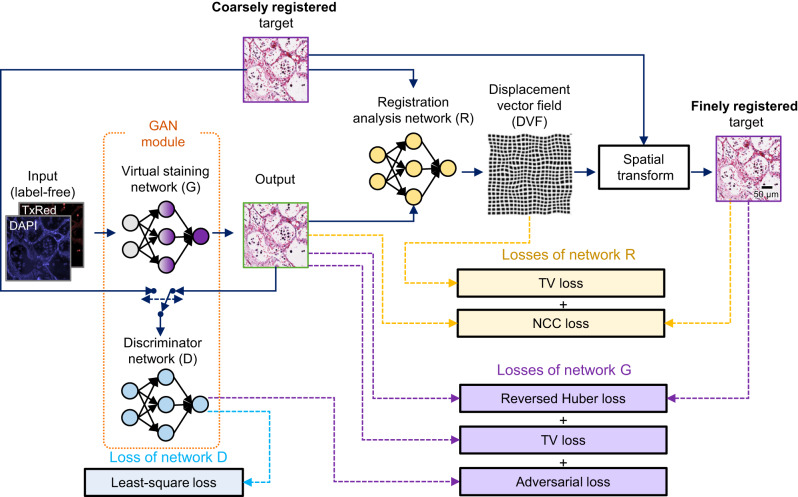
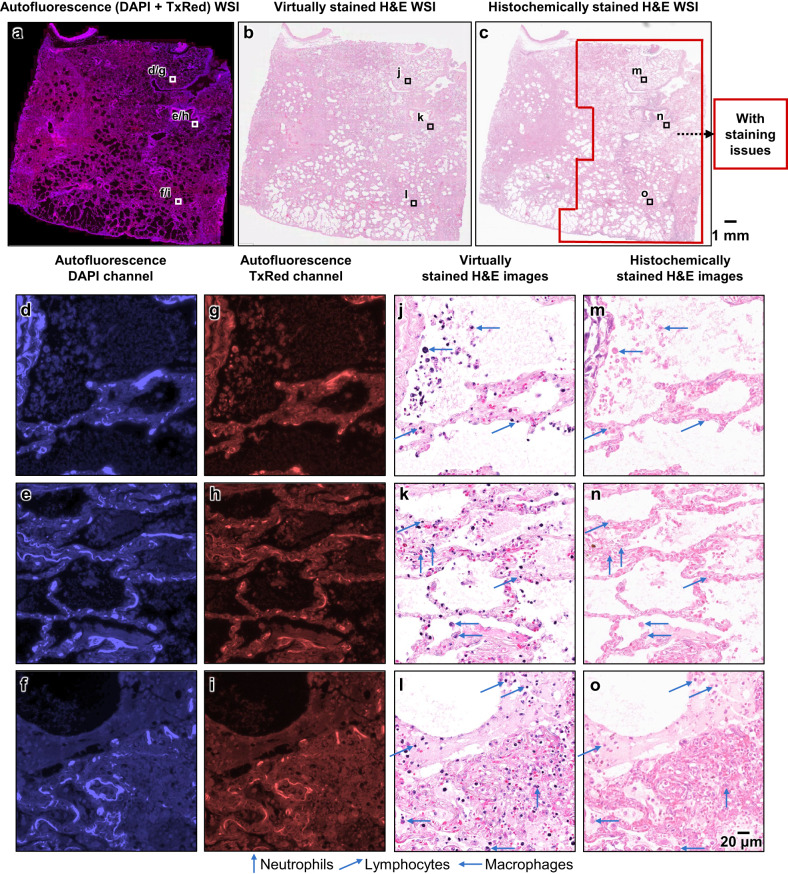
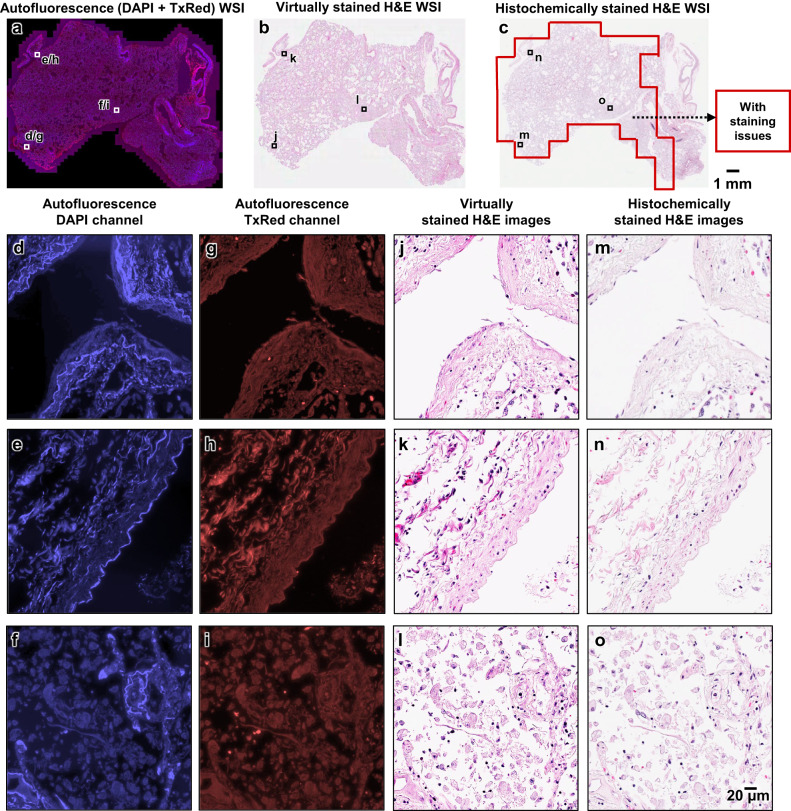
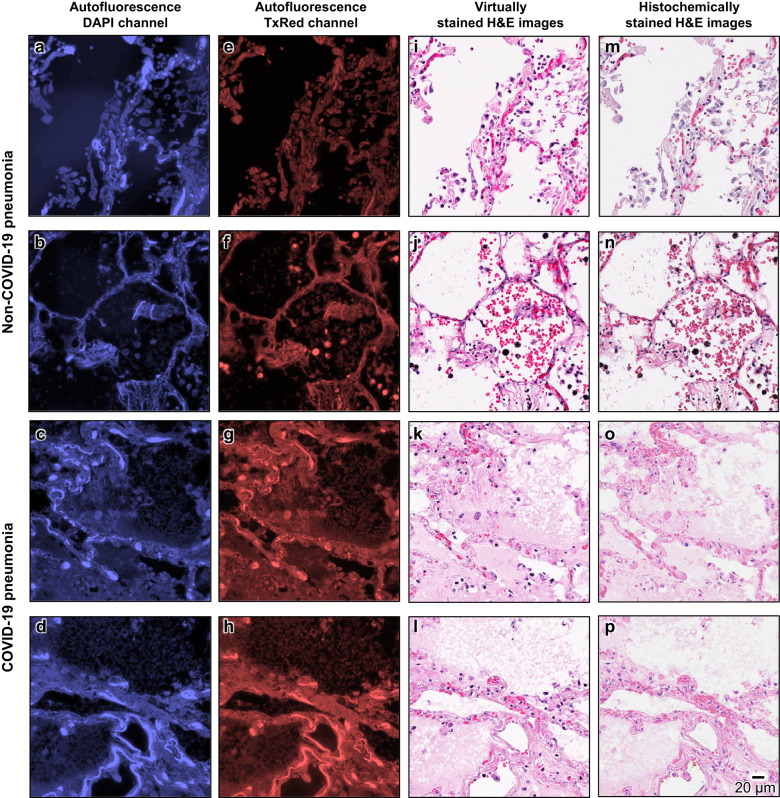
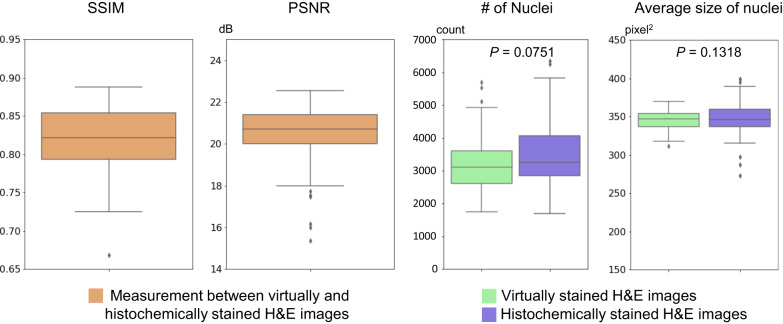
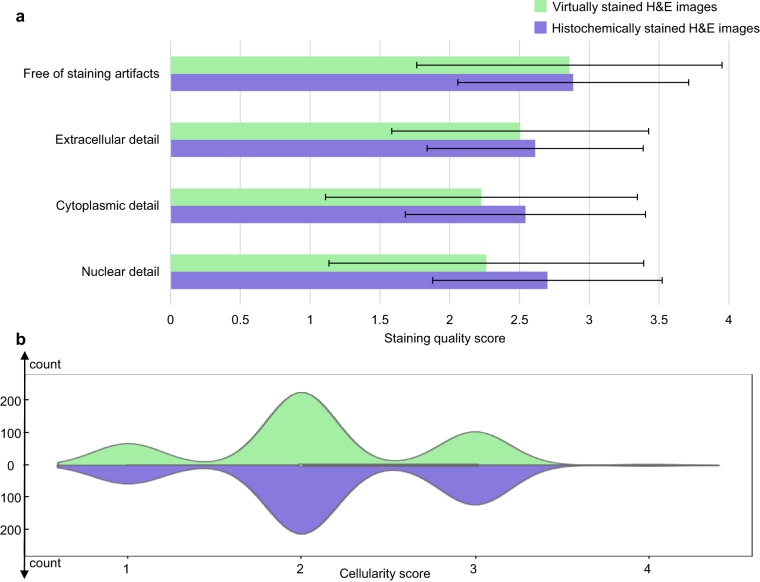
Traditional histochemical staining of post-mortem samples often confronts inferior staining quality due to autolysis caused by delayed fixation of cadaver tissue, and such chemical staining procedures covering large tissue areas demand substantial labor, cost and time. Here, we demonstrate virtual staining of autopsy tissue using a trained neural network to rapidly transform autofluorescence images of label-free autopsy tissue sections into brightfield equivalent images, matching hematoxylin and eosin (H&E) stained versions of the same samples. The trained model can effectively accentuate nuclear, cytoplasmic and extracellular features in new autopsy tissue samples that experienced severe autolysis, such as COVID-19 samples never seen before, where the traditional histochemical staining fails to provide consistent staining quality. This virtual autopsy staining technique provides a rapid and resource-efficient solution to generate artifact-free H&E stains despite severe autolysis and cell death, also reducing labor, cost and infrastructure requirements associated with the standard histochemical staining.


Conflict of interest statement

A.O. is the founder of a company (Pictor Labs) that commercializes virtual staining technology. A.O., K.H., J.L. and Y.Z. have pending patent applications on virtual tissue staining, related to the deep learning-based methods used in this manuscript on virtual histological staining of unlabeled autopsy tissue. The remaining authors declare no competing interests.

Figures

Fig. 1
Fig. 1. Virtual H&E staining of unlabeled autopsy tissue sections using deep learning.
a Conventional hematoxylin and eosin (H&E) histochemical staining (top) requires chemical sample processing procedures performed by histotechnologists, which are time-consuming, labor-intensive, costly, and prone to potential staining failures caused by tissue autolysis in autopsy samples. In contrast, a deep learning-based virtual staining neural network (bottom) can be used to perform rapid, cost-effective, and accurate virtual staining of unlabeled autopsy tissue sections based on their autofluorescence microscopy images, which can provide high-quality staining results even in autolytic tissue areas where the histochemical staining fails. b In RegiStain, we employ a training strategy where the training of the virtual staining network and the image registration network are mutually optimized; the virtual staining network is efficiently trained to learn the intrinsic mapping between the tissue autofluorescence texture and the H&E stained image texture. This training was performed exclusively using well-preserved autopsy samples (collected before COVID-19), and once the training was completed, the virtual staining network model was used to successfully stain autopsy samples that experienced severe autolysis, obtained from COVID-19 as well as non-COVID-19 cadavers.
Fig. 2
Fig. 2. RegiStain framework for training the autopsy virtual staining model.
During the training process, the generative adversarial network (GAN) module consisting of the virtual staining network (G) and the discriminator network (D) was trained along with the image registration analysis network (R) to ensure the pixel-wise accurate learning of the image transformation from the input autofluorescence tissue images into H&E equivalent brightfield counterparts. More details regarding this training scheme are provided in the Methods section. TV loss and NCC loss correspond to the total variation loss and normalized cross-correlation coefficient loss, respectively.
Fig. 3
Fig. 3. Visual comparison between the virtually stained H&E images of an unlabeled autopsy tissue section and their corresponding histochemical H&E staining results that exhibit under-staining artifacts in the nuclei regions.
a Autofluorescence whole slide image (WSI) of the label-free autopsy tissue sample, visualized by assigning its captured DAPI and TxRed channel images to the blue and red channels, respectively (this is only for visualization purposes). b Virtual hematoxylin and eosin (H&E) staining results of the same WSI in a, which are digitally generated by our virtual staining network by taking label-free autofluorescence images as its input. c Histochemical H&E staining results of the same WSI in a. After the staining artifact quantification/identification process, the red-framed region is found to exhibit artifacts of under-staining in the nuclei regions. do Zoomed-in images of the three exemplary local regions indicated in ac, which are selected from the areas exhibiting staining issues within the histochemically stained WSI in a. Here, df are the autofluorescence images of these regions captured using the DAPI channel, and gi are their counterparts captured using the TxRed channel. These DAPI and TxRed autofluorescence image pairs serve as the inputs to our virtual staining network. jl are the virtual H&E staining results corresponding to the same regions of df (or gi), which are digitally generated by our virtual staining network based on d and g, e and h, and f and i, respectively. mo are the histochemical H&E staining results corresponding to the same regions of jl, which exhibit under-staining artifacts in their nuclei. Staining results for different types of cells, including neutrophils, lymphocytes, and macrophages, are annotated in the images using arrows with different directions. The process of producing these representative images in this figure was repeated, yielding similar results for all the 10 autopsy slides (n = 10) in the blind testing stage.
Fig. 4
Fig. 4. Visual comparison between the virtually stained H&E images of an unlabeled autopsy tissue section and their corresponding histochemical H&E staining results that exhibit under-staining artifacts in their cytoplasmic and extracellular regions.
a Autofluorescence whole slide image (WSI) of the autopsy tissue sample, visualized by assigning its captured DAPI and TxRed channel images to the blue and red channels, respectively (this is only for visualization purposes). b Virtual hematoxylin and eosin (H&E) staining results of the same WSI in a, which are digitally generated by our virtual staining network by taking label-free autofluorescence images as its input. c Histochemical H&E staining results of the same WSI in a. After the staining artifact quantification/identification process, the red-framed region is found to exhibit artifacts of under-staining in the cytoplasmic and extracellular regions. do Zoomed-in images of the three exemplary local regions indicated in ac, which are selected from the areas exhibiting staining artifacts (under-staining of cytoplasmic and extracellular regions) within the histochemically stained WSI in a. Here, df are the autofluorescence images of these regions captured using the DAPI channel, and gi are their counterparts captured using the TxRed channel. These DAPI and TxRed autofluorescence image pairs serve as the inputs to our autopsy virtual staining network. jl are the virtual H&E staining results corresponding to the same regions of df (or gi), which are digitally generated by our virtual staining network based on d and g, e and h, and f and i, respectively. mo are the histochemical H&E staining results corresponding to the same regions of jl, which exhibit under-staining artifacts in their cytoplasmic and extracellular regions. The process of producing these representative images in this figure was repeated, yielding similar results for all the 10 autopsy slides (n = 10) in the blind testing stage.
Fig. 5
Fig. 5. Visual comparison of the virtually stained H&E images of unlabeled autopsy tissue sections and their corresponding histochemical H&E staining results without staining artifacts (corresponding to well-preserved tissue regions).
ad Autofluorescence images of 4 exemplary tissue areas from different pneumonia samples, captured using the DAPI channel. Here, a and b correspond to two pneumonia lung samples from two non-COVID-19 patient cadavers, while c and d correspond to two pneumonia lung samples from two COVID-19 patient cadavers. eh same as ad, but captured using the TxRed channel. il Virtual hematoxylin and eosin (H&E) staining results of the same tissue areas in ad (or eh), which are digitally generated by our virtual staining network based on a and e, b and f, c and g, and d and h, respectively. mp Histochemical H&E staining results of the same tissue areas in ad (or eh), all exhibiting decent staining quality, corresponding to well-preserved tissue regions. The process of producing these representative images in this figure was repeated, yielding similar results for all the 10 autopsy slides (n = 10) in the blind testing stage.
Fig. 6
Fig. 6. Quantitative evaluation of the virtual H&E staining results of unlabeled autopsy tissue sections that have well-stained histochemical ground truth, corresponding to well-preserved tissue FOVs.
These box plots show the distributions of different metrics quantified using n = 100 test sample fields-of-view (FOVs) that have well-stained histochemical ground truth corresponding to well-preserved tissue regions, each with an area of 1.3 × 1.3 mm2 (8000 × 8000 pixels). These metrics include the structural similarity index (SSIM), the peak signal-to-noise ratio (PSNR), the number of nuclei per FOV, and the average size of nuclei; the first two metrics (SSIM, PSNR) are quantified by measuring the difference between the virtually and histochemically stained hematoxylin and eosin (H&E) images, and the last two (the number of nuclei per FOV and the average size of nuclei) are quantified individually for the virtually and histochemically stained images, with their P values also provided. P values were calculated using a two-tailed paired t-test. No adjustments for multiple comparisons were needed. For each box plot, the center is denoted by the median. The bounds of each box are defined by the lower quartile (25th percentile) and the upper quartile (75th percentile). The whiskers extend from the box and represent the data points that fall within 1.5 times the interquartile range from the lower and upper quartiles. Any data point outside this range is considered an outlier and plotted individually. Source data are provided as a Source Data file.
Fig. 7
Fig. 7. Score-based quantitative evaluation conducted by four board-certified pathologists for assessing the virtual H&E staining results of unlabeled autopsy tissue sections that have well-stained histochemical ground truth, corresponding to well-preserved tissue FOVs.
a Staining quality scores of virtually and histochemically stained hematoxylin and eosin (H&E) images evaluated by four board-certified pathologists from different aspects. These aspects include staining artifacts, extracellular detail, cytoplasmic detail, and nuclear detail. The evaluated staining quality scores range from 1 to 4, where 4 is for perfect, 3 for very good, 2 for acceptable, and 1 for unacceptable. The mean and standard deviation values of these scores for each metric were calculated across all the 100 test sample fields-of-view (FOVs) and all four pathologists (n = 100 × 4 = 400). b Violin plots showing the distribution of cellularity scores evaluated using all the 100 test FOVs. The evaluated cellularity scores range from 1 to 4, where 4 is for a remarkably high cell count, 3 for a substantial number of cells, 2 for a fair number of cells, and 1 for a low cell count. Source data are provided as a Source Data file.

Similar articles

Cited by

References

    1. Khare, P. Prevalence of Lung Lesions at Autopsy: A Histopathological Study. JCDR10.7860/JCDR/2017/24747.9827 (2017). - PMC - PubMed
    1. Singh D, et al. A Comprehensive Review of Pathological Examination in Forensic Medicine: Past, Present, and Future. Cureus. 2022;14:e22740. - PMC - PubMed
    1. Molina DK, Wood LE, Frost RE. Is Routine Histopathologic Examination Beneficial in All Medicolegal Autopsies? Am. J. Forensic Med. Pathol. 2007;28:1. - PubMed
    1. Howat WJ, Wilson BA. Tissue fixation and the effect of molecular fixatives on downstream staining procedures. Methods. 2014;70:12–19. - PMC - PubMed
    1. Khoury T. Delay to formalin fixation alters morphology and immunohistochemistry for breast carcinoma. Appl Immunohistochem. Mol. Morphol. 2012;20:531–542. - PubMed