. 2024 Feb 23;14(1):113.
doi: 10.1038/s41398-024-02832-z.

Effect of antipsychotic drugs on group II metabotropic glutamate receptor expression and epigenetic control in postmortem brains of schizophrenia subjects

Affiliations

Effect of antipsychotic drugs on group II metabotropic glutamate receptor expression and epigenetic control in postmortem brains of schizophrenia subjects

Jon DelaCuesta-Barrutia et al. Transl Psychiatry. .

Abstract

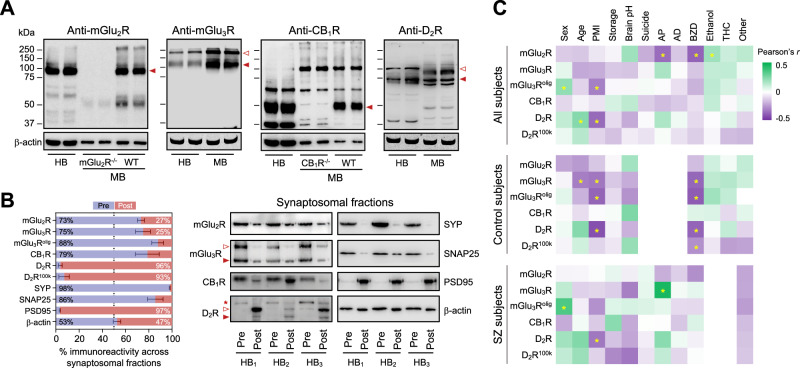
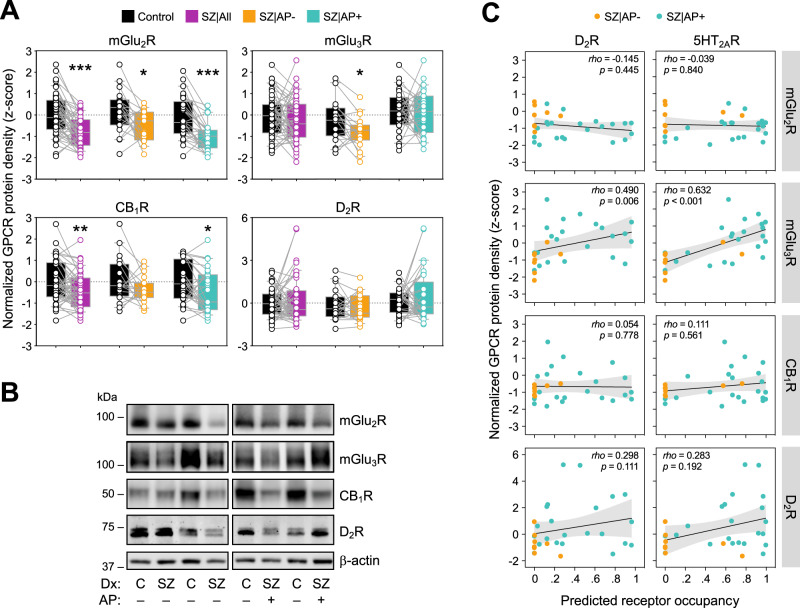
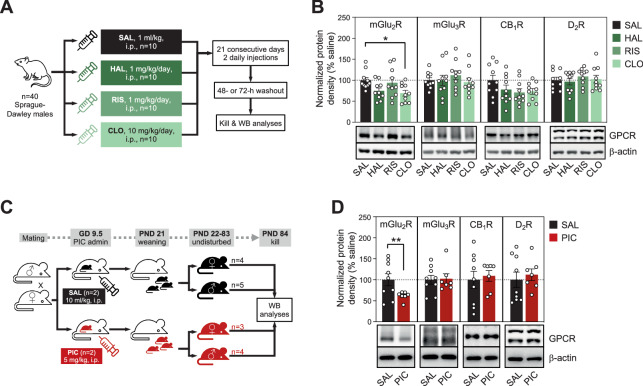
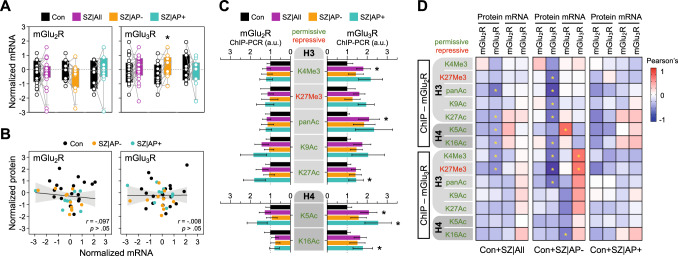
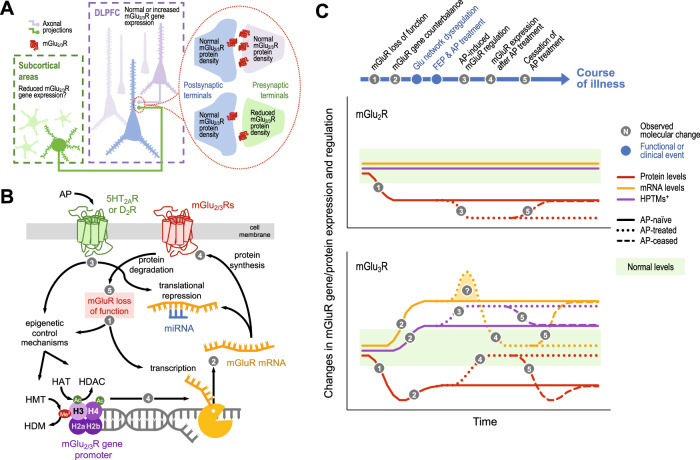
Antipsychotic-induced low availability of group II metabotropic glutamate receptors (including mGlu2R and mGlu3R) in brains of schizophrenia patients may explain the limited efficacy of mGlu2/3R ligands in clinical trials. Studies evaluating mGlu2/3R levels in well-designed, large postmortem brain cohorts are needed to address this issue. Postmortem samples from the dorsolateral prefrontal cortex of 96 schizophrenia subjects and matched controls were collected. Toxicological analyses identified cases who were (AP+) or were not (AP-) receiving antipsychotic treatment near the time of death. Protein and mRNA levels of mGlu2R and mGlu3R, as well as GRM2 and GRM3 promoter-attached histone posttranslational modifications, were quantified. Experimental animal models were used to compare with data obtained in human tissues. Compared to matched controls, schizophrenia cortical samples had lower mGlu2R protein amounts, regardless of antipsychotic medication. Downregulation of mGlu3R was observed in AP- schizophrenia subjects only. Greater predicted occupancy values of dopamine D2 and serotonin 5HT2A receptors correlated with higher density of mGlu3R, but not mGlu2R. Clozapine treatment and maternal immune activation in rodents mimicked the mGlu2R, but not mGlu3R regulation observed in schizophrenia brains. mGlu2R and mGlu3R mRNA levels, and the epigenetic control mechanisms did not parallel the alterations at the protein level, and in some groups correlated inversely. Insufficient cortical availability of mGlu2R and mGlu3R may be associated with schizophrenia. Antipsychotic treatment may normalize mGlu3R, but not mGlu2R protein levels. A model in which epigenetic feedback mechanisms controlling mGlu3R expression are activated to counterbalance mGluR loss of function is described.


Conflict of interest statement

WGH is a consultant with AbbVie, Newron, and Translational Life Sciences. Other authors do not have any financial disclosures to report.

Figures

Fig. 1
Fig. 1. Antibody validation and evaluation of potentially confounding variables.
A Characterization of the four antibodies selected for quantification of mGlu2 (ab15672), mGlu3 (ab166608), CB1 (ab23703), and D2 (AB5084P) receptors (see Supplemental Table S3) in human and rodent brains, and validation in Grm2 (mGlu2R−/−) and Cnr1 (CB1R−/−) knockout mice. Images show representative immunoblots of human (HB), and wildtype (WT) or knockout mouse (MB) cortical samples loaded in duplicate onto SDS gels, and resolved by standard SDS-PAGE, followed by immunoprobing with the above commercial antibodies. Closed arrowheads indicate those immunoreactive bands considered selective; i.e., bands approaching the theoretical molecular size of the protomeric form of each GPCR, and absent in target knockout mice [knockout validation of anti-mGlu3R and -D2R antibodies was published elsewhere [30, 31]]. Open arrowheads indicate other bands putatively corresponding to oligomeric (mGlu3Rolig) or glycosylated (D2R100k) species of the receptors, and were also considered for quantitative assays based on previous validation studies [30, 31]. All membranes were stripped and reprobed with anti-β-actin antibody as a loading control. Molecular masses (in kDa) of SDS-PAGE prestained standards are shown on the left. B Horizontal bar plots (left) and immunoblots (right) depicting the distribution of the indicated protein species across the pre-(Pre; blue) and post-(Post; red) synaptic synaptosomal fractions isolated from postmortem human DLPFC of three different control subjects (HB1/2/3). The selective (or preferential) detection of synaptophysin (SYP) and synaptosomal-associated protein of 25 kDa (SNAP25) at the presynaptic fraction, and postsynaptic density 95 (PSD95) at the postsynaptic fraction, account for the purity of the subcellular compartments. Closed and open red arrowheads indicate the same as in A. The red asterisk in D2R immunoblot points at a putative presynaptic D2R species of ~150 kDa not consistently observed in crude homogenates, and was not further evaluated. C Heatmap representing Pearson’s r-coefficients of the pairwise associations between the potentially confounding variables of the study (displayed along the x-axis; AD antidepressants, AP antipsychotics, BZD benzodiazepines, PMI postmortem interval, THC tetrahydrocannabinol) and the studied GPCR immunodensities (displayed along the y-axis) in postmortem samples of the DLPFC from subjects with schizophrenia (SZ) and controls, combined altogether (top panel) or segregated by diagnosis (middle and bottom panels). Color scale on the r-values is shown on the top-right corner. *p < 0.05.
Fig. 2
Fig. 2. Immunodensiities of target GPCRs in schizophrenia brain samples.
A Box plots representing β-actin-normalized mGlu2R, mGlu3R, CB1R, and D2R immunodensities in the DLPFC of age-, sex- and PMI-matched pairs of schizophrenia (SZ) cases and controls, either altogether (All) or stratified by the absence (AP-) or presence (AP + ) of antipsychotic drugs in the blood sample of the SZ subject pair at the time of death. Paired t-tests detected significant differences (*p < 0.05, **p < 0.01, ***p < 0.001) between the diagnostic groups for mGlu2R (All, t1,47 = 5.66; AP-, t1,17 = 2.63; AP + , t1,29 = 5.41), mGlu3R (AP-, t1,17 = 2.27), and CB1R (All, t1,47 = 2.98; AP + , t1,29 = 2.70). B Representative mGlu2R, mGlu3R, CB1R, and D2R immunoblots depicting samples from all diagnosis (Dx) and toxicological (AP− and AP + ) comparison groups. Molecular mass (in kDa) of the most proximal prestained protein marker (Bio-Rad) to the target proteins is indicated on the left. C Scatterplots depicting pairwise associations between the predicted occupancy values of D2R and 5HT2AR, as estimated from drug concentrations in cerebellum samples, and the immunodensities of mGlu2R, mGlu3R, CB1R, and D2R in the DLPFC of SZ subjects. Fit line, as well as rho- and p-values of the Spearman correlation test are shown for each analysis.
Fig. 3
Fig. 3. Immunodensities of target GPCRs in rodent brains following antipsychotic treatments and prenatal poly(I:C) exposure.
A Cartoon illustrating chronic treatment procedures with saline (SAL), haloperidol (HAL), risperidone (RIS), and clozapine (CLO) in rats and further Western blot (WB) analyses. B Effects of antipsychotic chronic treatments on cortical immunodensities of mGlu2R, mGlu3R, CB1R and D2R. Bars represent mean ± SEM values of each treatment group. One-way ANOVA detected significant differences between treatment groups for mGlu2R densities (F3,36 = 3.29). *p < 0.05, ANOVA followed by Dunnett’s post hoc test. C Cartoon illustrating the polyinosinic–polycytidylic acid- (PIC) induced maternal immune activation (MIA) procedure in pregnant dams, as compared to saline (SAL) administration, and further WB analyses in the adult offspring. D Effects of prenatal exposure to PIC-induced MIA on cortical immunodensities of mGlu2R, mGlu3R, CB1R and D2R in adult mice. Bars represent mean ± SEM values of SAL- or PIC-exposed groups of mice. Student t-test detected significant differences between treatment groups for mGlu2R densities (t1,14 = 2.27; *p < 0.05).
Fig. 4
Fig. 4. Gene expression and epigenetic regulation of mGlu2R and mGlu3R in the DLPFC of age-, sex- and PMI-matched pairs of schizophrenia (SZ) cases and controls, either altogether (All) or stratified by the absence (AP−) or presence (AP+) of antipsychotic drugs in the blood sample of the SZ subject pair at the time of death.
A Box plots representing housekeeping gene-normalized levels of mGlu2R and mGlu3R mRNA (in arbitrary units [a.u.]). Paired t-tests detected significant differences (*p < 0.05) between the diagnosis groups for mGlu3R mRNA (AP-, t1,11 = 2.49), (B) Scatterplots depicting pairwise associations between mRNA levels and the corresponding immunodensities of mGlu2R or mGlu3R in the same DLPFC samples of control (Con) and SZ subjects. Fit line, as well as r- and p-values of the Pearson’s correlation test are shown for each analysis. C Bar plots representing the load of trimethylated (Me3) and/or acetylated (Ac; including pan-acetylated, panAc) lysine (K) residues of histones H3 (top plots) and H4 (bottom plots) attached to the promoter regions of the mGlu2R (left bars) or mGlu3R (right bars) coding genes (estimated by ChIP followed by qPCR assays [ChIP-PCR], and represented in percent from input values). Paired t-tests detected significant differences (*p < 0.05) between the diagnosis groups for the load of H3K4Me3 (All, t1,18 = 2.69), H3panAc (All, t1,19 = 2.13), H3K27Ac (AP + , t1,9 = 2.81), H4K5Ac (All, t1,18 = 2.17; AP + , t1,9 = 2.71), and H4K16Ac (AP + , t1,9 = 2.68) attached to the mGlu3R (but not mGlu2R) gene. No overall similarities were observed between the load of HPTMs at the mGlu2/3R and GAPDH (used for housekeeping purposes [20]) genes, which may account for the specificity of the current results. D Heatmap representing pairwise associations between protein or mRNA levels of mGlu2R or mGlu3R (on the x-axis), and the amounts of HPTMs at histones H3 or H4 associated with the mGlu2R or mGlu3R gene promoters (on the y-axis) in the same DLPFC samples of control and SZ subjects altogether (Con+SZ|All), or stratified by the absence (Con+SZ|AP-) or presence (Con+SZ|AP+) of antipsychotic drugs. Color scale on the r-values is shown on the top-right corner. *FDR-adjusted p < 0.05.
Fig. 5
Fig. 5. Graphical contextualization of the present data.
A Cartoon illustrating a possible explanation of the observed changes in mGlu2/3R mRNA and protein cortical amounts from a neuroanatomical perspective. B Schematic flow diagram depicting the potential molecular mechanisms involved in the regulation of mGlu2/3R protein and mRNA expression in the DLPFC of schizophrenia subjects, and possible effects of antipsychotic (AP) medication on the regulatory pathway via 5HT2AR and/or D2R. Numbered circles correspond to the hypothetical, stepwise changes described in C. HAT histone acetyl transferase, HDAC histone deacetylase, HDM histone demethylase, HMT histone methyl transferase, miRNA microRNA. C Hypothetical model illustrating cortical changes in protein (red lines) and mRNA (yellow lines) expression, as well as epigenetic regulation at histone posttranslational modifications (PTMs; purple lines), of mGlu2R (top plot) and mGlu3R (bottom plot) over the course of schizophrenia development and illness progression, including effects of AP medication (dotted lines), following first-episode psychosis (FEP).

Similar articles

Cited by

References

    1. Dogra S, Conn PJ. Metabotropic glutamate receptors as emerging targets for the treatment of schizophrenia. Mol Pharmacol. 2022;101:275–85. doi: 10.1124/molpharm.121.000460. - DOI - PMC - PubMed
    1. Krystal JH, Anticevic A. Toward illness phase-specific pharmacotherapy for schizophrenia. Biol Psychiatry. 2015;78:738–40. doi: 10.1016/j.biopsych.2015.08.017. - DOI - PubMed
    1. Nakahara T, Tsugawa S, Noda Y, Ueno F, Honda S, Kinjo M, et al. Glutamatergic and GABAergic metabolite levels in schizophrenia-spectrum disorders: a meta-analysis of (1)H-magnetic resonance spectroscopy studies. Mol Psychiatry. 2022;27:744–57. doi: 10.1038/s41380-021-01297-6. - DOI - PubMed
    1. Kinon BJ, Millen BA, Zhang L, McKinzie DL. Exploratory analysis for a targeted patient population responsive to the metabotropic glutamate 2/3 receptor agonist pomaglumetad methionil in schizophrenia. Biol Psychiatry. 2015;78:754–62. doi: 10.1016/j.biopsych.2015.03.016. - DOI - PubMed
    1. Marek GJ. When is a Proof-of-Concept (POC) not a POC? Pomaglumetad (LY2140023) as a case study for antipsychotic efficacy. Curr Pharm Des. 2015;21:3788–96. doi: 10.2174/1381612821666150605105632. - DOI - PubMed