

Quantitative description of six fish species' gut contents and prey abundances in the Baltic Sea (1968-1978)
- PMID: 38396055
- PMCID: PMC10891096
- DOI: 10.1038/s41597-024-03075-9
Quantitative description of six fish species' gut contents and prey abundances in the Baltic Sea (1968-1978)
Abstract
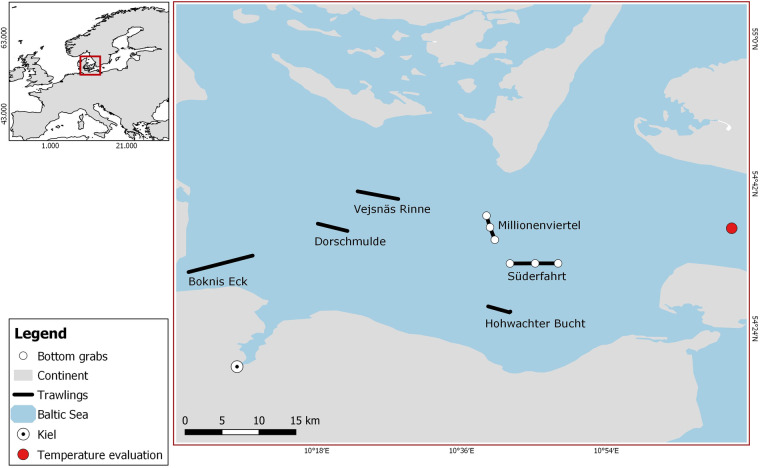
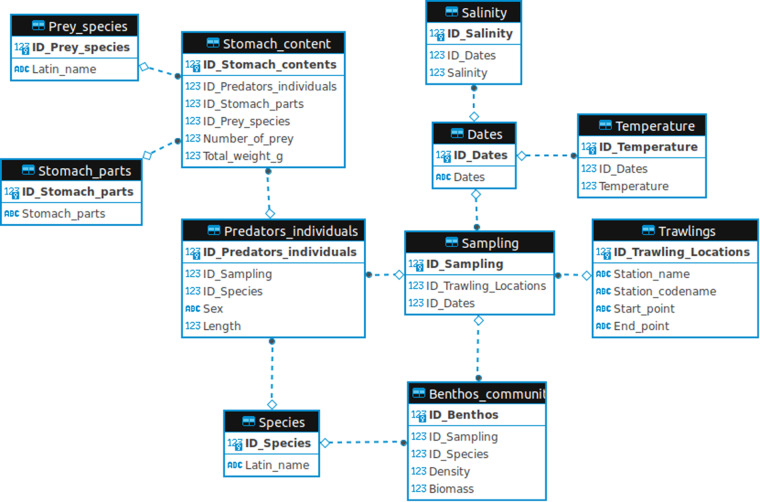
The dataset presents a compilation of stomach contents from six demersal fish species from two functional groups inhabiting the Baltic Sea. It includes detailed information on prey identities, body masses, and biomasses recovered from both the fish's digestive systems and their surrounding environment. Environmental parameters, such as salinity and temperature levels, have been integrated to enrich this dataset. The juxtaposition of information on prey found in stomachs and in the environment provides an opportunity to quantify trophic interactions across different environmental contexts and investigate how fish foraging behaviour adapts to changes in their environment, such as an increase in temperature. The compilation of body mass and taxonomic information for all species allows approaching these new questions using either a taxonomic (based on species identity) or functional trait (based on body mass) approach.
© 2024. The Author(s).
Conflict of interest statement
The authors declare no competing interests.
Figures


References
-
- Brown JH, Gillooly JF, Allen AP, Savage VM, West GB. Toward a Metabolic Theory of Ecology. Ecology. 2004;85:1771–1789. doi: 10.1890/03-9000. - DOI
-
- O’Gorman EJ, et al. A simple model predicts how warming simplifies wild food webs. Nat. Clim. Change. 2019;9:611–616. doi: 10.1038/s41558-019-0513-x. - DOI
Publication types
MeSH terms
Grants and funding
- DFG-FZT 118, 202548816/Deutsche Forschungsgemeinschaft (German Research Foundation)
- DFG-FZT 118, 202548816/Deutsche Forschungsgemeinschaft (German Research Foundation)
- DFG-FZT 118, 202548816/Deutsche Forschungsgemeinschaft (German Research Foundation)
- DFG-FZT 118, 202548816/Deutsche Forschungsgemeinschaft (German Research Foundation)
- DFG-FZT 118, 202548816/Deutsche Forschungsgemeinschaft (German Research Foundation)
LinkOut - more resources
Full Text Sources
