. 2024 Feb 23;8(1):45.
doi: 10.1038/s41698-024-00532-x.

UroPredict: Machine learning model on real-world data for prediction of kidney cancer recurrence (UroCCR-120)

Affiliations

UroPredict: Machine learning model on real-world data for prediction of kidney cancer recurrence (UroCCR-120)

Gaëlle Margue et al. NPJ Precis Oncol. .

Abstract

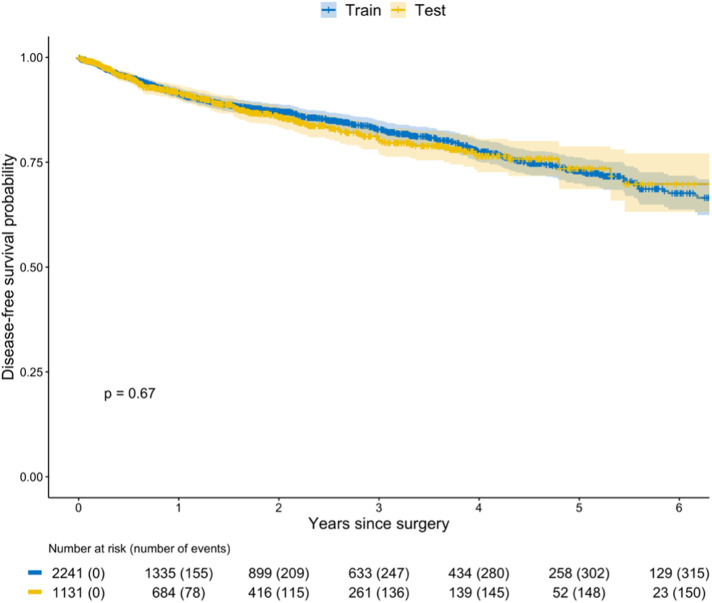
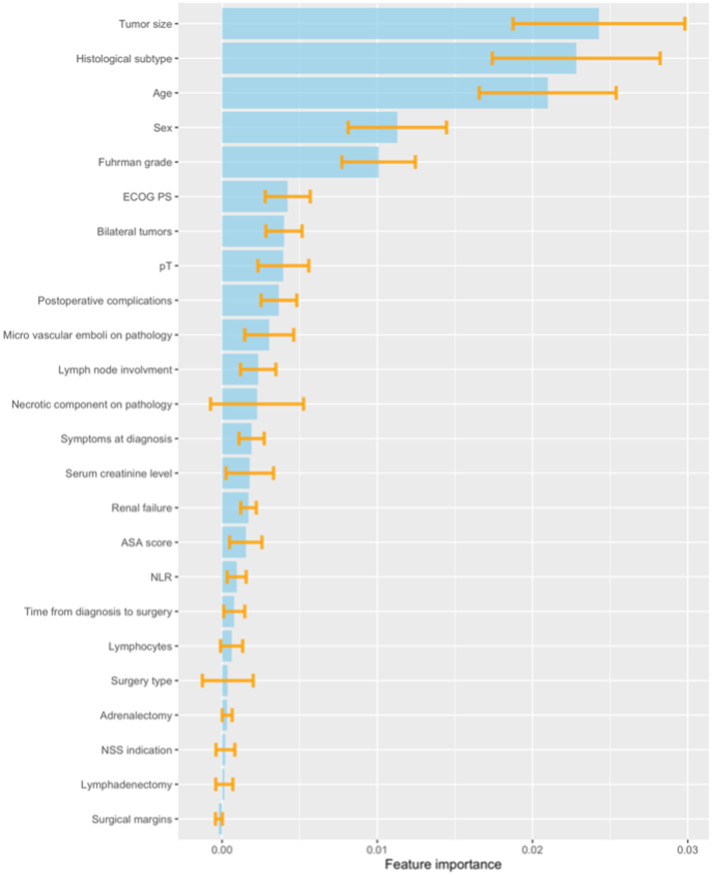
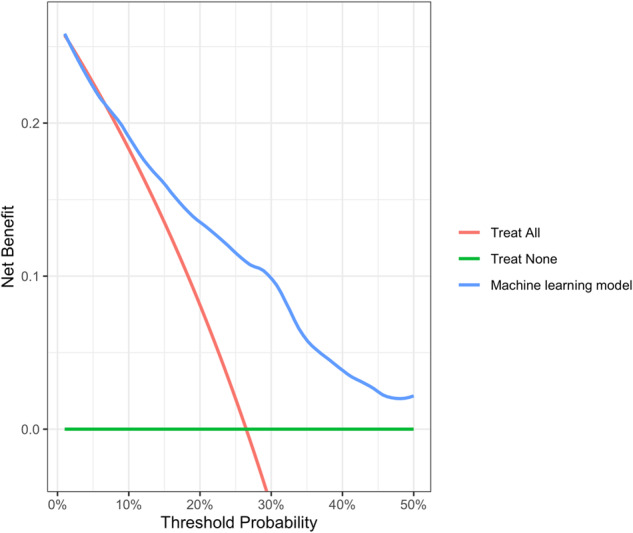
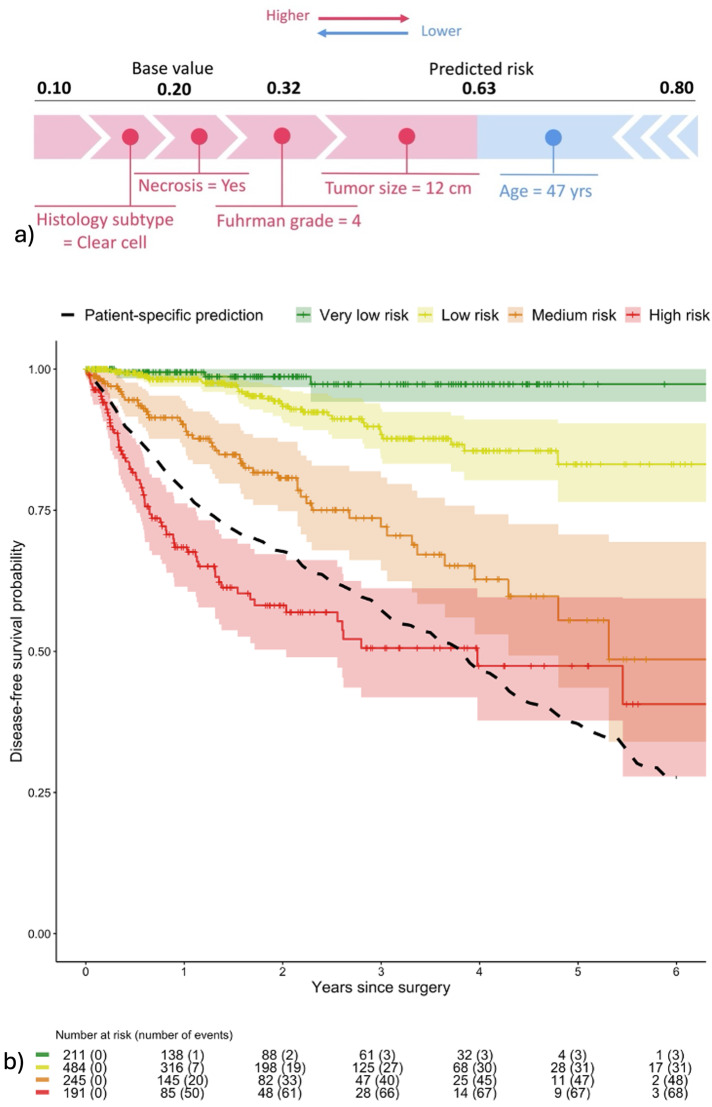
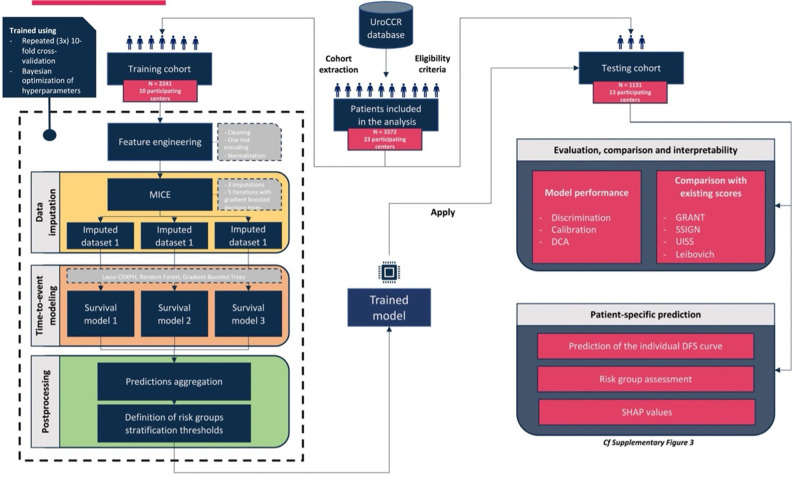
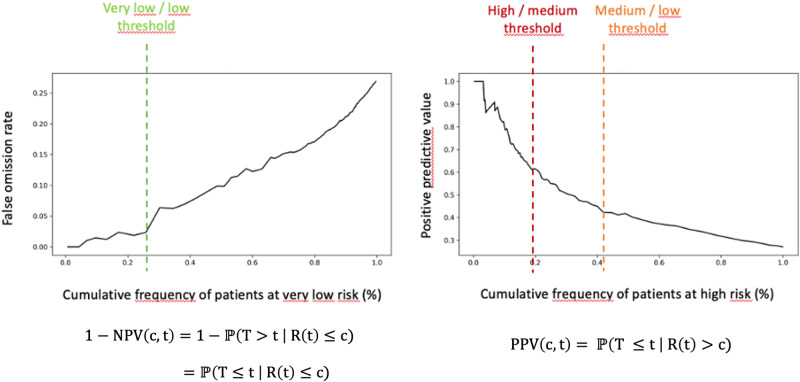
Renal cell carcinoma (RCC) is most often diagnosed at a localized stage, where surgery is the standard of care. Existing prognostic scores provide moderate predictive performance, leading to challenges in establishing follow-up recommendations after surgery and in selecting patients who could benefit from adjuvant therapy. In this study, we developed a model for individual postoperative disease-free survival (DFS) prediction using machine learning (ML) on real-world prospective data. Using the French kidney cancer research network database, UroCCR, we analyzed a cohort of surgically treated RCC patients. Participating sites were randomly assigned to either the training or testing cohort, and several ML models were trained on the training dataset. The predictive performance of the best ML model was then evaluated on the test dataset and compared with the usual risk scores. In total, 3372 patients were included, with a median follow-up of 30 months. The best results in predicting DFS were achieved using Cox PH models that included 24 variables, resulting in an iAUC of 0.81 [IC95% 0.77-0.85]. The ML model surpassed the predictive performance of the most commonly used risk scores while handling incomplete data in predictors. Lastly, patients were stratified into four prognostic groups with good discrimination (iAUC = 0.79 [IC95% 0.74-0.83]). Our study suggests that applying ML to real-world prospective data from patients undergoing surgery for localized or locally advanced RCC can provide accurate individual DFS prediction, outperforming traditional prognostic scores.


Conflict of interest statement

The authors declare no competing interests.

Figures

Fig. 1
Fig. 1. Kaplan–Meier estimates of disease-free survival stratified by train and test datasets.
DFS curve of the train cohort (in blue) and of the test cohort (in yellow) were similar (p = 0.67).
Fig. 2
Fig. 2. Permutation-based feature importance of the developed ML model.
ECOG Eastern Cooperative Oncology Group performance status, NLR Neutrophils to Lymphocytes Ratio; ASA American Society of Anesthesiologists score; NSS Nephron-Sparing Surgery.
Fig. 3
Fig. 3. Decision curve.
Decision curve for prediction of recurrence risk within 5 years after surgery. The green curve assumes no patient will recur. The red curve assumes all patients will recur. The blue curve is associated with the use of machine learning model. The graph shows the expected net benefit for a range of threshold probabilities. The expected net benefit corresponds to the number of patients for every 100 patients who were correctly predicted with recurrence, without increasing the number of false positive predictions. The machine learning model showed better net benefit than the competing decisions for all the plausible threshold probabilities, comprised between 10% and 50%.
Fig. 4
Fig. 4. Interpretability tools.
a SHAP value. Individual risk of recurrence within five years after surgery explained using SHAP values for a patient. The average estimated risk in the train population (base value) is 20%. Individual risk prediction for the patient is higher, at 63%, with features in red that increase the patient’s risk of recurrence and features in blue that decrease it. b Risk groups' stratification. Actual disease-free survival in the test cohort (n = 1131) according to the stratified risk score. 211 (18.7%) were classified as very low risk, 484 (42.8%) patients at low risk, 245 (21.7%) patients at medium risk and 191 (16.9%) patients at high risk of recurrence within 5 years following the surgery. The black curve represents the predicted survival curve for the patient in (a).
Fig. 5
Fig. 5. Workflow for machine learning model (ML) development and evaluation.
Two thousand two hundred and forty-one patients from 10 centers were randomly assigned to the training cohort. Missing data were multiply imputed and several time-to-event models were trained. The best trained model was then externally validated on the testing cohort of 1131 patients from 13 different centers and compared with existing risk scores.
Fig. 6
Fig. 6. Negative predictive value and positive predictive value at 5 years on the training cohort.
Determination of the stratification thresholds on the training cohort. The left-side Figure shows the false omission rate (equivalent to 1—Negative Predictive Value) at five years according to various decision thresholds. The right-side Figure shows the positive predictive value at five years according to various decision thresholds. The machine learning model provides a relapse risk for all horizon times t that have been seen in the training dataset. For our use case, we decided to set t to 5 years as it is the standard horizon clinicians would consider building surveillance plan for their patients. Our primary goal is to find a significant group of patients with a very low risk of recurrence at 5 years. To do so, we decided to plot the false omission rate as a function of the cumulative frequency of patients in the very low-risk group by varying the risk threshold. We define our very low risk threshold such as there is a significant increase in the false omission rate. We can then use a similar strategy with the positive predictive value (PPV) to determine a high-risk group of patients. We look for PPV “plateau” to determine the risk thresholds. This method is reused to differentiate medium and low-risk groups.

Similar articles

Cited by

References

    1. Bukavina L, et al. Epidemiology of renal cell carcinoma: 2022 update. Eur. Urol. 2022;82:529–542. doi: 10.1016/j.eururo.2022.08.019. - DOI - PubMed
    1. Sung H, et al. Global Cancer Statistics 2020: GLOBOCAN estimates of incidence and mortality worldwide for 36 cancers in 185 countries. CA Cancer J. Clin. 2021;71:209–249. doi: 10.3322/caac.21660. - DOI - PubMed
    1. Ferlay J, et al. Cancer incidence and mortality patterns in Europe: Estimates for 40 countries and 25 major cancers in 2018. Eur. J. Cancer. 2018;103:356–387. doi: 10.1016/j.ejca.2018.07.005. - DOI - PubMed
    1. Ljungberg B, et al. European association of urology guidelines on renal cell carcinoma: the 2022 update. Eur. Urol. 2022;82:399–410. doi: 10.1016/j.eururo.2022.03.006. - DOI - PubMed
    1. Kane CJ, Mallin K, Ritchey J, Cooperberg MR, Carroll PR. Renal cell cancer stage migration: analysis of the National Cancer Data Base. Cancer. 2008;113:78–83. doi: 10.1002/cncr.23518. - DOI - PubMed