. 2024 Mar;31(3):335-347.
doi: 10.1038/s41418-024-01260-2. Epub 2024 Feb 23.

Exposure of the inner mitochondrial membrane triggers apoptotic mitophagy

Affiliations

Exposure of the inner mitochondrial membrane triggers apoptotic mitophagy

Tahnee L Saunders et al. Cell Death Differ. 2024 Mar.

Abstract

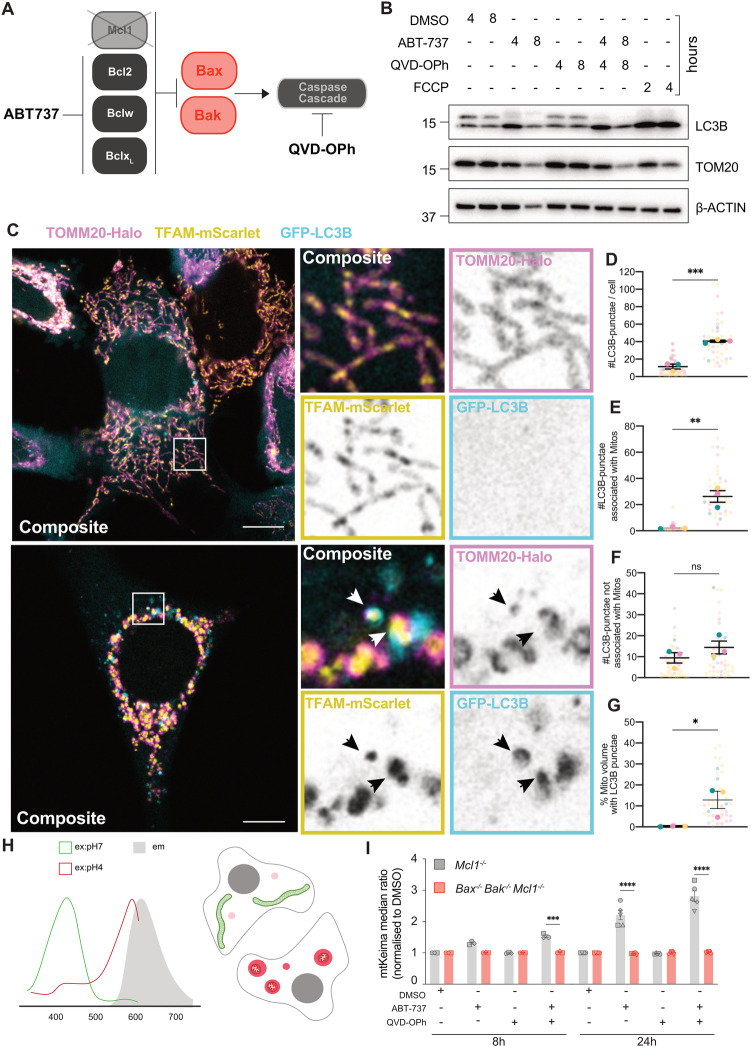
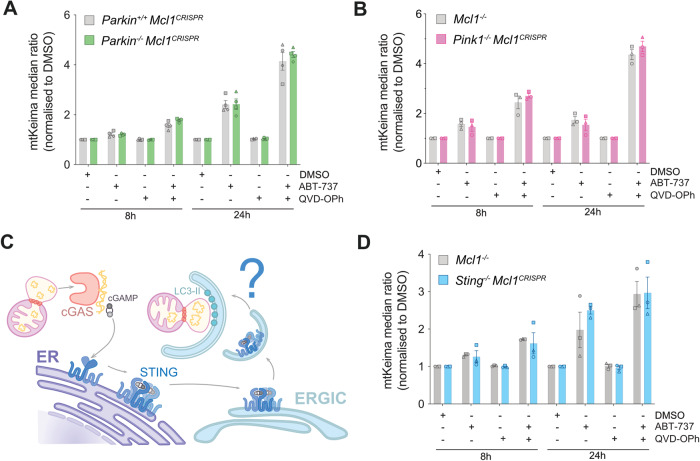
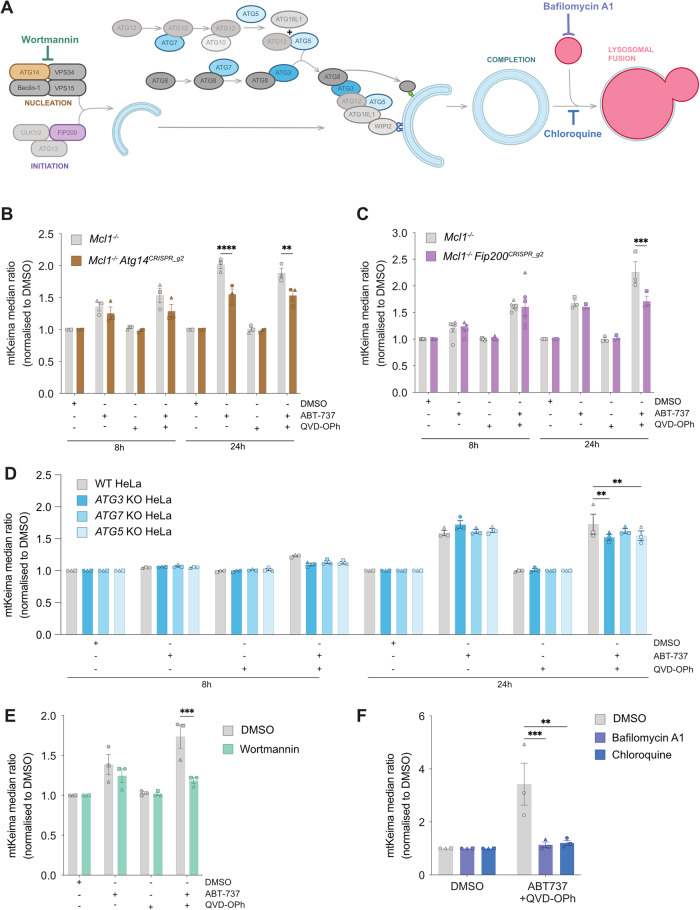
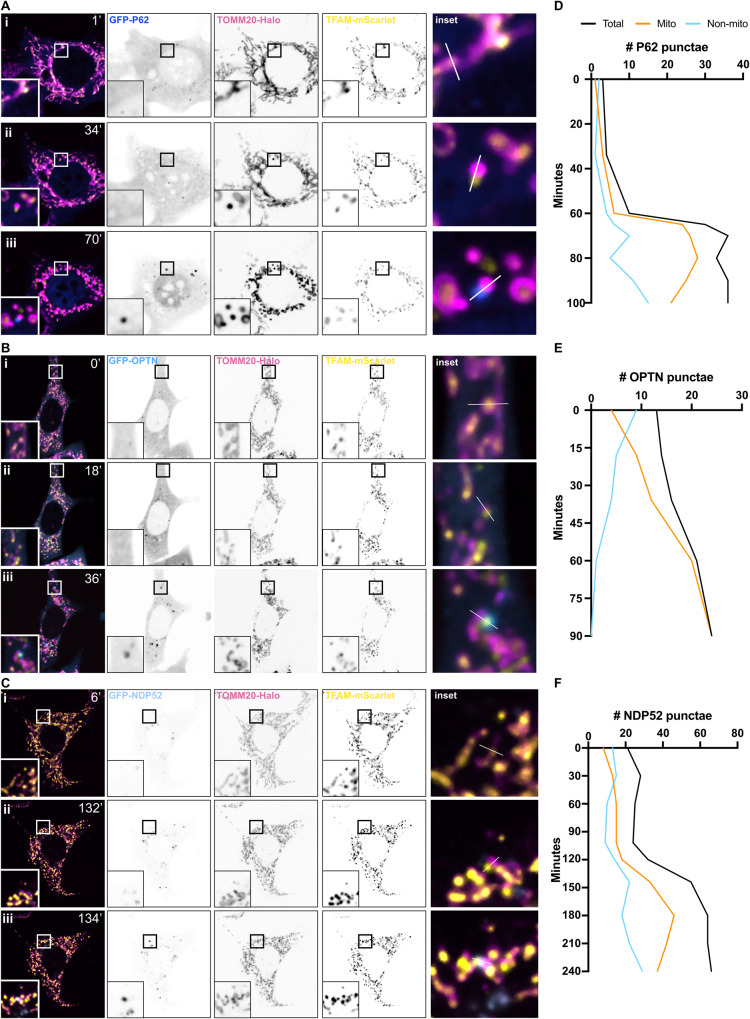
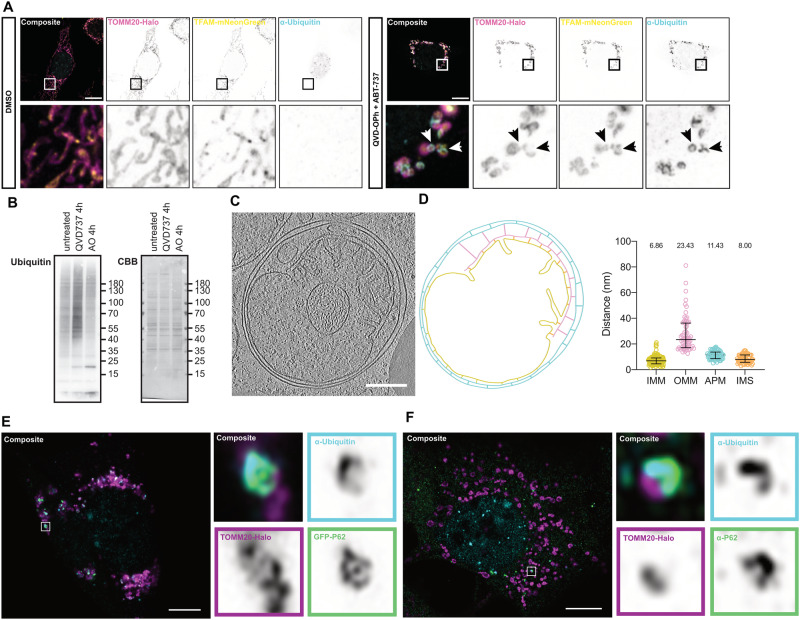
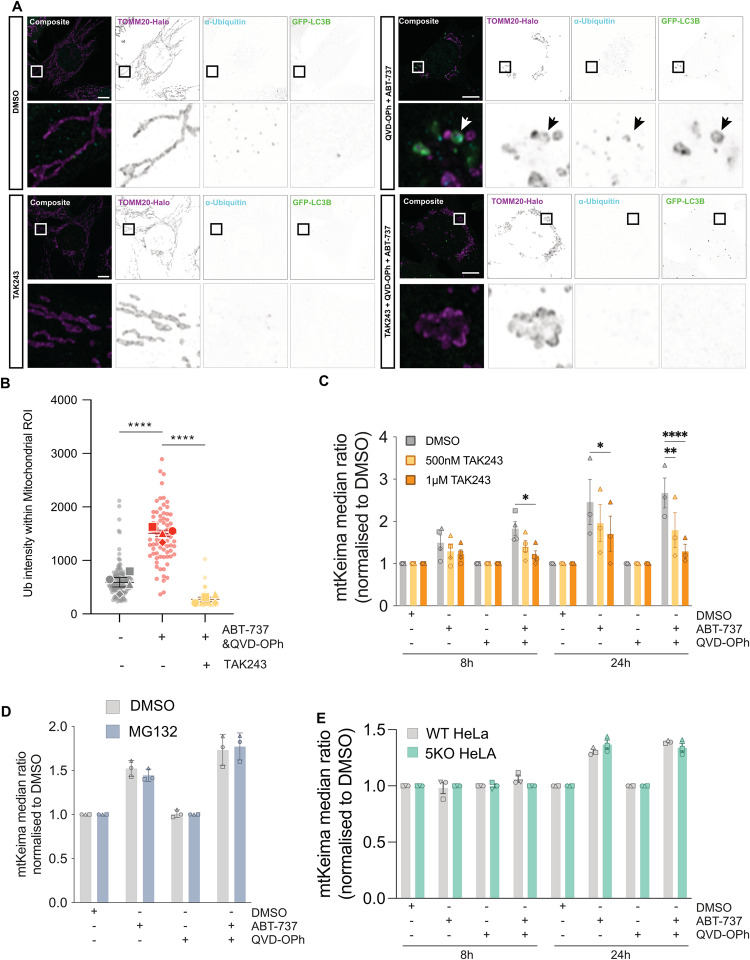
During apoptosis mediated by the intrinsic pathway, BAX/BAK triggers mitochondrial permeabilization and the release of cytochrome-c, followed by a dramatic remodelling of the mitochondrial network that results in mitochondrial herniation and the subsequent release of pro-inflammatory mitochondrial components. Here, we show that mitochondrial herniation and subsequent exposure of the inner mitochondrial membrane (IMM) to the cytoplasm, initiates a unique form of mitophagy to deliver these damaged organelles to lysosomes. IMM-induced mitophagy occurs independently of canonical PINK1/Parkin signalling and is driven by ubiquitination of the IMM. Our data suggest IMM-induced mitophagy is an additional safety mechanism that cells can deploy to contain damaged mitochondria. It may have particular relevance in situations where caspase activation is incomplete or inhibited, and in contexts where PINK1/Parkin-mitophagy is impaired or overwhelmed.


Conflict of interest statement

ML is a member of the scientific advisory board and co-founder of Automera.

Figures

Fig. 1
Fig. 1. Mitophagy occurs during apoptosis.
A Schematic of experimental model of intrinsic apoptosis induction, utilising Mcl1−/− MEFs treated with the BH3 mimetic ABT-737, with or without the pan-caspase inhibitor QVD-OPh. B Mcl1−/− MEFs were treated with ABT-737 [1 µM] ± QVD-OPh [20 µM], FCCP [30 µM], or DMSO vehicle control for indicated times and assessed by immunoblot for TOMM20, LC3B, and β-ACTIN as a loading control. Representative of n = 4 independent experiments. C Mcl1−/− MEFs expressing TOMM20-Halo (stained with JF646, pink), TFAM-mScarlet (yellow), and GFP-LC3B (cyan) were treated for 4 h with DMSO vehicle control or ABT-737 [1 µM] and QVD-OPh [20 µM] and imaged live by Airyscan confocal imaging. Insets to the right, including single channels. Black arrows indicate herniated mitochondria associated with LC3B-puncta. D–G Quantification of Airyscan images of Mcl1−/− MEFs expressing TOM20-Halo, TFAM-mScarlet, and GFP-LC3B shown in (C). D Number of LC3B-puncta per cell. E Number of LC3B-puncta associated with mitochondria. F Number of LC3B-puncta not associated with mitochondria. G The percentage of mitochondrial volume associated with LC3B puncta. Data is represented as n = 3 independent experiments where larger opaque large circles show average of each independent experiment, and smaller transparent circles represent individual cells (n = 10-20) within experiments. Circles are coloured to match individual cells with their experiment average. *p < 0.05, **p < 0.01 Paired student’s T-test. H Schematic of mKeima fluorescence excitation, which is dependent on pH, with the same emission. I Analysis of Mcl1−/− or Bax−/−Bak−/−Mcl1−/− MEFs expressing mtKeima, treated with DMSO, ABT-737 [1 µM] ± QVD-OPh [20 µM] for 8 h and 24 h, plotted as mean ± SEM, n = 3 independent experiments, paired data from the same experiment are represented by the same symbol shape. Statistical tests were performed as follows, D–G Unpaired Student’s t-test, *p < 0.05, **p < 0.01, ***p < 0.001. I Two-way ANOVA with Tukey correction for multiple comparisons, *p < 0.05, **p < 0.01, ****< 0.0001. Comparisons only performed between cell lines for each condition, only significant differences have been annotated on figure.
Fig. 2
Fig. 2. Mitophagy during apoptosis occurs independent of PINK1/Parkin mitophagy and STING-induced autophagy.
Flow cytometry ratio analysis of Mcl1−/− MEFs expressing mtKeima, lacking either Parkin, PINK1, or STING, and treated with DMSO, ABT-737 [1 µM] ± QVD-OPh [20 µM] for 8 h or 24 h. Data representation of mtKeima median ratio change, normalised to DMSO (A) Parkin+/+Mcl1CRISPR and Parkin−/−Mcl1CRISPR (B) Mcl1−/− and Pink1−/−Mcl1CRISPR. C Schematic representation of how mtDNA release may activate STING-induced autophagy. D Mcl1−/− and Sting−/−Mcl1CRISPR, data representation of mtKeima median ratio change, normalised to DMSO. Bars represent mean ± SEM, n = 3 independent experiments, paired data from the same experiment are represented by the same symbol shape.
Fig. 3
Fig. 3. Mitophagy during apoptosis utilises canonical autophagosome formation mechanisms.
A Schematic of autophagosome formation steps, and involved machinery, as well as pharmacological inhibitors of this process. Flow cytometry ratio analysis of Mcl1−/− MEFs expressing mtKeima, lacking either (B) ATG14 or (C) FIP200, and treated with DMSO, ABT-737 [1 µM] ± QVD-OPh [20 µM] for 8 h or 24 h. D Flow cytometry ratio analysis of WT HeLas expressing mtKeima and lacking either ATG3, ATG7, or ATG5, and treated with DMSO, ABT-737 [1 µM] ± QVD-OPh [20 µM] for 8 h or 24 h. Flow cytometry ratio analysis of Mcl1−/− MEFs expressing mtKeima, treated with DMSO, ABT-737 [1 µM] ± QVD-OPh [20 µM] in combination with (E) Wortmannin [1 µM] for 4 h, or (F) Bafilomycin A1 [25 nM] or Chloroquine [100 µM] for 16 h. Data is median ratio after treatment, normalised to DMSO control. Data are presented as mean ± SEM, n = 3 independent experiments, with paired data from the same experiment represented by the same symbol shape. Statistical tests were performed as follows, B–D Two-way ANOVA with Tukey correction for multiple comparisons, *p < 0.05, **p < 0.01, ****p < 0.0001, E Unpaired Student’s t-test, *p < 0.05 F Ordinary One-way ANOVA with Tukey correction for multiple comparisons, *p < 0.05.
Fig. 4
Fig. 4. Autophagy adaptor proteins, P62, OPTN, and NDP52, are recruited to herniating mitochondria.
Snapshots of live-cell spinning disk microscopy imaging of Mcl1−/− MEFs expressing TOMM20-Halo (stained with JF646) (pink), TFAM-mScarlet (yellow) and, either A GFP-P62 (dark blue), B GFP-OPTN (blue), or (C) GFP-NDP52 (pale blue). Cells were pre-treated with QVD-OPh [20 µM] and imaging began after the addition of ABT-737 [1 µM]. Panel (i) shows timepoint zero T0, immediately after addition of ABT-737, (ii) timepoint designated T2 immediately after mitochondrial herniation, and (iii) timepoint designated T3, upon clear recruitment of autophagy adaptor protein to herniated mitochondria. D–F Kinetic analysis of number of GFP puncta associated with mitochondrial signals. See also Movies 2, 3 and 4.
Fig. 5
Fig. 5. The herniated inner mitochondrial membrane is ubiquitinated, and acts as a site for formation of engulfing autophagosome.
A Airyscan confocal imaging of Mcl1−/− MEFs expressing TOMM20-Halo (stained with JF646) (pink) and TFAM-mNeonGreen (yellow) treated with either DMSO or QVD-OPh [20 µM] + ABT-737 [1 µM] for 4 h and stained for conjugated ubiquitin (light blue). B Mcl1−/− MEFs were exposed to ABT-737 [1 µM] and QVD-OPh [20 µM] or Antimycin A [4 µM] and Oligomycin [10 µM] for 4 h, and crude mitochondrial isolates from these cells were then assessed by SDS-PAGE for Ubiquitin. CBB Coomassie brilliant blue. C Slice of cryo-FIB-tomogram of herniating mitochondria enveloped in an autophagosome. D Outline of tomogram, OMM (pink), IMM (yellow), autophagosome (light blue), including distances measured between membranes, quantified in right panel. E Airyscan confocal imaging of Mcl1−/− MEFs expressing TOMM20-Halo (stained with JF646) (pink) and GFP-P62 (green) treated with QVD-OPh [20 µM] + ABT-737 [1 µM] for 4 h and stained for conjugated ubiquitin (light blue). Insets to the right show one herniating mitochondria. F Airyscan confocal imaging of Mcl1−/− MEFs expressing TOMM20-Halo (stained with JF646) (pink) treated with QVD-OPh [20 µM] + ABT-737 [1 µM] for 4 h and stained for conjugated ubiquitin (light blue) and endogenous P62 (green). Insets to the right show one herniating mitochondria. A, E, F Scale bar is 10 µM.
Fig. 6
Fig. 6. Ubiquitin of inner mitochondrial membrane is essential for apoptotic mitophagy.
A Airyscan confocal imaging of Mcl1−/− MEFs expressing TOMM20-Halo (stained with JF646) (pink) and GFP-LC3B (green) treated with either DMSO, QVD-OPh [20 µM] + ABT-737 [1 µM], TAK243 [1 µM], TAK243 [1 µM] + QVD-OPh [20 µM] + ABT-737 [1 µM], for 2 h and stained for conjugated ubiquitin (light blue). B Quantification of ubiquitin signal intensity present within mitochondrial region of interest. C Flow cytometry ratio analysis of Mcl1−/− MEFs expressing mtKeima, treated for 8 h, or 24 h with DMSO, ABT-737 [1 µM] ± QVD-OPh [20 µM] in combination with increasing doses of TAK243 [500 nM and 1 µM]. D Flow cytometry ratio analysis of Mcl1−/− MEFs expressing mtKeima, treated for 8 h, or 24 h with DMSO, ABT-737 [1 µM] ± QVD-OPh [20 µM] in combination with MG132 [1 µM]. E Flow cytometry ratio analysis of WT and Penta KO HeLas expressing mtKeima treated for 8 h, or 24 h with DMSO, ABT-737 [1 µM] + S63845 [2 µM] ± QVD-OPh [20 µM]. Statistical tests were performed as follows, B One-way ANOVA with Tukey correction for multiple comparisons, ****p < 0.0001. C–E Two-way ANOVA with Tukey correction for multiple comparisons, **p < 0.01, ***p < 0.001, ****p < 0.0001.

References

    1. Uoselis L, Nguyen TN, Lazarou M. Mitochondrial degradation: mitophagy and beyond. Mol Cell. 2023;83:3404–20. doi: 10.1016/j.molcel.2023.08.021. - DOI - PubMed
    1. Moehlman AT, Youle RJ. Mitochondrial quality control and restraining innate immunity. Annu Rev Cell Dev Biol. 2020;36:265–89. doi: 10.1146/annurev-cellbio-021820-101354. - DOI - PubMed
    1. Nakatogawa H, Ichimura Y, Ohsumi Y. Atg8, a ubiquitin-like protein required for autophagosome formation, mediates membrane tethering and hemifusion. Cell. 2007;130:165–78. doi: 10.1016/j.cell.2007.05.021. - DOI - PubMed
    1. Noda NN, Ohsumi Y, Inagaki F. Atg8‐family interacting motif crucial for selective autophagy. FEBS Lett. 2010;584:1379–85. doi: 10.1016/j.febslet.2010.01.018. - DOI - PubMed
    1. Okatsu K, Kimura M, Oka T, Tanaka K, Matsuda N. Unconventional PINK1 localization to the outer membrane of depolarized mitochondria drives Parkin recruitment. J Cell Sci. 2015;128:964–78. - PMC - PubMed

Publication types