. 2024 Apr;27(4):728-736.
doi: 10.1038/s41593-024-01586-7. Epub 2024 Feb 23.

Dopamine projections to the basolateral amygdala drive the encoding of identity-specific reward memories

Affiliations

Dopamine projections to the basolateral amygdala drive the encoding of identity-specific reward memories

Ana C Sias et al. Nat Neurosci. 2024 Apr.

Abstract

To make adaptive decisions, we build an internal model of the associative relationships in an environment and use it to make predictions and inferences about specific available outcomes. Detailed, identity-specific cue-reward memories are a core feature of such cognitive maps. Here we used fiber photometry, cell-type and pathway-specific optogenetic manipulation, Pavlovian cue-reward conditioning and decision-making tests in male and female rats, to reveal that ventral tegmental area dopamine (VTADA) projections to the basolateral amygdala (BLA) drive the encoding of identity-specific cue-reward memories. Dopamine is released in the BLA during cue-reward pairing; VTADA→BLA activity is necessary and sufficient to link the identifying features of a reward to a predictive cue but does not assign general incentive properties to the cue or mediate reinforcement. These data reveal a dopaminergic pathway for the learning that supports adaptive decision-making and help explain how VTADA neurons achieve their emerging multifaceted role in learning.


Conflict of interest statement

COMPETING FINANCIAL INTERESTS

The authors declare no biomedical financial interests or potential conflicts of interest.

Figures

Extended Data Figure 1.
Extended Data Figure 1.. BLA neurons are active during cue-reward encoding.
To characterize the endogenous activity of BLA neurons, we used fiber photometry to record fluorescent activity of the genetically encoded calcium indicator GCaMP6f in the BLA of male and female rats. (a) Top: Representative fluorescent image of GCaMP6f expression and fiber placement in the BLA. Bottom: Fiber photometry approach for bulk calcium imaging in BLA neurons. (b) Schematic representation of GCaMP6f expression and placement of optical fiber tips in BLA for all subjects. (c) Pavlovian long-delay conditioning procedure schematic. CS, 30-s conditioned stimulus (aka, “cue”, white noise or click) followed immediately by reward outcome (O, sucrose solution or grain pellet). (d) Food-port entry rate during the cue relative to the preCue baseline period, averaged across the 2 cues for each Pavlovian conditioning session. Across training, rats developed a Pavlovian conditional approach response of entering the food-delivery port during cue presentation. Two-way RM ANOVA Training × Cue: F(2.44, 17.07) = 7.97, P = 0.002; Training: F(3.30, 23.10) = 4.85, P = 0.008; Cue: F(1, 7) = 80.33, P < 0.0001. *P < 0.05, **P < 0.01. N = 8, 4 male rats. (e-f) BLA neurons are active during the encoding of cue-reward memories. BLA neurons were robustly activated both at cue onset and offset when the outcome was delivered. Cue onset responses beginning on the first conditioning sessions have been detected previously. These novelty responses rapidly attenuate if the stimuli are not associated with reward. (e) Quantification of maximal (peak) GCaMP6f Z-score ΔF/F during the 5-s period following cue onset or outcome delivery compared to the equivalent baseline period immediately prior to cue onset. Two-way RM ANOVA Training × Event: F(2.52, 17.61) = 3.94, P = 0.03; Event: F(1.39, 9.71) = 58.63, P < 0.0001; Training F(1.71, 11.97) = 2.30, P = 0.15. (f) GCaMP6f fluorescence changes (Z-score ΔF/F) in response to cue presentation (blue) and outcome delivery across days of training. Tick marks represent time of outcome collection for each subject. Data from the last six sessions were averaged across 2-session bins (3/4, 5/6, and 7/8). N = 8, 4 male rats. Data presented as trial-averaged, between-subject mean ± s.e.m. with individual data points. *P<0.05, **P<0.01, ***P<0.001 Bonferroni-corrected post-hoc comparisons. Consistent with prior evidence, BLA neurons are activated by rewards and their predictors. BLA activation is particularly robust when the cues can become linked to the identifying features of the rewards they predict. Although these data likely reflect both somatic and non-somatic calcium activity, they are consistent with prior electrophysiological evidence that BLA neurons respond to reward during learning.
Extended Data Figure 2.
Extended Data Figure 2.. Dopamine release in BLA during cue-reward learning across each of the 8 Pavlovian conditioning sessions.
(a) GRABDA2h fluorescence changes (Z-score) in response to cue presentation (blue) and reward delivery across each of the 8 Pavlovian conditioning sessions. (b) Quantification of BLA GRABDA Z-scored signal AUC during the 2-s period following cue onset or reward delivery compared to the equivalent baseline period immediately prior to cue onset. Two-way RM ANOVA Event: F(1.85, 11.07) = 4.90, P = 0.03; Training: F(2.34, 14.03) = 1.13, P = 0.36; Training × Event: F(3.45, 20.99) = 0.59, P=0.65. *P < 0.05, relative to preCue baseline, Bonferroni correction. N = 7, 4 male rats. (c) GRABDA fluorescence changes (Z-score) in response to cue presentation and reward delivery across each of the 8 Pavlovian conditioning sessions. (d) Quantification of BLA GRABDA Z-scored signal AUC during the 1.5-s period following cue onset, cue offset (trace interval), or reward delivery compared to the equivalent baseline period immediately prior to cue onset. Two-way RM ANOVA Event: F(2.06, 14.40) = 13.24, P = 0.0005; Training: F(3.62, 25.33) = 2.43, P = 0.08; Training × Event: F(3.60, 25.17) = 2.60, P = 0.07. *P < 0.05, **P < 0.01, ***P < 0.001, relative to preCue baseline, Bonferroni correction. (GRABDA2h: N = 3, 2 male; GRABDA2m: N = 5, 3 male). The slope of the BLA dopamine reward response across training was significantly negative (β = −0.13, confidence interval −0.25 – −0.007; F(1,62) = 4.49, P = 0.04) and signifantly different (F(1,124) = 13.33, P = 0.0004) from the slope of the BLA dopamine cue-onset response across training, which was significantly positive (β = 0.13, confidence interval 0.06 – 0.20; F(1,62) = 13.53, P = 0.0005). Data presented as trial-averaged, between-subject mean ± s.e.m. with individual data points. *P<0.05, **P<0.01, ***P<0.001 Bonferroni-corrected post-hoc comparisons.
Extended Data Figure 3:
Extended Data Figure 3:. GRABDA responses to reward collection.
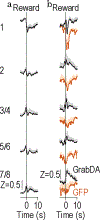
(a) GRABDA2h fluorescence changes (Z-score) in response to reward collection across Pavlovian long-delay conditioning. Data from the last six sessions were averaged across 2-session bins (3/4, 5/6, and 7/8). N = 9, 5 male rats. (b) GRABDA fluorescence changes (Z-score) in response to reward collection across Pavlovian trace conditioning. Data from the last six sessions were averaged across 2-session bins (3/4, 5/6, and 7/8). GRABDA2h: N = 4, 3 male; GRABDA2m: N = 6, 3 male. Data presented as trial-averaged, between-subject mean ± s.e.m. with individual data points.
Extended Data Figure 4:
Extended Data Figure 4:. GRABDA responses to unpredicted rewarding and aversive events.
(a) GRABDA fluorescence changes (Z-score) in response to unpredicted delivery of 1, 2, or 3 food pellets. (b) Quantification of BLA GRABDA Z-scored signal AUC during the 20-s period following pellet delivery. Two-way RM ANOVA Reward period × Magnitude: F(1.92, 11.50) = 12.46, P = 0.001; Magnitude: F(1.94, 11.66) = 11.04, P = 0.002; Reward: F(1, 6) = 7.86, P =0.03. GRABDA2h : N = 2, 2 male; GRABDA2m : N = 5, 3 male (c) GRABDA fluorescence changes (Z-score) in response to unpredicted puff of air to the face. (d) Quantification of BLA GRABDA Z-scored trace AUC during the 5-s period following airpuff delivery relative to 5-s preAirpuff baseline. Two-tailed paired sample t-test t(7) = 5.88, P = 0.0006. GRABDA2h: N = 2, 2 male; GRABDA2m: N = 6, 3 male. Data presented as trial-averaged, between-subject mean ± s.e.m. with individual data points. *P<0.05, ***P<0.001 Bonferroni-corrected post-hoc comparisons.
Extended Data Figure 5.
Extended Data Figure 5.. Inhibition of VTADA→BLA projections does not disrupt reward collection during Pavlovian conditioning.
There was no effect of optical inhibition of VTADA→BLA projections at reward delivery on collection of the food outcomes. (a) Entries into the food-delivery port during the 30-s periods before and after cue presentation during Pavlovian long-delay conditioning. Rats entered the food-delivery port during the 30-s postcue/reward-delivery period more than the preCue baseline period and similarly between groups. Training × Period: F(4.94,93.85) = 3.00, P = 0.02; Training: F(3.13, 59.48) = 8.51, P < 0.0001; Period: F(1,19) = 72.60, P < 0.0001; Virus: F(1,19) = 0.47, P = 0.50; Training × Virus: F(7,133) = 0.65, P = 0.72; Virus × Period: F(1,19) = 0.87, P = 0.36; Training × Virus × Period: F(7,133) = 0.71, P = 0.66. ArchT, N = 11, 6 male rats; tdTomato, N = 10, 5 male rats. (b) Percent time spent in the food-delivery port during the 10-s preCue baseline and 10-s postCue offset (including trace interval and reward delivery period) periods during Pavlovian trace conditioning. Rats entered the food-delivery port during the 10-s postCue period more than the preCue period and similarly between groups. Training × Period: F(1.93,19.27) = 9.68, P = 0.001; Training: F(2.59, 25.88) = 9.28, P = 0.0004; Period: F(1,10) = 138.50, P < 0.0001; Virus: F(1,10) = 14.94, P = 0.003; Training × Virus: F(4, 40) = 1.35, P = 0.27; Virus × Period: F(1,10) = 1.37, P = 0.27; Training × Virus × Period: F(4, 40) = 0.05, P = 0.996. ArchT, N = 5, 4 male rats; Control, N = 7, 4 male rats (3 WT/cre-dependent ArchT; 4 Th-cre/cre-dependent tdTomato). Data presented as trial-averaged, between-subject mean ± s.e.m. with individual data points. *P<0.05, **P<0.01, ***P<0.001 Bonferroni-corrected post-hoc comparisons.
Extended Data Figure 6.
Extended Data Figure 6.. Optical inhibition of VTADA→BLA projections throughout cue and reward during learning attenuates the encoding of identity-specific cue-reward memories.
We cre-dependently expressed ArchT bilaterally in VTADA neurons of male and female Th-cre rats and implanted optical fibers bilaterally over BLA. (a) Bottom: Representative fluorescent image of cre-dependent ArchT-tdTomato expression in VTA cell bodies with coexpression of Th in Th-Cre rats. Middle: Strategy for bilateral optogenetic inhibition of VTADA axons and terminals in the BLA of Th-cre rats. Top: Representative image of fiber placement in the vicinity of immunofluorescent ArchT-tdTomato-expressing VTADA axons and terminals in the BLA. (b) Schematic representation of cre-dependent ArchT-tdTomato expression in VTA and (c) placement of optical fiber tips in BLA for all subjects. For half of the control group, we expressed cre-dependent tdTomato in the VTA of Th-cre male and female rats. For the other half, wildtype rats were infused with cre-dependent ArchT (which did not express owing to the lack of cre recombinase) into the VTA. Both groups received bilateral optical fibers above the BLA. Thus, we control for light delivery, viral expression, and genotype. There were no significant behavioral differences between each type of control (lowest P: F(1, 6) = 1.61, P = 0.25). (d) Procedure. A, action (left or right lever press); CS, 30-s conditioned stimulus (aka, “cue”, white noise or click) followed immediately by reward outcome (O, sucrose solution or grain pellet). (e) Rats first received 11 sessions of instrumental conditioning, without manipulation, in which one of two different lever-press actions each earned one of two distinct food rewards (e.g., left press→sucrose/right press→pellets). Lever-press rate averaged across levers and across the final 2 instrumental conditioning sessions. Two-tailed independent sample t-test t(13) = 1.20, P = 0.25. (f) Rats then received Pavlovian conditioning. During each of the 8 Pavlovian conditioning sessions, each of 2 distinct, 30-s, auditory cues was presented 8 times and terminated in the delivery of one of the food rewards (e.g., white noise—sucrose/click—pellets). VTADA→BLA projections were optically inhibited (532 nm, 10 mW, 33 s) during the entirety of each cue-reward period. Light turned on at the onset of each cue and off 3 s following reward delivery. Optical inhibition of VTADA→BLA projections through the cue and reward period did not disrupt development of a Pavlovian conditional goal-approach response. Food-port entry rate during the cue relative to the preCue baseline period, averaged across trials and across the 2 cues for each Pavlovian conditioning session. Thin lines represent individual subjects. Three-way RM ANOVA Training × CS: F(3.30, 42.87) = 20.69, P < 0.0001; CS: F(1, 13) = 295.60, P < 0.0001; Training: F(3.03.,39.42) = 4.13, P = 0.01; Virus: F(1,13) = 1.61, P = 0.23; Training × Virus: F(7,91) = 0.37, P = 0.92; Virus × Cue: F(1,13) = 3.05, P = 0.10; Training × Virus × CS: F(7,91) = 2.17, P = 0.04. By the end of training both groups showed similar elevation in food-port approach during the cues. (g-i) We next gave subjects an outcome-specific Pavlovian-to-instrumental transfer (PIT) test, without manipulation. Controls learned the identity-specific cue-reward memories as evidenced by their ability to use the cues to selectively elevate pressing on the lever associated with the same outcome as predicted by the cue. Conversely, the cues were not capable of guiding lever-press choice in the group for which VTADA→BLA projections were inhibited during Pavlovian conditioning. Rather, for these subjects, the cues caused a general increase in pressing across both levers. (g) Lever-press rates during the preCue baseline periods compared to press rates during the cue periods separated for presses on the lever that, in training, delivered the same outcome as predicted by the cue (Same) and pressing on the other available lever (Different). Three-way RM ANOVA Virus × Lever × Cue: F(1, 13) = 7.35, P =0.02; Virus: F(1, 13) = 4.59, P = 0.05; Lever: F(1, 13) = 5.76, P = 0.03; Cue: F(1, 13) = 58.87, P < 0.0001; Virus × Lever: F(1, 13) = 1.91, P = 0.19; Virus × Cue: F(1, 13) = 12.00, P = 0.004; Lever × Cue period: F(1, 13) = 7.56, P = 0.02. *P<0.05, **P < 0.01, planned comparisons cue same presses v. preCue same presses and cue different presses v. preCue different presses. Inhibition of VTADA→BLA projections during cue-reward learning prevents subjects from learning identity-specific cue-reward memories, but does not prevent the assignment of general incentive properties to the cues that supports non-discriminate cue-induced motivation. (h) Elevation in lever presses on the Same lever [(Same lever presses during cue)/(Same presses during cue + Same presses during preCue)], relative to the elevation in pressing on the Different lever [(Different lever presses during cue)/(Different presses during cue + Different presses during preCue)], averaged across cues during the PIT test. Two-way RM ANOVA Virus: F(1, 13) = 2.21, P = 0.16; Lever: F(1, 13) = 1.67, P = 0.22; Virus × Lever: F(1, 13) = 1.14, P = 0.30. (i) As in training, during the PIT test the conditional goal-approach response was similar between groups, further indicating that even longer duration inhibition of VTADA→BLA projections during cue-reward learning does not disrupt development of conditional responses. Food-port entry rate during the cues relative to the preCue baseline periods, averaged across cues during the PIT test. Two-way RM ANOVA Cue: F(1, 13) = 44.71, P < 0.0001; Virus: F(1, 13) = 0.08, P = 0.79; Virus × Cue: F(1, 13) = 0.61, P = 0.45. *P < 0.05, **P < 0.01, ***P < 0.001, Bonferroni correction. ArchT, N = 7, 4 male rats; Control N = 8, 4 Th-cre/tdTomato 2 male rats, 4 wildtype cre-dependent ArchT 2 male rats. Data presented as trial-averaged, between-subject mean ± s.e.m. with individual data points. *P<0.05, **P<0.01, ***P<0.001 Bonferroni-corrected post-hoc comparisons. These data confirm that VTADA→BLA projections are needed to link the identifying details of the reward to a predictive cue, but not to reinforce a conditional response or to assign general incentive properties to the cue to support general motivation.
Extended Data Figure 7.
Extended Data Figure 7.. Stimulation of VTADA→BLA projections does not affect reward collection during compound conditioning.
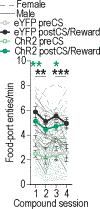
There was no effect of optical stimulation of VTADA→BLA projections paired with reward delivery on collection of the food outcomes. Rats entered the food-delivery port during the 30-s postCue/reward-delivery period more than the preCue baseline period and similarly between groups. Three-way RM ANOVA Period: F(1, 22) = 46.80, P < 0.0001; Training: F(1.50, 32.90) = 3.70, P = 0.047; Virus: F(1, 22) = 1.89, P = 0.18; Training × Virus: F(3, 66) = 1.48, P = 0.23; Training × Period: F(2.55, 56.04) = 0.22, P = 0.85; Virus × Period: F(1, 22) = 0.04, P = 0.84; Training × Virus × Period: F(3, 66) = 0.51, P = 0.68. *P < 0.05, **P < 0.01 relative to preCue baseline, Bonferroni correction. ChR2, N = 11, 6 male rats; eYFP, N = 13, 6 male rats. Data presented as trial-averaged, between-subject mean ± s.e.m. with individual data points. *P<0.05, **P<0.01, ***P<0.001 Bonferroni-corrected post-hoc comparisons.
Extended Data Figure 8.
Extended Data Figure 8.. Stimulation of VTADA→BLA projections is not reinforcing.
To assess the reinforcing properties of VTADA→BLA activation, rats were given 2 sessions of intracranial self-stimulation (ICSS) in a context different from that of prior conditioning. Nose pokes in the active port triggered 1-s blue light delivery (473 nm; 10 mW; 25 ms pulse width; 20 Hz). Data show total active nose pokes compared to inactive nose pokes across 2, 1-hr ICSS sessions. Activation of VTADA→BLA projections was not reinforcing. Rats expressing ChR2 showed similar levels of active nose pokes as the eYFP control group in the first session and this decreased to the level of the inactive nose pokes in the second session. Three-way RM ANOVA Session × Virus × Nose poke: F(1, 22) = 5.00, P = 0.04; Virus × Nose poke: F(1, 22) = 5.18, P = 0.03; Session × Virus: F(1,22) = 5.18, P = 0.03; Session × Nose poke: F(1, 22) = 1.24, P = 0.28; Session: F(1, 22) = 3.05, P = 0.09; Virus: F(1, 22) = 1.94, P = 0.18; Nose poke: F(1, 22) = 54.66, P < 0.0001. Elevated active v. inactive port nose poking in both the eYFP and ChR2 groups could have resulted from the prior association formed between blue light and reward delivery during compound conditioning. If true, then this could have extinguished by the second session in the ChR2 group, potentially indicating that VTADA→BLA projection activity during either initial learning or online during the ICSS session may contribute to the reward expectation and/or learning processes that contribute to extinction. Alternatively, the nose poking in both groups could reflect salience of the light delivery, which could habituate more quickly in the ChR2 group. ChR2, N = 11, 6 male rats; eYFP, N = 13, 6 male rats. Data presented as trial-averaged, between-subject mean ± s.e.m. with individual data points. **P<0.01, ***P<0.001 Bonferroni-corrected post-hoc comparisons.
Figure 1.
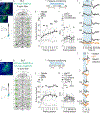
Figure 1.. Dopamine is released in the BLA during cue-reward learning.
(a-f) Fiber photometry recording of BLA dopamine release during Pavlovian long-delay conditioning. (a) Top: Representative fluorescent image of BLA GRABDA2h expression and fiber placement. Bottom: Fiber photometry approach for imaging GRABDA fluorescence changes in BLA neurons. (b) Schematic representation of BLA GRABDA2h expression and optical fiber tips for all subjects. Brain slides from. (c) Pavlovian long-delay conditioning procedure. CS, 30-s conditioned stimulus (aka, “cue”, white noise or click) followed immediately by reward outcome (O, sucrose solution or grain pellet). (d) Food-port entry rate during Pavlovian conditioning. Two-way RM ANOVA, Training × Cue: F(2.77, 22.15) = 14.69, P < 0.0001. (e) Area under the BLA GRABDA Z-scored curve (AUC). Two-way RM ANOVA, Event: F(1.83, 14.61) = 7.63, P = 0.006. (f) GRABDA fluorescence changes (Z-score) across Pavlovian conditioning. Ticks represent time of reward collection for each subject. Data from the last six sessions were averaged across 2-session bins (3/4, 5/6, and 7/8). N = 9, 5 male rats. (g-l) Fiber photometry recording of BLA dopamine release during Pavlovian trace conditioning. (g) Top: Representative fluorescent image of BLA GRABDA expression and fiber placement. Bottom: Fiber photometry approach. (h) Schematic representation of GRABDA expression and placement of optical fiber tips in BLA for all subjects. (i) Pavlovian trace conditioning procedure. CS, 10-s conditioned stimulus (white noise or click) followed by a 1.5-s trace interval before reward outcome (O, chocolate or unflavored purified pellets). (j) Percentage of time spent in the food-port during Pavlovian conditioning. Two-way RM ANOVA, Training × Cue: F(3.21, 28.92) = 7.77, P = 0.0005. (k) BLA GRABDA Z-scored AUC across Pavlovian conditioning. Two-way RM ANOVA, Training × Event: F(2.85, 25.69) = 3.72, P = 0.03. (l) GRABDA fluorescence changes across Pavlovian conditioning. N = 10 rats (GRABDA2h: N = 4, 3 male; GRABDA2m: N = 6, 3 male). Data presented as trial-averaged, between-subject mean ± s.e.m. with individual data points. *P<0.05, **P<0.01, ***P<0.001 Bonferroni-corrected post-hoc comparisons. See Supplemental Table 1 for full statistical reporting.
Figure 2.
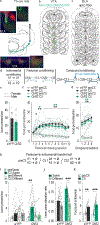
Figure 2.. Optical inhibition of VTADA→BLA projections during cue-reward pairing attenuates the encoding of identity-specific cue-reward memories.
(a-i) Optical inhibition of VTADA→BLA projections during Pavlovian long-delay conditioning with outcome-specific Pavlovian-to-instrumental transfer test. (a) Bottom: Representative fluorescent image of ArchT-tdTomato expression in VTADA neurons. Middle: Strategy for bilateral optogenetic inhibition of VTADA→BLA projections. Top: Representative image of fiber placement in the vicinity of immunofluorescent ArchT-tdTomato-expressing VTADA axons and terminals in BLA. (b) Schematic representation of ArchT-tdTomato expression in VTA and (c) placement of optical fiber tips in BLA for all subjects. (d) Pavlovian long-delay conditioning and Pavlovian-to-instrumental transfer procedure. A, action (left or right lever press); CS, 30-s conditioned stimulus (aka, “cue”, white noise or click) followed immediately by reward outcome (O, sucrose solution or grain pellet). (e) Lever-press rate averaged across levers and across the final 2 instrumental sessions. (f) Food-port entry rate during across Pavlovian conditioning. Three-way RM ANOVA, Training × Cue: F(4.09, 77.71) = 5.73, P = 0.0004. (g-i) Outcome-specific Pavlovian-to-instrumental transfer test. (g) Lever-press rates on the lever that earned the “Same” outcome as predicted by the forthcoming or current cue or on the other available lever (Different). *P < 0.05, planned comparisons cue same presses v. preCue same presses and cue different presses v. preCue different presses. (h) Elevation in pressing [(Presses during cue)/(Presses during cue + preCue presses)]. Two-way RM ANOVA, Virus × Lever: F(1, 19) = 9.22, P = 0.007. (i) Food-port entry rate. Two-way RM ANOVA, Cue: F(1, 19) = 15.18, P = 0.001. ArchT, N = 11, 6 male rats; tdTomato, N = 10, 5 male rats. (j-q) Optical inhibition of VTADA→BLA projections during Pavlovian trace conditioning with outcome-specific devaluation test. (j) Bottom: Representative fluorescent image of ArchT-tdTomato expression in VTADA neurons. Middle: Strategy for bilateral optogenetic inhibition of VTADA→BLA projections. Top: Representative image of fiber placement in the vicinity of immunofluorescent ArchT-tdTomato-expressing VTADA axons and terminals in BLA. (k) Schematic representation of ArchT-tdTomato expression in VTA and (l) placement of optical fiber tips in BLA for all subjects. (m) Pavlovian trace conditioning and outcome-specific devaluation procedure. CS, 10-s conditioned stimulus (white noise or tone) following by 1.5-s trace interval before reward outcome (O, chocolate or unflavored purified pellets); LiCl, lithium chloride 0.3M, 1.5% volume/weight. (n) Percentage of time in the food-delivery port during Pavlovian conditioning. Three-way RM ANOVA, Training × Cue: F(1.61, 16.13) = 31.49, P <0.0001. (o-p) Outcome-specific devaluation probe test. (o) Percentage of time in the food port during baseline, cue signaling the devalued reward and cue signaling the non-devalued (valued) reward. *P<0.05, **P<0.01, planned comparisons cue valued % time in port v. preCue % time in port and cue devalued % time in port v. preCue % time in port. (p) Elevation in percent time in food port [(CS % time in port)/(CS % time in port + preCue % time in port)]. Two-way RM ANOVA, Virus × Cue: F(1, 10) = 5.20, P = 0.046. (q) Amount out of 100 available pellets consumed during post-test consumption choice. Two-way RM ANOVA, Value: F(1, 10) = 249.00, P < 0.0001. ArchT, N = 5, 4 male rats; Control, N = 7, 4 male rats (3 WT/cre-dependent ArchT; 4 Th-cre/cre-dependent tdTomato). Data presented as trial-averaged, between-subject mean ± s.e.m. with individual data points. ^P = 0.059, *P<0.05, **P<0.01, ***P<0.001 Bonferroni-corrected post-hoc comparisons. See Supplemental Table 1 for full statistical reporting.
Figure 3.
Figure 3.. Previously learned cue-reward relationships block encoding of new identity-specific cue-reward memories.
(a) Procedure. A, action (left or right lever press); CS, 30-s conditioned stimulus (aka, “cue”, CSA/B: house light or flashing lights; CSC: alternating lights on either side of the chamber; CS1/CS2: white noise or click) followed immediately by reward outcome (O, sucrose solution or grain pellet). (b) Lever-press rate averaged across levers and across the final 2 instrumental conditioning sessions. (c) Food-port entry rate during visual cues Pavlovian conditioning. Three-way RM ANOVA, Training × Cue: F(4.55, 136.40) = 30.77, P < 0.0001. (d) Food-port entry rate during compound conditioning. Three-way RM ANOVA, Cue: F(1,30) = 173.60, P < 0.0001. (e-g) Auditory cue outcome-specific Pavlovian-to-instrumental transfer test. (e) Lever-press rates on the lever that earned the “Same” outcome as predicted by the forthcoming or current cue or on the other available lever (Different). Three-way RM ANOVA, Group × Cue: F(1, 30) = 4.54, P = 0.04. **P < 0.01, ***P<0.001, planned comparisons cue same presses v. preCue same presses and cue different presses v. preCue different presses. (f) Elevation in pressing [(Presses during cue)/(Presses during cue + preCue presses)]. (g) Food-port entry rate. Two-way RM ANOVA, Cue: F(1, 30) = 154.70, P < 0.0001. Blocking, N = 16, 11 male rats; Control, N = 16, 11 male rats. Data presented as trial-averaged, between-subject mean ± s.e.m. with individual data points. *P<0.05, **P<0.01, ***P<0.001 Bonferroni-corrected post-hoc comparisons. See Supplemental Table 1 for full statistical reporting.
Figure 4.
Figure 4.. Optical stimulation of VTADA→BLA projections during cue-reward pairing unblocks encoding of identity-specific cue-reward memories.
(a) Bottom: Representative fluorescent image of ChR2-eYFP expression in VTADA neurons. Middle: Strategy for bilateral optogenetic stimulation of VTADA→BLA projections. Top: Representative image of fiber placement in the vicinity of immunofluorescent ChR2-eYFP-expressing VTADA axons and terminals in the BLA. (b) Schematic representation of ChR2-eYFP expression in VTA and (c) placement of optical fiber tips in BLA for all subjects. (d) Training procedures. A, action (left or right lever press); CS, 30-s conditioned stimulus (aka, “cue”, CSA/B: house light or flashing lights; CS1/CS2: white noise or click) followed immediately by reward outcome (O, sucrose solution or grain pellet). (e) Lever-press rate averaged across levers and across the final 2 instrumental conditioning sessions. (f) Food-port entry rate during visual cue Pavlovian conditioning. Three-way RM ANOVA, Training × Cue: F(4.15, 91.32) = 25.86, P < 0.0001. (g) Food-port entry rate during compound conditioning. Three-way RM ANOVA, Training × Cue period: F(2.28, 50.21) = 9.06, P = 0.0002. (h-k) Auditory cue outcome-specific Pavlovian-to-instrumental transfer test. (h) Test procedure. (i) Lever-press rates on the lever that earned the “Same” outcome as predicted by the forthcoming or current cue or on the other available lever (Different). Three-way RM ANOVA, Virus × Lever × Cue: F(1, 22) = 4.48, P = 0.046. **P < 0.01, planned comparisons cue same presses v. preCue same presses and cue different presses v. preCue different presses. (j) Elevation in pressing [(Presses during cue)/(Presses during cue + preCue presses)].Two-way RM ANOVA, Virus × Lever: F(1, 22) = 5.72, P = 0.03. (k) Food-port entry rate. Two-way RM ANOVA, Cue: F(1, 22) = 36.10, P < 0.0001. ChR2, N = 11, 6 male rats; eYFP, N = 13, 6 male rats. Data presented as trial-averaged, between-subject mean ± s.e.m. with individual data points. *P<0.05, **P<0.01, ***P<0.001 Bonferroni-corrected post-hoc comparisons. See Supplemental Table 1 for full statistical reporting.

References

    1. Steinberg EE, et al. A causal link between prediction errors, dopamine neurons and learning. Nat Neurosci 16, 966–973 (2013). - PMC - PubMed
    1. Schultz W, Dayan P & Montague PR A neural substrate of prediction and reward. Science 275, 1593–1599 (1997). - PubMed
    1. Eshel N, Tian J, Bukwich M & Uchida N Dopamine neurons share common response function for reward prediction error. Nat Neurosci 19, 479–486 (2016). - PMC - PubMed
    1. Waelti P, Dickinson A & Schultz W Dopamine responses comply with basic assumptions of formal learning theory. Nature 412, 43–48 (2001). - PubMed
    1. Schultz W Predictive reward signal of dopamine neurons. J Neurophysiol 80, 1–27 (1998). - PubMed