. 2024 Apr;43(15):1127-1148.
doi: 10.1038/s41388-024-02974-w. Epub 2024 Feb 23.

Robustness of cancer microbiome signals over a broad range of methodological variation

Affiliations

Robustness of cancer microbiome signals over a broad range of methodological variation

Gregory D Sepich-Poore et al. Oncogene. 2024 Apr.

Erratum in

  • Correction: Robustness of cancer microbiome signals over a broad range of methodological variation.
    Sepich-Poore GD, McDonald D, Kopylova E, Guccione C, Zhu Q, Austin G, Carpenter C, Fraraccio S, Wandro S, Kosciolek T, Janssen S, Metcalf JL, Song SJ, Kanbar J, Miller-Montgomery S, Heaton R, Mckay R, Patel SP, Swafford AD, Korem T, Knight R. Sepich-Poore GD, et al. Oncogene. 2024 May;43(20):1579. doi: 10.1038/s41388-024-03018-z. Oncogene. 2024. PMID: 38580705 Free PMC article. No abstract available.

Abstract

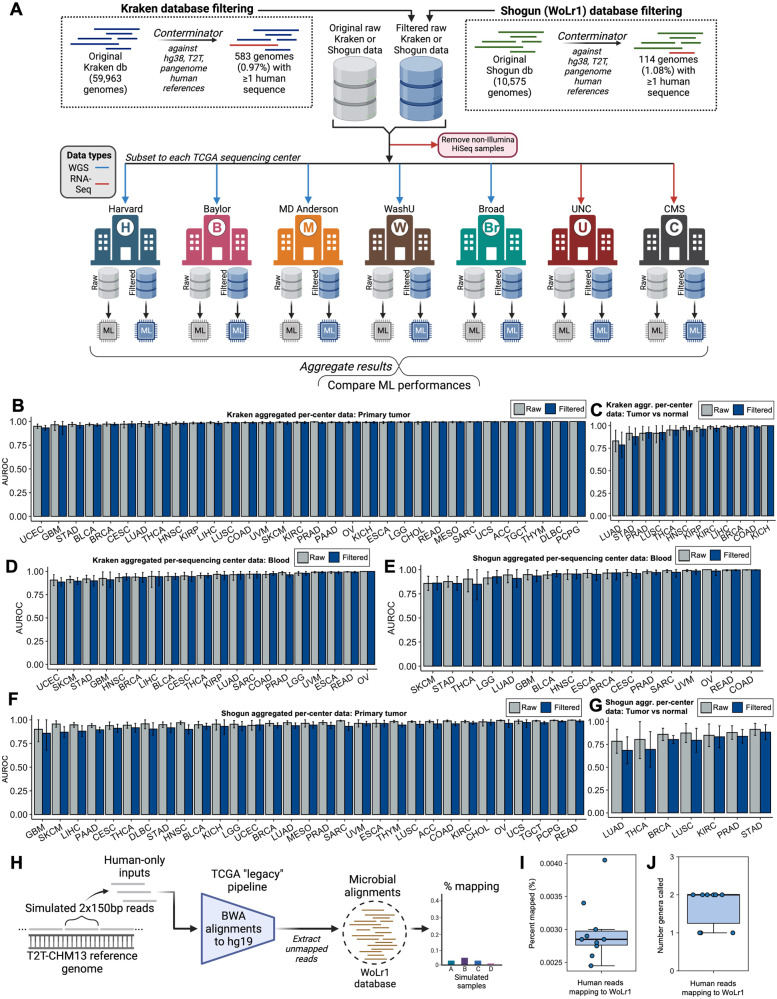
In 2020, we identified cancer-specific microbial signals in The Cancer Genome Atlas (TCGA) [1]. Multiple peer-reviewed papers independently verified or extended our findings [2-12]. Given this impact, we carefully considered concerns by Gihawi et al. [13] that batch correction and database contamination with host sequences artificially created the appearance of cancer type-specific microbiomes. (1) We tested batch correction by comparing raw and Voom-SNM-corrected data per-batch, finding predictive equivalence and significantly similar features. We found consistent results with a modern microbiome-specific method (ConQuR [14]), and when restricting to taxa found in an independent, highly-decontaminated cohort. (2) Using Conterminator [15], we found low levels of human contamination in our original databases (~1% of genomes). We demonstrated that the increased detection of human reads in Gihawi et al. [13] was due to using a newer human genome reference. (3) We developed Exhaustive, a method twice as sensitive as Conterminator, to clean RefSeq. We comprehensively host-deplete TCGA with many human (pan)genome references. We repeated all analyses with this and the Gihawi et al. [13] pipeline, and found cancer type-specific microbiomes. These extensive re-analyses and updated methods validate our original conclusion that cancer type-specific microbial signatures exist in TCGA, and show they are robust to methodology.


Conflict of interest statement

GDS-P and RK are inventors on a US patent application (PCT/US2019/059647) submitted by The Regents of the University of California and licensed by Micronoma; that application covers methods of diagnosing and treating cancer using multi-domain microbial biomarkers in blood and cancer tissues. GDS-P, RK, and SM-M are founders of and report stock interest in Micronoma. SF and SW are employees of Micronoma. GDS-P has filed several additional US patent applications on cancer bacteriome and mycobiome diagnostics that are owned by The Regents of the University of California and have been licensed by Micronoma. SF, SW, and GDS-P also have filed US patent applications related to cancer microbiome diagnostics that are owned by Micronoma. Additionally, RK is a member of the scientific advisory board for GenCirq, holds an equity interest in GenCirq, and can receive reimbursements for expenses up to US $5,000 per year; he is also an SAB member for DayTwo and BiomeSense, is a consultant for Cybele, is a co-founder of Biota, and owns equity in Biota, Cybele and BiomeSense. D.M. reports being a consultant and owning stock interest in BiomeSense. EK is a founder of Clarity Genomics. Clarity Genomics did not provide funding for this study. No disclosures were reported by the other authors.

Figures

Fig. 1
Fig. 1. Comparing raw and Voom-SNM (VSNM) data within batches does not reveal a systematic bias from batch correction.
A Data splitting strategy for comparing the originally published raw and VSNM data using ML performances and ML model feature similarities. Raw-versus-VSNM AUROCs from comparing cancer types using (B) primary tumors, (C) tumor versus normal tissues, and (D) blood samples in Harvard Medical School. Fisher exact test (blue) and Kendall tau correlation (red) p values from comparing raw-versus-VSNM model feature similarities when predicting cancer type among (E) primary tumors, (F) tumor versus normal tissues, and (G) blood samples in Harvard Medical School. Aggregated AUROC data across all per-batch (H) primary tumor and (I) tumor versus normal comparisons. Aggregated and combined p-values from per-batch Fisher exact tests (blue) and Kendall tau correlations (red) across all per-batch (J) primary tumor and (K) tumor versus normal comparisons. Inset white numbers denote the number of batches (i.e., sequencing centers) from which data derived for each particular cancer type. L Aggregated AUROC data across all per-batch blood sample comparisons. M Aggregated and combined p-values from per-batch Fisher exact tests (blue) and Kendall tau correlations (red) across all per-batch blood sample comparisons. Inset white numbers denote the number of batches (i.e., sequencing centers) from which data derived for each particular cancer type. BD, HI, L Error bars denote 99% confidence intervals. EG, J, K, M P values adjusted among cancer types using Benjamini-Hochberg correction. When p values were combined across multiple batches, Fisher’s method was used on the raw per-batch p-values, followed by Benjamini-Hochberg correction across cancer types. Logarithms are base 10. See Supplementary Fig. 1C for list of TCGA cancer type abbreviations.
Fig. 2
Fig. 2. Application of a microbiome-specific batch correction tool (ConQuR) and restricting the features to WIS-overlapping genera does not change the original manuscript’s conclusions.
A WIS-overlapping data was generated by intersecting decontaminated bacterial genera from Nejman et al. [2], followed by subsetting to Illumina HiSeq samples and WGS or RNA-Seq groups. Within each WGS or RNA-Seq group, ConQuR and VSNM were applied to correct for sequencing center bias. B Data splitting strategy to accommodate separate WGS and RNA-Seq datasets due to ConQuR limitations. Downstream goals were to compare ML performances among the raw, ConQuR, and VSNM data types, as well as to compare the model feature similarities between the raw and normalized data. Aggregated AUROC data across all per-batch (C) primary tumor and (D) tumor versus normal comparisons. Aggregated and combined p-values from ConQuR-versus-raw, per-batch Fisher exact tests (blue) and Kendall tau correlations (red) across all per-batch (E) primary tumor and (F) tumor versus normal comparisons. Inset white numbers denote the number of batches (i.e., sequencing centers) from which data derived for each particular cancer type. G Aggregated AUROC data across all per-batch blood sample comparisons. H Aggregated and combined p values from ConQuR-versus-raw, per-batch Fisher exact tests (blue) and Kendall tau correlations (red) across all per-batch blood sample comparisons. Inset white numbers denote the number of batches (i.e., sequencing centers) from which data derived for each particular cancer type. C, D, G Error bars denote 99% confidence intervals. E, F, H P values were combined across multiple batches using Fisher’s method on the raw per-batch p values, followed by Benjamini-Hochberg correction across cancer types. Logarithms are base 10. See Supplementary Fig. 1C for list of TCGA cancer type abbreviations.
Fig. 3
Fig. 3. ConQuR-corrected, WIS-overlapping genera abundances demonstrate pan-cancer discrimination among blood and primary tumor samples across dozens of cancer types.
A Diagram of data sources for the multiclass ML. Since ConQuR was limited to correcting one batch variable, sequencing center bias was corrected within WGS and RNA-Seq groups after subsetting analyses to Illumina HiSeq-processed samples. Multiclass ML was run independently on the ConQuR-corrected WGS and RNA-Seq groups; of note, blood samples were only in the WGS group. B Multiclass gradient boosting ML across 24 cancer types using all blood samples in TCGA. Average pairwise AUROC is denoted above the confusion matrix. No information rate: 9.1%, mean balanced accuracy: 73.2%. C Multiclass gradient boosting ML across 24 cancer types using all WGS primary tumors in TCGA. Average pairwise AUROC is denoted above the confusion matrix. No information rate: 8.5%, mean balanced accuracy: 76.9% (D) Multiclass gradient boosting ML across 32 cancer types using all RNA-Seq primary tumors in TCGA. Average pairwise AUROC is denoted above the confusion matrix. No information rate: 10.7%, mean balanced accuracy: 79.2%. BD P values are all less than 2.2 × 10-16 for comparing the no information rate to the observed accuracy. See Supplementary Fig. 1C for list of TCGA cancer type abbreviations.
Fig. 4
Fig. 4. Human sequence contamination in the original databases was rare and does not impact downstream conclusions when all associated genera are removed.
A Microbial genomes in the original two databases (custom Kraken, WoLr1) were processed with Conterminator [15] to identify any regions shared with hg38, T2T-CHM13, and human pangenome references, with ≤1.08% of microbial genomes affected in either database. Genus-level features in the associated count tables linked to any of these genomes with human contamination were removed to form filtered versions of the Kraken and SHOGUN/WoLr1 tables. A data splitting strategy was applied to compare filtered versus raw data. Aggregated AUROC data across all per-batch (B) primary tumor and (C) tumor versus normal, and (D) blood sample comparisons using the Kraken raw and filtered data. Aggregated AUROC data across all per-batch (E) blood sample (F) primary tumor, and (G) tumor versus normal comparisons using the SHOGUN/WoLr1 raw and filtered data. H Simulation diagram to evaluate false positive rate of human-only reads aligning to WoLr1 using the SHOGUN pipeline described in the original paper. Paired-end 150 bp Illumina reads from the T2T-CHM13 human reference were simulated using ART [64], subsampled to one million reads each, followed by initial mapping with BWA against hg19 and alignments of the unmapped reads against WoLr1. I Percent of human reads mapping against WoLr1 out of one million per sample. J Number of false positive genera based on human reads mapped against WoLr1. BG Error bars denote 99% confidence intervals. See Supplementary Fig. 1C for list of TCGA cancer type abbreviations.
Fig. 5
Fig. 5. Sequential host depletion of TCGA reduces read counts without eliminating microbial signals.
A Sequential host depletion steps of TCGA with respect to past literature and this current work. B Non-human TCGA read count totals after successive host depletion with hg19, hg38, T2T-CHM13, HPRC, and for RNA-Seq data additionally against GENCODE across the three major sample types: primary tumor (PT), solid tissue normal (STN), and blood derived normal (BDN). C Strategy for mapping hg38-, T2T-, and HPRC-transcript-depleted data with KrakenUniq against MicrobialDB, as used by Gihawi et al. [13], to compare microbial read counts. D Percent of hg38-, T2T-, and HPRC-transcript-depleted reads mapped by KrakenUniq to MicrobialDB as microbial. Y-axis is log10-transformed; zero-valued samples excluded. E Per-sample, per-cancer type mean fold changes (MFCs) in KrakenUniq-MicrobialDB counts between hg38- and T2T-depleted data. Per-cancer average MFCs inset below bars. Sample counts inset in blue above bars. Overlaid error bars denote standard errors. Zero-valued samples excluded to avoid ratios of infinity. F Per-sample, per-experimental strategy MFCs in KrakenUniq-MicrobialDB counts between hg38- and T2T-depleted data. Per-experimental strategy average MFCs inset to right of bars. Sample counts inset in blue to left of bars. Overlaid error bars denote standard errors. Zero-valued samples excluded to avoid ratios of infinity. G Scatter plots of non-human reads versus KrakenUniq-MicrobialDB counts for hg38-depleted (left), T2T-depleted (middle), and HPRC-GENCODE-depleted (right) data. Axes are log10-transformed; zero-valued samples excluded. Spearman correlation values inset with concomitant p-values. H Strategy for cleaning RefSeq version 210 (RS210) of human reads using Conterminator and Exhaustive with hg38, T2T, and HPRC reference genomes. Main steps of Exhaustive are visually described on bottom: all 150 bp k-mers with steps of 75 bp are aligned against RS210, and contiguously mapped regions are masked. I Number of RS210 genomes found to have at least one region of human sequence overlap detected by Conterminator and/or Exhaustive. J Unpaired, cumulative length of human sequence contamination in RS210 genomes found to have at least one region of human sequence overlap via Conterminator or Exhaustive. Wilcoxon test inset. K Paired cumulative length of human sequence contamination in 453 RS210 genomes found to have at least one region of human sequence overlap via Conterminator and Exhaustive. Wilcoxon rank-sum test inset. L Strategy for deriving filtered microbial abundances in TCGA using KrakenUniq against MicrobialDB or direct genome alignments against RS210-clean. Note that both MicrobialDB and RS210-clean occasionally include more than one genome per species. M Aggregate microbial genome coverages in TCGA among non-viral, human-associated species found in UNITN, UHGG, WIS, or pathogenic bacteria references. Each bar denotes a unique species, and the bar color denotes which TCGA sample type (primary tumor, blood, adjacent normal) had the highest amount of aggregate genome coverage by itself. Inset upper right: radial bar plots of aggregate genome coverage for Fusobacterium nucleatum in primary tumors (blue, 99.7%), blood (96.5%), and adjacent normal tissues (orange, 97.5%).
Fig. 6
Fig. 6. Application of the KrakenUniq-MicrobialDB pipeline on T2T-depleted TCGA data demonstrates cancer type-specificity in tissues and blood.
A Steps taken to derive 294 filtered genera based on running KrakenUniq mapping against MicrobialDB on T2T-depleted TCGA data. Genera abundances were input into alpha diversity, beta diversity, differential abundance, and ML analyses to evaluate cancer type-specificity. B Prevalence of filtered genera among TCGA WGS and RNA-Seq samples. C Original TCGA read depths of samples containing (blue) or lacking (red) filtered genera. D Exemplary one-cancer-type-versus-all-others ML among primary tumors (PT) at Baylor College of Medicine (BCM) using the filtered genera. Error bars denote averages (dots) and 95% confidence intervals (brackets) of 10-fold cross-validation. Null AUROC and AUPR shown as dotted horizontal lines. E Exemplary one-cancer-type-versus-all-others ML among blood derived normals (BDN) at BCM using the filtered genera. Error bars denote averages (dots) and 95% confidence intervals (brackets) of 10-fold cross-validation. Null AUROC and AUPR shown as dotted horizontal lines. F Aitchison distance beta diversity among BCM PTs colored by cancer type. PERMANOVA values inset, based on cancer type separation. G Aitchison distance beta diversity among BCM BDNs colored by cancer type. PERMANOVA values inset, based on cancer type separation. H Filtered genera differential abundance among BCM cancer types using PTs in a one-cancer-type-versus-all-others manner. Red dots denote microbes with q ≤ 0.05. Positive log-fold changes denote microbes associated with that particular cancer type. I Filtered genera differential abundance among BCM cancer types using BDNs in a one-cancer-type-versus-all-others manner. Red dots denote microbes with q ≤ 0.05. Positive log-fold changes denote microbes associated with that particular cancer type. J Multiclass ML confusion matrix among cancer types using WGS PTs after ConQuR batch correction. K Multiclass ML confusion matrix among cancer types using WGS BDNs after ConQuR batch correction. DE, HK TCGA cancer type abbreviations shown in Supplementary Fig. 1C.
Fig. 7
Fig. 7. Cancer microbiome signals are consistent across three levels of host depletion.
A Data splitting strategy for comparing per-batch ML performances and signatures between raw KrakenUniq-MicrobialDB abundances derived from hg38-, T2T-, and HPRC-transcript-depleted data. Note: Only Illumina HiSeq samples were used for comparison. B Aggregated per-batch AUROCs for tumor-versus-normal ML comparisons. C Aggregated per-bach AUROCs for cancer type comparisons using primary tumors. D Aggregated per-bach AUROCs for cancer type comparisons using blood samples. ML feature similarities for cancer type comparisons when using primary tumors between (E) hg38- versus T2T-depleted, (F) hg38- versus HPRC-transcript-depleted, and (G) T2T- versus HPRC-transcript-depleted microbial data. ML feature similarities for cancer type comparisons when using blood samples between (H) hg38- versus T2T-depleted, (I) hg38- versus HPRC-transcript-depleted, and (J) T2T- versus HPRC-transcript-depleted microbial data. ML feature similarities for tumor versus normal comparisons between (K) hg38- versus T2T-depleted, (L) hg38- versus HPRC-transcript-depleted, and (M) T2T- versus HPRC-transcript-depleted microbial data. BD Error bars denote 95% confidence intervals. EM Kendall tau correlations are shown in red. Fisher exact tests are shown in blue. P-values combined across multiple batches using Fisher’s method on the raw per-batch p-values, followed by Benjamini-Hochberg correction across cancer types. Number of combined batches per cancer type inset in white text. Logarithms are base 10. See Supplementary Fig. 1C for list of TCGA cancer type abbreviations.
Fig. 8
Fig. 8. Application of the SHOGUN/Woltka-RS210-clean pipeline on HPRC and transcript-depleted TCGA data demonstrates cancer type-specificity in tissues and blood.
A Steps taken to derive 689 unique, filtered species with ≥50% aggregate genome coverage based on running SHOGUN/Woltka mapping against RS210-clean on HPRC and transcript-depleted TCGA data. Species abundances were input into alpha diversity, beta diversity, differential abundance, and ML analyses to evaluate cancer type specificity. B Prevalence of filtered species among TCGA WGS and RNA-Seq samples. C Original TCGA read depths of samples containing (blue) or lacking (red) filtered species. D Exemplary one-cancer-type-versus-all-others ML among primary tumors (PT) at Harvard Medical School (HMS) using the filtered species. Error bars denote averages (dots) and 95% confidence intervals (brackets) of 10-fold cross-validation. Null AUROC and AUPR shown as dotted horizontal lines. E Exemplary one-cancer-type-versus-all-others ML among blood derived normals (BDN) at HMS using the filtered species. Error bars denote averages (dots) and 95% confidence intervals (brackets) of 10-fold cross-validation. Null AUROC and AUPR shown as dotted horizontal lines. F Aitchison distance beta diversities calculated by RPCA [77] among HMS PTs colored by cancer type. PERMANOVA values inset, based on cancer type separation. G Aitchison distance beta diversities calculated by RPCA [77] among HMS BDNs colored by cancer type. PERMANOVA values inset, based on cancer type separation. H Filtered species differential abundance among HMS cancer types using PTs in a one-cancer-type-versus-all-others manner. Red dots denote microbes with q ≤ 0.05. Positive log-fold changes denote microbes associated with that particular cancer type. I Filtered species differential abundance among HMS cancer types using BDNs in a one-cancer-type-versus-all-others manner. Red dots denote microbes with q ≤ 0.05. Positive log-fold changes denote microbes associated with that particular cancer type. J Multiclass ML confusion matrix among cancer types using WGS PTs after ConQuR batch correction. K Multiclass ML confusion matrix among cancer types using WGS BDNs after ConQuR batch correction. DE, HK TCGA cancer type abbreviations shown in Supplementary Fig. 1C.

References

    1. Poore GD, Kopylova E, Zhu Q, Carpenter C, Fraraccio S, Wandro S, et al. Microbiome analyses of blood and tissues suggest cancer diagnostic approach. Nature. 2020;579:567–74. doi: 10.1038/s41586-020-2095-1. - DOI - PMC - PubMed
    1. Nejman D, Livyatan I, Fuks G, Gavert N, Zwang Y, Geller LT, et al. The human tumor microbiome is composed of tumor type-specific intracellular bacteria. Science. 2020;368:973–80. doi: 10.1126/science.aay9189. - DOI - PMC - PubMed
    1. Chen S, Jin Y, Wang S, Xing S, Wu Y, Tao Y, et al. Cancer type classification using plasma cell-free RNAs derived from human and microbes. Elife. 2022;11:e75181. doi: 10.7554/eLife.75181. - DOI - PMC - PubMed
    1. Woerner J, Huang Y, Hutter S, Gurnari C, Sánchez JMH, Wang J, et al. Circulating microbial content in myeloid malignancy patients is associated with disease subtypes and patient outcomes. Nat Commun. 2022;13:1038. doi: 10.1038/s41467-022-28678-x. - DOI - PMC - PubMed
    1. Hermida LC, Gertz EM, Ruppin E. Predicting cancer prognosis and drug response from the tumor microbiome. Nat Commun. 2022;13:2896. doi: 10.1038/s41467-022-30512-3. - DOI - PMC - PubMed