

Classification Prediction of Alzheimer's Disease and Vascular Dementia Using Physiological Data and ECD SPECT Images
- PMID: 38396404
- PMCID: PMC10888136
- DOI: 10.3390/diagnostics14040365
Classification Prediction of Alzheimer's Disease and Vascular Dementia Using Physiological Data and ECD SPECT Images
Abstract
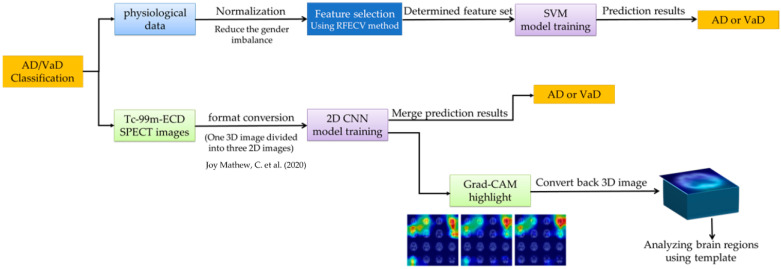
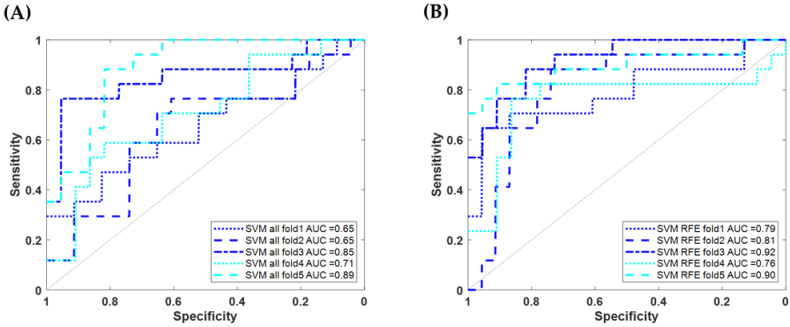
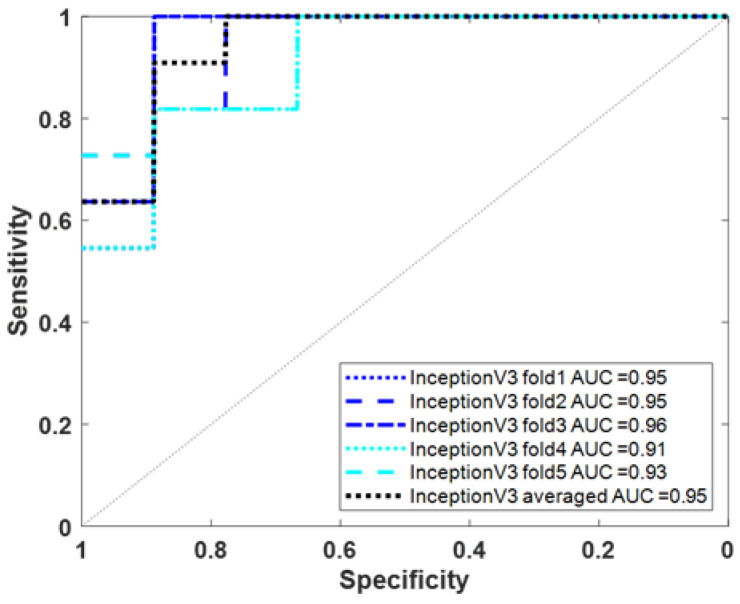
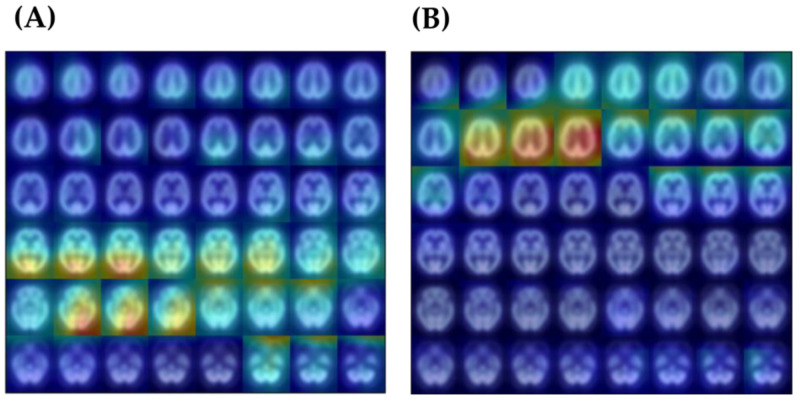
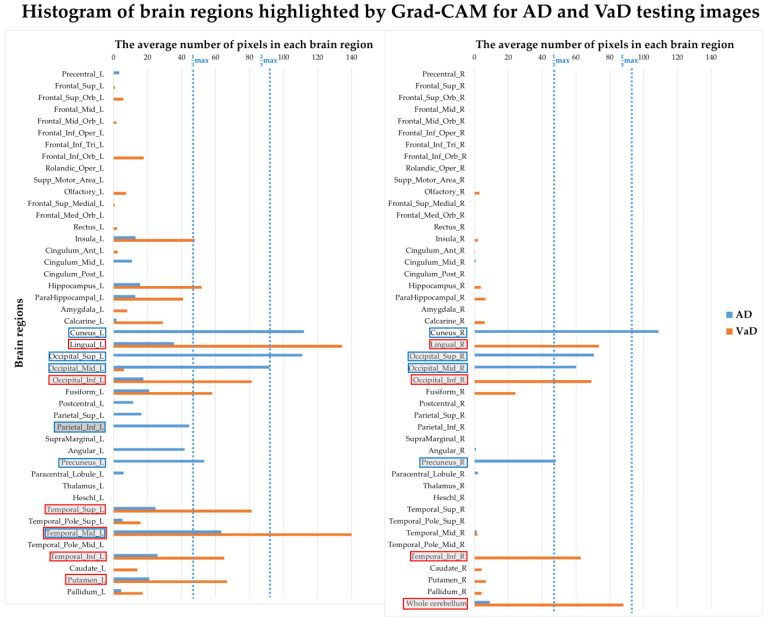
Alzheimer's disease (AD) and vascular dementia (VaD) are the two most common forms of dementia. However, their neuropsychological and pathological features often overlap, making it difficult to distinguish between AD and VaD. In addition to clinical consultation and laboratory examinations, clinical dementia diagnosis in Taiwan will also include Tc-99m-ECD SPECT imaging examination. Through machine learning and deep learning technology, we explored the feasibility of using the above clinical practice data to distinguish AD and VaD. We used the physiological data (33 features) and Tc-99m-ECD SPECT images of 112 AD patients and 85 VaD patients in the Taiwanese Nuclear Medicine Brain Image Database to train the classification model. The results, after filtering by the number of SVM RFE 5-fold features, show that the average accuracy of physiological data in distinguishing AD/VaD is 81.22% and the AUC is 0.836; the average accuracy of training images using the Inception V3 model is 85% and the AUC is 0.95. Finally, Grad-CAM heatmap was used to visualize the areas of concern of the model and compared with the SPM analysis method to further understand the differences. This research method can quickly use machine learning and deep learning models to automatically extract image features based on a small amount of general clinical data to objectively distinguish AD and VaD.
Keywords: Alzheimer’s disease; ECD SPECT images; classification prediction; vascular dementia.
Conflict of interest statement
The authors declare no conflicts of interest. The funders had no role in the design of the study; in the collection, analyses, or interpretation of data; in the writing of the manuscript; or in the decision to publish the results.
Figures

Similar articles
-
Detection of Alzheimer's disease using ECD SPECT images by transfer learning from FDG PET.Ann Nucl Med. 2021 Aug;35(8):889-899. doi: 10.1007/s12149-021-01626-3. Epub 2021 Jun 2. Ann Nucl Med. 2021. PMID: 34076857
-
The Feasibility of Differentiating Lewy Body Dementia and Alzheimer's Disease by Deep Learning Using ECD SPECT Images.Diagnostics (Basel). 2021 Nov 12;11(11):2091. doi: 10.3390/diagnostics11112091. Diagnostics (Basel). 2021. PMID: 34829438 Free PMC article.
-
Machine Learning-Based Framework for Differential Diagnosis Between Vascular Dementia and Alzheimer's Disease Using Structural MRI Features.Front Neurol. 2019 Oct 25;10:1097. doi: 10.3389/fneur.2019.01097. eCollection 2019. Front Neurol. 2019. PMID: 31708854 Free PMC article.
-
Alzheimer's/Vascular Spectrum Dementia: Classification in Addition to Diagnosis.J Alzheimers Dis. 2020;73(1):63-71. doi: 10.3233/JAD-190654. J Alzheimers Dis. 2020. PMID: 31815693 Review.
-
Neuropsychological differential diagnosis of Alzheimer's disease and vascular dementia: a systematic review with meta-regressions.Front Aging Neurosci. 2023 Nov 6;15:1267434. doi: 10.3389/fnagi.2023.1267434. eCollection 2023. Front Aging Neurosci. 2023. PMID: 38020767 Free PMC article.
Cited by
-
MINDSETS: Multi-omics Integration with Neuroimaging for Dementia Subtyping and Effective Temporal Study.Sci Rep. 2025 May 6;15(1):15835. doi: 10.1038/s41598-025-97674-0. Sci Rep. 2025. PMID: 40328937 Free PMC article.
References
-
- Taiwan Alzheimer Disease Association . Handbook of Dementia Diagnosis and Treatment. Ministry of Health and Welfare; Taipei City, Taiwan: 2017. p. 16.
-
- Ramirez-Gomez L., Zheng L., Reed B., Kramer J., Mungas D., Zarow C., Vinters H., Ringman J.M., Chui H. Neuropsychological Profiles Differentiate Alzheimer Disease from Subcortical Ischemic Vascular Dementia in an Autopsy-Defined Cohort. Dement. Geriatr. Cogn. Disord. 2017;44:1–11. doi: 10.1159/000477344. - DOI - PMC - PubMed
-
- WHO . The World Health Report 2002: Reducing Risks to Health, Promoting Healthy Life. WHO; Geneva, Switzerland: 2002.
-
- Bennett D. Public Health Importance of Vascular Dementia and Alzheimer’s Disease with Cerebrovascular Disease. Int. J. Clin. Pract. Suppl. 2001:41–48. - PubMed
Grants and funding
LinkOut - more resources
Full Text Sources
