Comparison of Umbilical Cord Mesenchymal Stem Cells and Fibroblasts as Donor Nuclei for Handmade Cloning in Sheep Using a Single-Cell Transcriptome
- PMID: 38396557
- PMCID: PMC10886412
- DOI: 10.3390/ani14040589
Comparison of Umbilical Cord Mesenchymal Stem Cells and Fibroblasts as Donor Nuclei for Handmade Cloning in Sheep Using a Single-Cell Transcriptome
Abstract
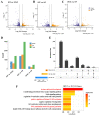
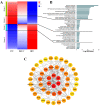
Oocytes are efficient at reprogramming terminally differentiated cells to a totipotent state. Nuclear transfer techniques can exploit this property to produce cloned animals. However, the overall efficiency is low. The use of umbilical cord mesenchymal stem cells (UC-MSCs) as donor nuclei may increase blastocyst rates, but the exact reasons for this remain unexplored. A single-cell transcriptomic approach was used to map the transcriptome profiles of eight-cell embryos that were in vitro-fertilized and handmade-cloned using umbilical cord mesenchymal stem cells and fibroblasts as nuclear donors. Differences were examined at the chromatin level, the level of differentially expressed genes, the level of histone modifications and the level of DNA methylation. This research provides critical information regarding the use of UC-MSCs as a preferred donor nucleus for nuclear transfer techniques. It also offers unique insights into the mechanism of cellular reprogramming.
Keywords: handmade cloning; nuclear transplantation; sheep; single-cell transcriptome; umbilical cord mesenchymal stem cells.
Conflict of interest statement
The authors declare no conflicts of interest.
Figures


Similar articles
-
Optimization of handmade cloning technique in sheep and preliminary investigation of umbilical cord mesenchymal stem cells as donor nuclei.Reprod Domest Anim. 2024 Sep;59(9):e14632. doi: 10.1111/rda.14632. Reprod Domest Anim. 2024. PMID: 39279335
-
Comparison of efficiency of in vitro cloned sheep embryo production by conventional somatic cell nuclear transfer and handmade cloning technique.Reprod Domest Anim. 2018 Apr;53(2):512-518. doi: 10.1111/rda.13138. Epub 2018 Jan 22. Reprod Domest Anim. 2018. PMID: 29359363
-
Bone marrow mesenchymal stem cells are an attractive donor cell type for production of cloned pigs as well as genetically modified cloned pigs by somatic cell nuclear transfer.Cell Reprogram. 2013 Oct;15(5):459-70. doi: 10.1089/cell.2013.0010. Epub 2013 Sep 13. Cell Reprogram. 2013. PMID: 24033142 Free PMC article.
-
Nuclear cloning, epigenetic reprogramming and cellular differentiation.Novartis Found Symp. 2005;265:107-18; discussion 118-28. Novartis Found Symp. 2005. PMID: 16050253 Review.
-
Strategies to Improve the Efficiency of Somatic Cell Nuclear Transfer.Int J Mol Sci. 2022 Feb 10;23(4):1969. doi: 10.3390/ijms23041969. Int J Mol Sci. 2022. PMID: 35216087 Free PMC article. Review.
References
Grants and funding
LinkOut - more resources
Full Text Sources

