

Assessment of Full-Fat Tenebrio molitor as Feed Ingredient for Solea senegalensis: Effects on Growth Performance and Lipid Profile
- PMID: 38396563
- PMCID: PMC10886388
- DOI: 10.3390/ani14040595
Assessment of Full-Fat Tenebrio molitor as Feed Ingredient for Solea senegalensis: Effects on Growth Performance and Lipid Profile
Abstract
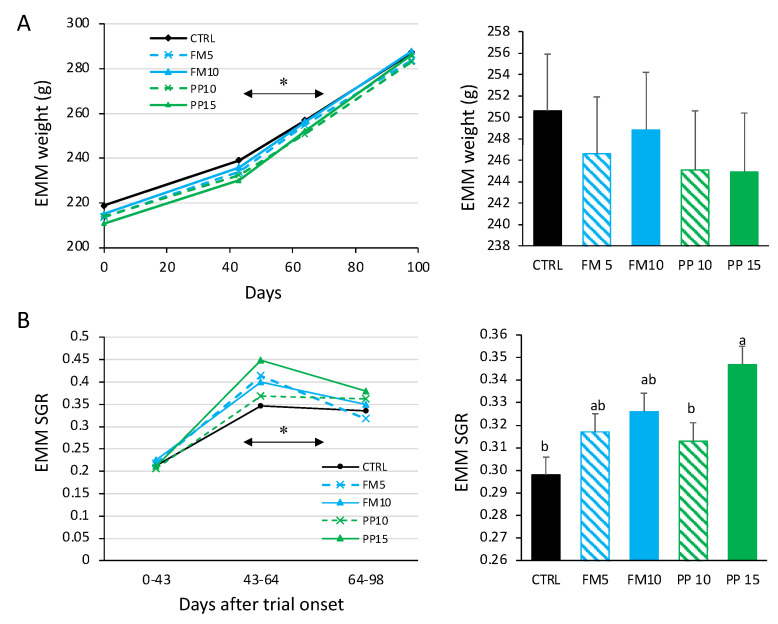
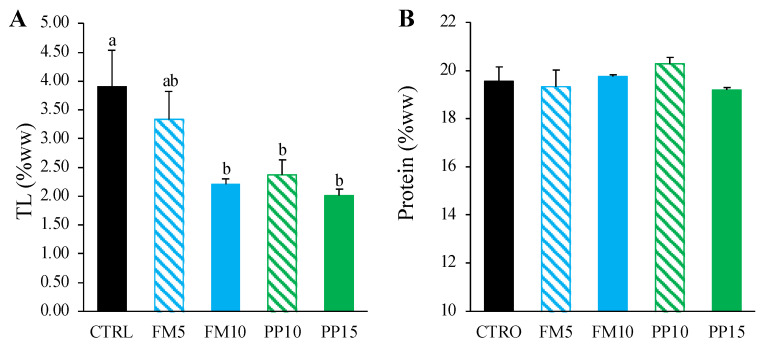
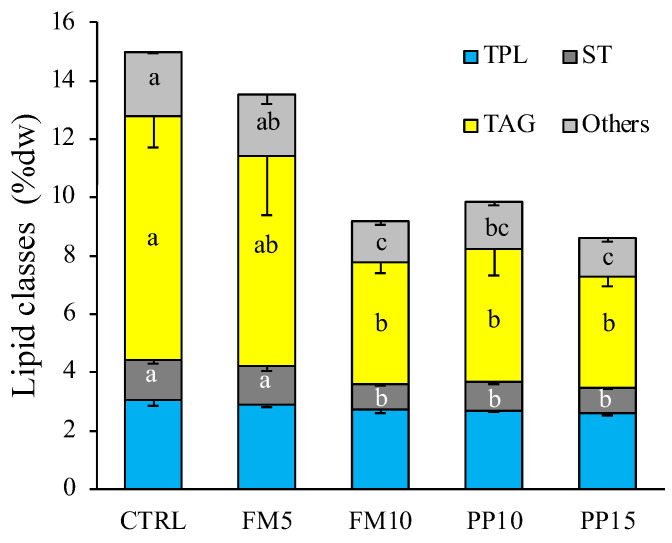
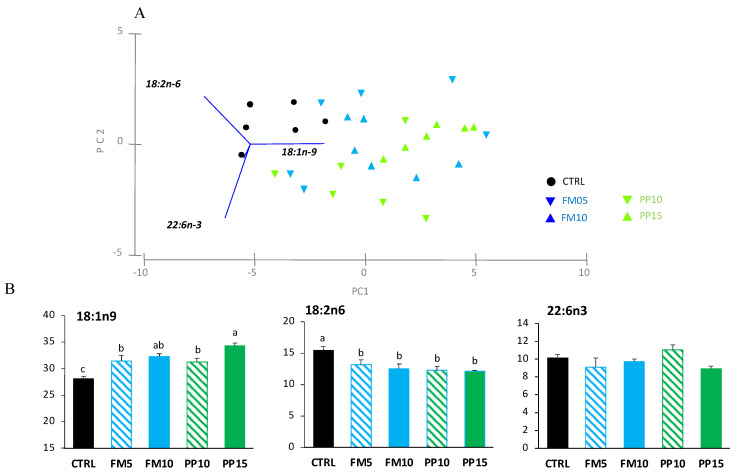
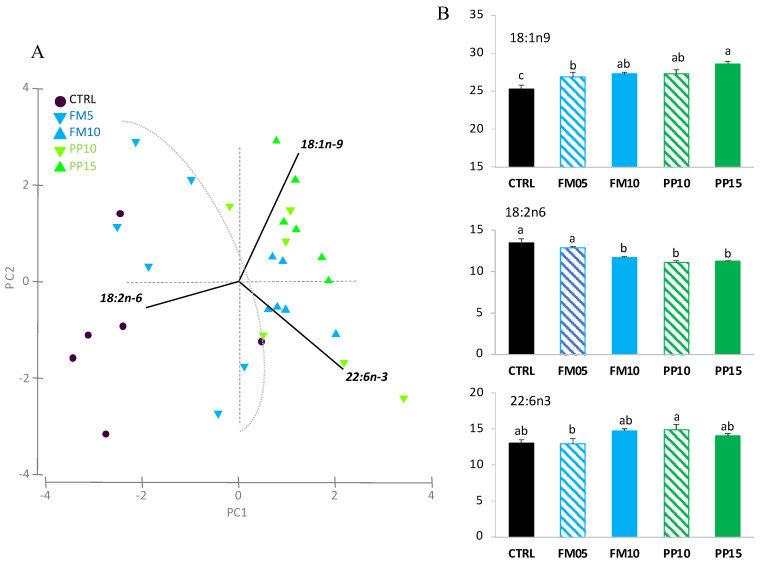
Tenebrio molitor (TM) is considered as one of the most promising protein sources for replacing fish meal in aquafeeds, among other things because it is rich in protein, a good source of micronutrients and has a low carbon footprint and land use. However, the main drawback of TM is its fatty acid profile, in particular its low content of n-3 PUFA. This study evaluates the effects of partially replacing plant or marine-derived with full-fat TM meal at two different levels on growth performance and lipid profiles of Senegalese sole (Solea senegalensis). For this purpose, a control diet (CTRL) and four experimental isoproteic (53%) and isolipidic (16%) diets were formulated containing 5 and 10% TM meal replacing mostly fish meal (FM5 and FM10), or 10 and 15% TM meal replacing mostly plant meal (PP10 and PP15). Fish (215 g) were fed at 1% of their body weight for 98 days. The final body weight of fish fed the experimental diets containing TM meal was not different from that of fish fed the CTRL diet (289 g). However, the inclusion of TM meal resulted in a gradual improvement in growth rate and feed efficiency in both cases (replacement of fish or plant meals), and significant differences in specific growth rate (SGR) were observed between fish fed the CTRL diet (SGR = 0.30% day-1) and those fed diets with the highest TM meal content (PP15; SGR = 0.35% day-1). The experimental groups did not show any differences in the protein content of the muscle (19.6% w/w). However, significant differences were observed in the total lipid content of the muscle, with the FM10, PP10, and PP15 groups having the lowest muscle lipid contents (2.2% ww). These fish also showed the lowest neutral lipid content in muscle (6.6% dw), but no differences were observed in the total phospholipid content (2.6% dw). Regarding the fatty acid profile, fish fed FM10, PP10 and PP15 had lower levels of linoleic acid (18:2n-6) and higher levels of oleic acid (18:1n-9) in liver and muscle compared to fish fed CTRL. However, no differences were found between fish fed CTRL and TM-based diets for docosahexaenoic acid (22:6n-3) and total n-3 PUFA in liver and muscle. In conclusion, our study demonstrated that full-fat TM inclusion up to 15% in S. senegalensis diets had no negative effects or even some positive effects on fish survival, growth performance, nutrient utilization and flesh quality.
Keywords: Solea senegalensis; Tenebrio molitor; fatty acid profile; insect meal; sustainable protein sources.
Conflict of interest statement
The authors declare no conflicts of interest. The funders had no role in the design of the study; in the collection, analyses, or interpretation of data; in the writing of the manuscript, or in the decision to publish the results.
Figures
Similar articles
-
A Comparative Study of the Effect of Including Full-Fat Tenebrio molitor for Replacing Conventional Ingredients in Practical Diets for Dicentrarchus labrax Juveniles.Animals (Basel). 2025 Jan 8;15(2):131. doi: 10.3390/ani15020131. Animals (Basel). 2025. PMID: 39858131 Free PMC article.
-
Growth performance, body composition, and digestive functionality of Senegalese sole (Solea senegalensis Kaup, 1858) juveniles fed diets including microalgae freeze-dried biomass.Fish Physiol Biochem. 2018 Apr;44(2):661-677. doi: 10.1007/s10695-018-0462-8. Epub 2018 Jan 21. Fish Physiol Biochem. 2018. PMID: 29354886
-
The Use of Defatted Tenebrio molitor Larvae Meal as a Main Protein Source Is Supported in European Sea Bass (Dicentrarchus labrax) by Data on Growth Performance, Lipid Metabolism, and Flesh Quality.Front Physiol. 2021 Apr 15;12:659567. doi: 10.3389/fphys.2021.659567. eCollection 2021. Front Physiol. 2021. PMID: 33967831 Free PMC article.
-
The Feasibility of Using Yellow Mealworms (Tenebrio molitor): Towards a Sustainable Aquafeed Industry.Animals (Basel). 2021 Mar 13;11(3):811. doi: 10.3390/ani11030811. Animals (Basel). 2021. PMID: 33805823 Free PMC article. Review.
-
Insect meal in aquafeeds: A sustainable path to enhanced mucosal immunity in fish.Fish Shellfish Immunol. 2024 Jul;150:109625. doi: 10.1016/j.fsi.2024.109625. Epub 2024 May 11. Fish Shellfish Immunol. 2024. PMID: 38740231 Review.
Cited by
-
A Comparative Study of the Effect of Including Full-Fat Tenebrio molitor for Replacing Conventional Ingredients in Practical Diets for Dicentrarchus labrax Juveniles.Animals (Basel). 2025 Jan 8;15(2):131. doi: 10.3390/ani15020131. Animals (Basel). 2025. PMID: 39858131 Free PMC article.
References
-
- FAO . The State of World Fisheries and Aquaculture 2022: Towards Blue Transformation. FAO; Rome, Italy: 2022.
-
- Nijdam D., Rood T., Westhoek H. The price of protein: Review of land use and carbon footprints from life cycle assessments of animal food products and their substitutes. Food Policy. 2012;37:760–770. doi: 10.1016/j.foodpol.2012.08.002. - DOI
-
- Hardy R.W. Utilization of plant proteins in fish diets: Effects of global demand and supplies of fishmeal. Aquac. Res. 2010;41:770–776. doi: 10.1111/j.1365-2109.2009.02349.x. - DOI
-
- Bakke-McKellep A.M., Penn M.H., Salas P.M., Refstie S., Sperstad S., Landsverk T., Ringø E., Krogdahl Å. Effects of dietary soyabean meal, inulin and oxytetracycline on intestinal microbiota and epithelial cell stress, apoptosis and proliferation in the teleost Atlantic salmon (Salmo salar L.) Br. J. Nutr. 2007;97:699–713. doi: 10.1017/S0007114507381397. - DOI - PubMed
-
- UrÁN P.A., Schrama J.W., Rombout J.H.W.M., Obach A., Jensen L., Koppe W., Verreth J.A.J. Soybean meal-induced enteritis in Atlantic salmon (Salmo salar L.) at different temperatures. Aquac. Nutr. 2008;14:324–330. doi: 10.1111/j.1365-2095.2007.00534.x. - DOI
Grants and funding
LinkOut - more resources
Full Text Sources
