. 2024 Feb 8;25(4):2099.
doi: 10.3390/ijms25042099.

The African Swine Fever Virus Virulence Determinant DP96R Suppresses Type I IFN Production Targeting IRF3

Affiliations

The African Swine Fever Virus Virulence Determinant DP96R Suppresses Type I IFN Production Targeting IRF3

Niranjan Dodantenna et al. Int J Mol Sci. .

Abstract

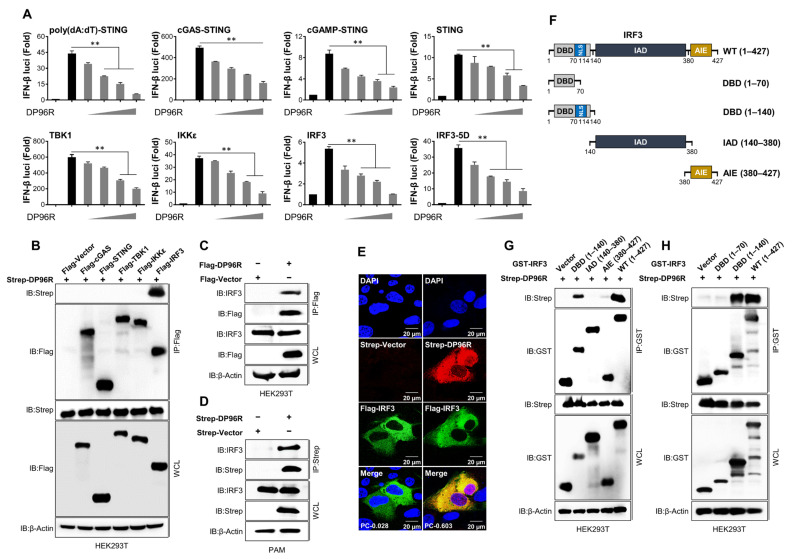
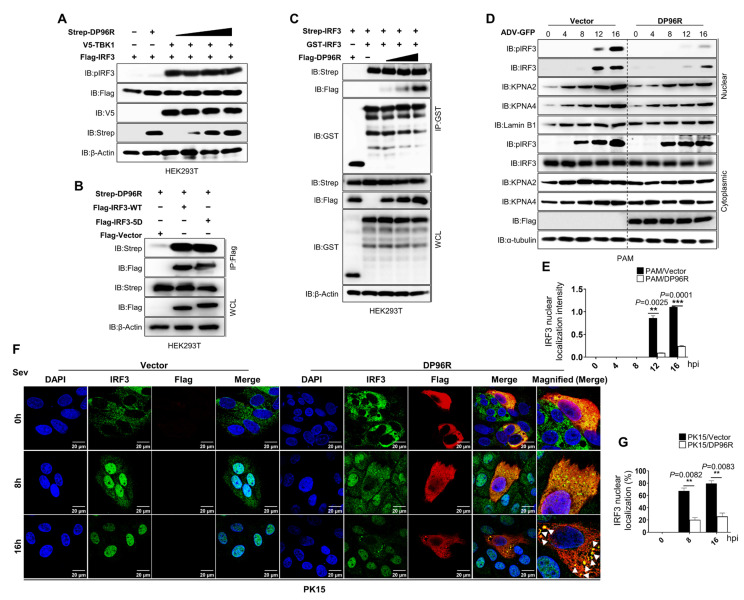
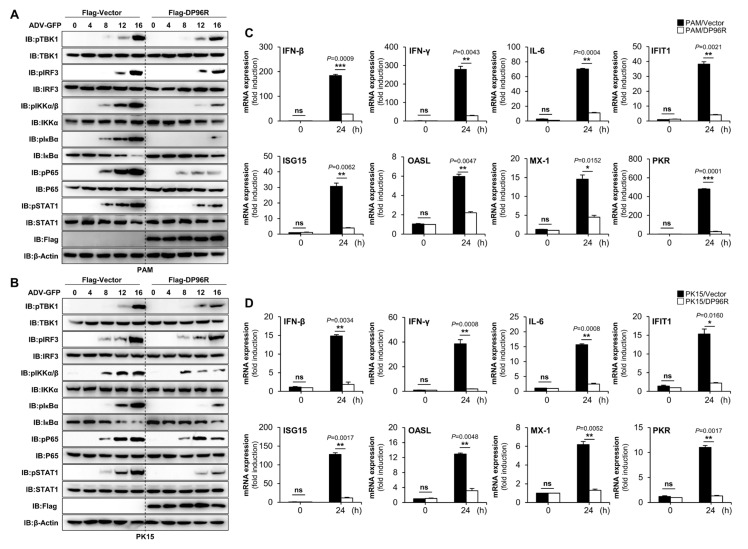
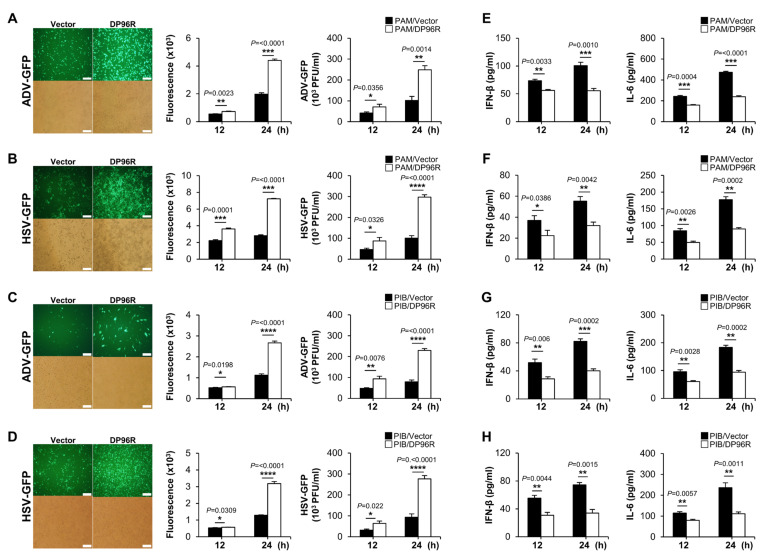
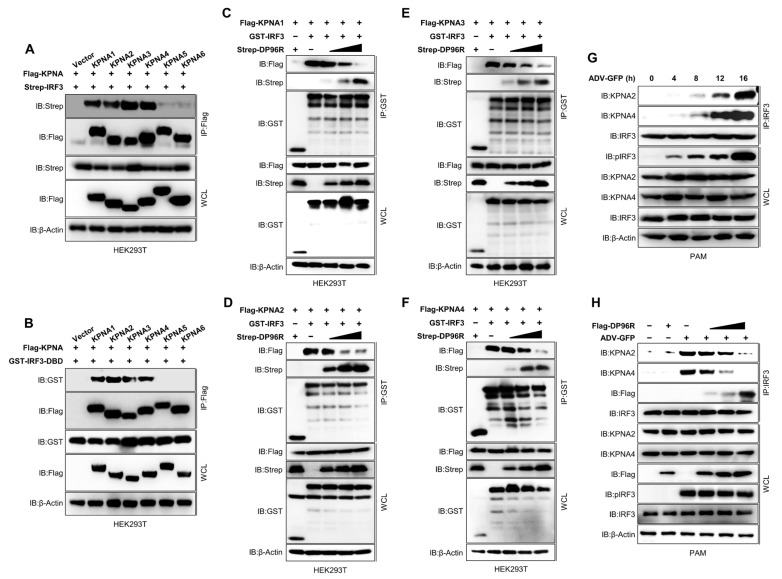
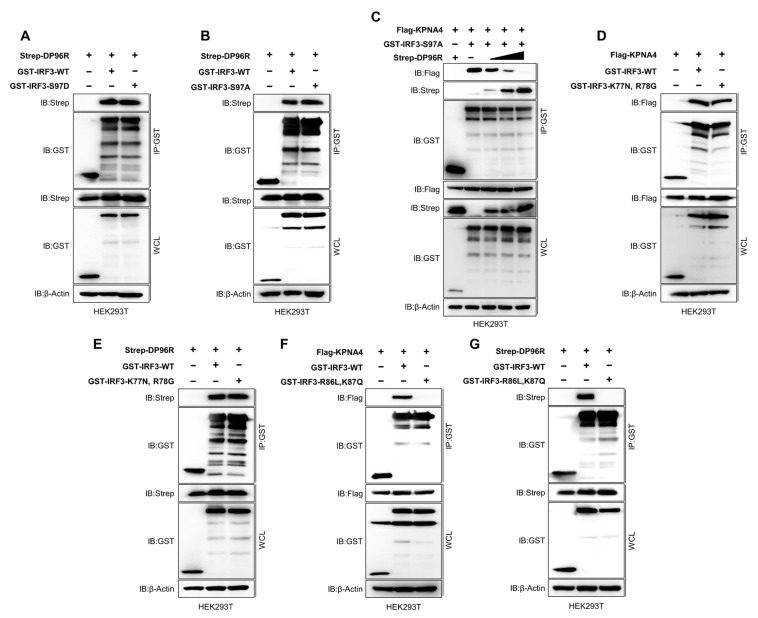
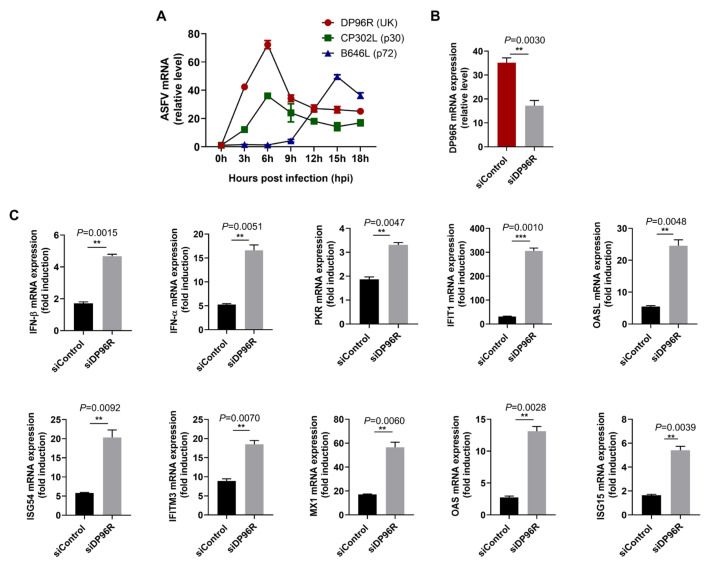
DP96R of African swine fever virus (ASFV), also known as uridine kinase (UK), encodes a virulence-associated protein. Previous studies have examined DP96R along with other genes in an effort to create live attenuated vaccines. While experiments in pigs have explored the impact of DP96R on the pathogenicity of ASFV, the precise molecular mechanism underlying this phenomenon remains unknown. Here, we describe a novel molecular mechanism by which DP96R suppresses interferon regulator factor-3 (IRF3)-mediated antiviral immune responses. DP96R interacts with a crucial karyopherin (KPNA) binding site within IRF3, disrupting the KPNA-IRF3 interaction and consequently impeding the translocation of IRF3 to the nucleus. Under this mechanistic basis, the ectopic expression of DP96R enhances the replication of DNA and RNA viruses by inhibiting the production of IFNs, whereas DP96R knock-down resulted in higher IFNs and IFN-stimulated gene (ISG) transcription during ASFV infection. Collectively, these findings underscore the pivotal role of DP96R in inhibiting IFN responses and increase our understanding of the relationship between DP96R and the virulence of ASFV.

Keywords: African swine fever virus; DP96R (UK gene); IRF3; KPNA.


Conflict of interest statement

The authors declare no conflicts of interest.

Figures

Figure 1
Figure 1
DP96R targets the IRF3 nuclear import domain. (A) IFN-β luciferase assay. HEK293T cells were used for STING-, TBK1-, IKKε-, IRF3-, and IRF3-5D-induced IFN-β luciferase assays. HEK293T cells were transfected with Flag-DP96R plasmid, as indicated with relevant stimulants, and firefly luciferase reporter plasmid encoding the IFN-β promoter plus TK-renilla plasmid as transfection control to normalize firefly luciferase activity. Expression plasmids of STING, TBK1, IKKε, IRF3, and IRF3-5D were used as stimulants of the cGAS-STING pathway. STING overexpressing 293-Dual™ hSTING-A162 cells were used for poly(dA:dT)-, cGAS-, and cGAMP-induced luciferase assays. 293-Dual™ hSTING-A162 cells were transfected with Flag-DP96R plasmid as indicated, along with 3×Flag-cGAS expression plasmid, or transfected with poly(dA:dT) or 2′3′cGAMP for 12 h. Thirty six hpt, the luciferase activity of each sample was measured. Results are expressed relative to those renilla luciferases alone. The first and second black bars represent negative and positive controls, respectively. Grey bars represent DP96R dose-dependent transfection. (B) HEK293T cells were co-transfected with Strep-DP96R with Flag-tagged cGAS, STING, TBK1, IKKε, IRF3, and Flag control plasmids. Cell lysates were subjected to immunoprecipitation (IP) by Flag antibody, followed by immunoblotting with an anti-Strep and anti-Flag antibodies. (C) HEK293T and (D) PAMs were transfected with Flag-DP96R and Strep-DP96R and their control plasmids, respectively. Cell lysates were subjected to IP by Flag antibody and Strep beads, followed by immunoblotting with anti-IRF3, anti-Flag or anti-Strep antibodies. (E) Colocalization of DP96R and IRF3. PK-15 cells were transfected with Strep-tagged DP96R plasmid and its control plasmid with Flag-tagged IRF3 plasmid, followed by confocal microscopy assay with anti-Flag and anti-Strep primary and anti-mouse (red) and anti-rabbit (green) secondary antibodies. Nuclei were stained with DAPI (blue). (F) IRF3 domain constructs. GST-tagged IRF3 wild-type (WT) and amino acid 1–140 (DBD), 140–380 (IAD), 380–427 (AIE), and control vector (GST) were co-transfected to HEK293T cells together with Strep-tagged ASFV DP96R plasmid (G). GST-tagged IRF3 WT and amino acid 1–140 (DBD), amino acid 1–70 (DBD excluding NLS), and control vector (GST) were co-transfected to HEK293T cells together with Strep-tagged ASFV DP96R plasmid (H). Cell lysates were subjected to GST-PD and immunoblotted with anti-Strep antibodies after immunoblotting the WCL with anti-Strep and anti-GST antibodies. Luciferase data represent three independent experiments, each with similar results, and all the values are expressed as mean ± SD of two biological replicates. All the immunoblot and confocal data represent at least two independent experiments, each with similar results. The scale bar represents 20 μM. Student’s t-test: **, p < 0.01.
Figure 2
Figure 2
DP96R inhibits the nuclear localization of IRF3. (A) IRF3 phosphorylation inhibition assay. HEK293T cells were transfected with Flag-IRF3, and V5-TBK1 with Strep-DP96R dose-dependently. Cell lysates were immunoblotted with anti-pIRF3, -Flag, -V5, and -Strep antibodies. (B) HEK293T cells were transfected with Flag-IRF3-WT and Flag-IRF3-5D, and its control vector with Strep-DP96R. Cell lysates were subjected to Flag IP and immunoblotted with anti-Flag and anti-Strep antibodies. (C) IRF3 dimerization inhibition assay. HEK293T cells were transfected with Strep and GST-tagged IRF3 with Flag-DP96R dose-dependently. Cell lysates were subjected to GST PD and immunoblotted with anti-Flag, -GST, and -Strep antibodies. (D) Cellular fractionation assay. PAMs expressing Flag-DP96R, and its control plasmid were infected with ADV-GFP (1MOI) and harvested at indicated time points. Cytoplasmic and nuclear extracts were then subjected to immunoblot with anti-pIRF3, -IRF3, KPNA2, and KPNA4 antibodies. Lamin B1 and α-tubulin were used to confirm equal loading of proteins of nuclear and cytoplasmic fractions, respectively. (E) The histogram represents the relative quantification of the protein levels of the Western blot. Nuclear localization intensity of IRF3 quantified by IRF3 band intensity in nuclear fraction adjusted to nuclear Lamin B1 fraction. (F) PK-15 cells were transfected with the Flag control or Flag DP96R plasmid, followed by the Sev (1MOI) infection. Cells were fixed at indicated time points, followed by confocal microscopy assay with anti-IRF3, anti-Flag primary and anti-rabbit (green) and ant-mouse (red) secondary anti-bodies with DAPI (blue) to stain the nuclei. (G) By dividing the number of cells expressing nuclear expression of IRF3 by the total number of IRF3-positive cells, the percentages of cells demonstrating nuclear translocation of IRF3 were computed. All the immunoblot and confocal data represent at least two independent experiments, each with similar results. The scale bar represents 20 μM. Student’s t-test: **, p < 0.01; ***, p < 0.001.
Figure 3
Figure 3
DP96R impairs cGAS-STING signaling and transcription of antiviral genes. Flag-tagged DP96R stably expressing PAMs (A) and transfected PK-15 cells (B) were infected with ADV-GFP (1MOI), and cells were harvested at indicated time points. DP96R protein expression level and total and phosphorylated TBK1, IRF3, IKKα (pIKKα/β), IκBα, P65, and STAT1 were measured by immunoblotting. β-actin was used as a loading control indicator. PAMs (C) and PK-15 cells (D), expressing Flag-DP96R with Flag control, were mock-infected and infected with Adenovirus GFP (1MOI), and following 0 hpi and 24 hpi, total RNA was extracted at indicated time points. Quantitative RT-PCR analyzed the mRNA transcripts of the indicated genes relative to internal control of porcine GAPDH. All qRT-PCR data represent at least two independent experiments, each with similar results, and the values are expressed as the mean ± SD of two biological replicates. All the immunoblot data represent at least two independent experiments, each with similar results. Student’s t-test: *, p < 0.05; **, p < 0.01; ***, p < 0.001; ns, not significant.
Figure 4
Figure 4
DP96R impairs virus-induced innate immune responses. Stably expressing Flag-DP96R protein in PAMs and PIBs with Flag-control cells were infected with ADV-GFP (1MOI) (A,C) and HSV-GFP (1MOI) (B,D). Viral replication was determined at 24 hpi by GFP expression levels by fluorescence microscopy and quantified at 12 hpi and 24 hpi by a fluorescence modulator. The virus titers of each sample were determined by plaque assay in A549 cells and Vero cells. Porcine IFN-β and IL-6 secretion in cell culture supernatant at 12 hpi and 24 hpi were determined by ELISA (EH). Data represent at least two independent experiments, each with similar results, and the values are expressed as mean ± SD of three biological replicates. The scale bar represents 50 μM. Student’s t-test: *, p < 0.05; **, p < 0.01; ***, p < 0.001; ****, p < 0.0001.
Figure 5
Figure 5
DP96R impairs IRF3-KPNA interaction. (A) HEK293T cells were transfected with Flag-KPNA1-KPNA6 and its control plasmid along with the Strep IRF3 plasmid. Cell lysates were subjected to Flag IP and immunoblotted with anti-Strep and anti-Flag antibodies. (B) HEK293T cells were transfected with Flag-KPNA1-KPNA6, its control plasmid, and GST-IRF3-DBD mutant plasmid. Cell lysates were subjected to Flag IP and immunoblotted with anti-Flag and anti-GST antibodies. (CF) KPNA-DP96R competition assay. HEK293T cells were transfected with (C) Flag-KPNA1, (D) KPNA2, (E) KPNA3, (F) KPNA4, GST IRF3, its control, and Strep DP96R plasmids in a dose-dependent manner. Cell lysates were subjected to GST PD and immunoblotted with anti-Flag, -Strep, and -GST antibodies. (G) PAMs were infected with ADV-GFP (1MOI), and cells were harvested at indicated time points. Cell lysates were subjected to IRF3 IP and immunoblotted with anti-KPNA2, -KPNA4, -pIRF3, and -IRF3 antibodies. (H) PAMs were transfected with Flag-DP96R dose-dependently and infected with ADV-GFP (1MOI), and cells were harvested at indicated time points. Cell lysates were subjected to IP with IRF3 antibodies and immunoblotted with anti-KPNA2, -KPNA4, -pIRF3, -IRF3, and -Flag antibodies. Data represents at least two independent experiments, each with similar results.
Figure 6
Figure 6
DP96R interacts with the KPNA major binding site of IRF3. HEK293T cells were transfected with GST-IRF3-WT, GST-IRF3 (S97D) (A) or GST-IRF3 (97A) (B), and Strep-DP96R plasmid. Cell lysates were subjected to GST PD and immunoblotted with anti-Strep, and -GST antibodies. (C) KPNA4-DP96R competition assay. HEK293T cells were transfected with Flag-KPNA4, GST-IRF3 (S97A), its control, and Strep DP96R plasmid in a dose-dependent manner. Cell lysates were subjected to GST PD and immunoblotted with anti-Flag, -Strep, and -GST antibodies. (D,E) HEK293T cells were transfected with GST-IRF3-WT, GST-IRF3 (K77N, R78G), its control plasmid, and Flag-KPNA4 (D) or Strep-DP96R (E) plasmid. Cell lysates were subjected to GST PD and immunoblotted with anti-Flag, -Strep and -GST antibodies. (F,G) HEK293T cells were transfected with GST-IRF3-WT, GST-IRF3 (R86L, K87Q) and its control plasmid along with Flag-KPNA4 (F) or Strep-DP96R (G) plasmid. Cell lysates were subjected to GST PD and immunoblotted with anti-Flag, -Strep, and -GST antibodies. Data represents at least two independent experiments, each with similar results.
Figure 7
Figure 7
DP96R protein is transcribed early, inhibiting the transcription of IFNs and ISGs. Primary PAMs were infected with ASFV at 0.5 MOI and harvested at indicated time points. DP96R, CP302L, and B646L transcription expression levels during ASFV infection were determined by qRT-PCR. The p30 and p72 are shown as indicators of early and late genes, respectively (A). Primary PAMs in 24-well plates were transfected with the siRNAs against the DP96R or control siRNA for 6 h and then infected with the ASFV at an MOI of 0.5. The transcription levels of the indicated genes in the ASFV-infected primary PAMs were examined at 12 hpi (B,C). Data represents two independent experiments, each with similar results, and all the values are expressed as mean ± SD of two biological replicates. Student’s t-test: **, p < 0.01; ***, p < 0.001.

Similar articles

Cited by

References

    1. Dixon L.K., Sun H., Roberts H. African swine fever. Antivir. Res. 2019;165:34–41. doi: 10.1016/j.antiviral.2019.02.018. - DOI - PubMed
    1. Galindo I., Alonso C. African Swine Fever Virus: A Review. Viruses. 2017;9:103. doi: 10.3390/v9050103. - DOI - PMC - PubMed
    1. Gaudreault N.N., Madden D.W., Wilson W.C., Trujillo J.D., Richt J.A. African Swine Fever Virus: An Emerging DNA Arbovirus. Front. Vet. Sci. 2020;7:215. doi: 10.3389/fvets.2020.00215. - DOI - PMC - PubMed
    1. Alonso C., Borca M., Dixon L., Revilla Y., Rodriguez F., Escribano J.M., ICTV Report Consortium ICTV Virus Taxonomy Profile: Asfarviridae. J. Gen. Virol. 2018;99:613–614. doi: 10.1099/jgv.0.001049. - DOI - PubMed
    1. Wilkinson P. The persistence of African swine fever in Africa and the Mediterranean. Prev. Vet. Med. 1984;2:71–82. doi: 10.1016/0167-5877(84)90050-3. - DOI

LinkOut - more resources