

Enhanced Expression of Glycolytic Enzymes and Succinate Dehydrogenase Complex Flavoprotein Subunit A by Mesothelin Promotes Glycolysis and Mitochondrial Respiration in Myeloblasts of Acute Myeloid Leukemia
- PMID: 38396817
- PMCID: PMC10888725
- DOI: 10.3390/ijms25042140
Enhanced Expression of Glycolytic Enzymes and Succinate Dehydrogenase Complex Flavoprotein Subunit A by Mesothelin Promotes Glycolysis and Mitochondrial Respiration in Myeloblasts of Acute Myeloid Leukemia
Abstract
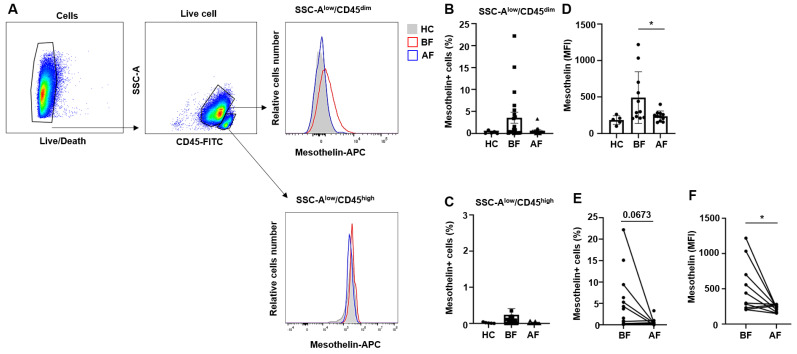
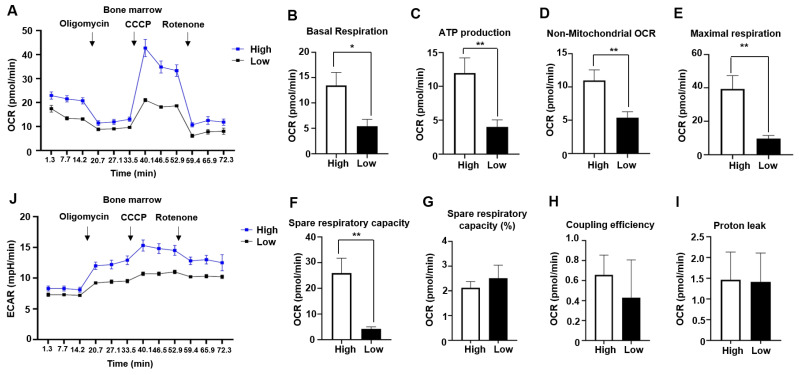
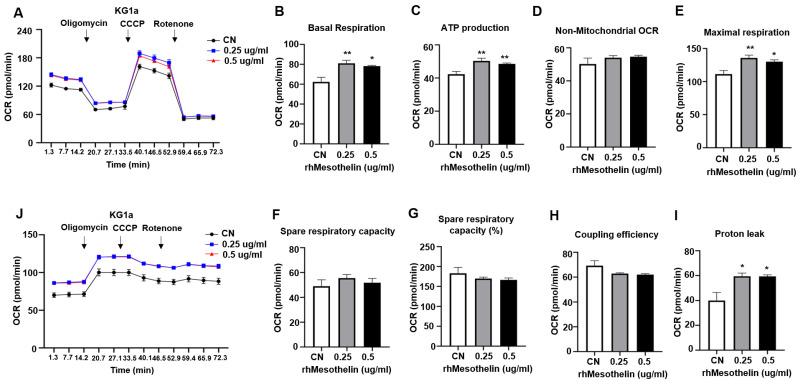
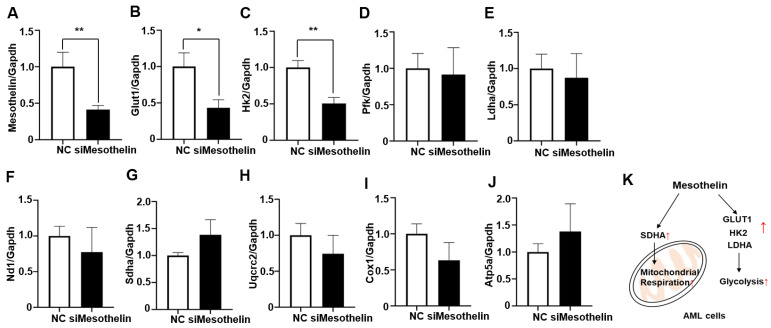
Acute myeloid leukemia (AML) is an aggressive malignancy characterized by rapid growth and uncontrolled proliferation of undifferentiated myeloid cells. Metabolic reprogramming is commonly observed in the bone marrow of AML patients, as leukemia cells require increased ATP supply to support disease progression. In this study, we examined the potential role of mesothelin as a metabolic modulator in myeloid cells in AML. Mesothelin is a well-known marker of solid tumors that promotes cancer cell proliferation and survival. We initially analyzed alterations in mesothelin expression in the myeloblast subpopulations, defined as SSC-Alow/CD45dim, obtained from the bone marrow of AML patients using flow cytometry. Our results showed overexpression of mesothelin in 34.8% of AML patients. Subsequently, metabolic changes in leukemia cells were evaluated by comparing the oxygen consumption rates (OCR) of bone marrow samples derived from adult AML patients. Notably, a higher OCR was observed in the mesothelin-positive compared to the mesothelin-low and non-expressing groups. Treatment with recombinant human mesothelin protein enhanced OCR and increased the mRNA expression of glycolytic enzymes and mitochondrial complex II in KG1α AML cells. Notably, siRNA targeting mesothelin in KG1α cells led to the reduction of glycolysis-related gene expression but had no effect on the mitochondrial complex gene. The collective results demonstrate that mesothelin induces metabolic changes in leukemia cells, facilitating the acquisition of a rapid supply of ATP for proliferation in AML. Therefore, the targeting of mesothelin presents a potentially promising approach to mitigating the progression of AML through the inhibition of glycolysis and mitochondrial respiration in myeloid cells.
Keywords: acute myeloid leukemia; glycolysis; mesothelin; oxygen consumption rate.
Conflict of interest statement
The authors declare no conflicts of interest.
Figures


Similar articles
-
L‑Deprenyl exerts cytotoxicity towards acute myeloid leukemia through inhibition of mitochondrial respiration.Oncol Rep. 2018 Dec;40(6):3869-3878. doi: 10.3892/or.2018.6753. Epub 2018 Oct 1. Oncol Rep. 2018. PMID: 30272370
-
FBP1-Altered Carbohydrate Metabolism Reduces Leukemic Viability through Activating P53 and Modulating the Mitochondrial Quality Control System In Vitro.Int J Mol Sci. 2022 Sep 27;23(19):11387. doi: 10.3390/ijms231911387. Int J Mol Sci. 2022. PMID: 36232688 Free PMC article.
-
Mapping of Functional Metabolic Phenotypes in Acute Myeloid Leukemia.Cancer Med. 2025 May;14(10):e70950. doi: 10.1002/cam4.70950. Cancer Med. 2025. PMID: 40386930 Free PMC article.
-
Immunotherapy targeting mesothelin in acute myeloid leukemia.J Leukoc Biol. 2022 Oct;112(4):813-821. doi: 10.1002/JLB.5MR0622-483R. Epub 2022 Aug 10. J Leukoc Biol. 2022. PMID: 35946307 Review.
-
[Newest Reaserch Advance on Targeting Glycolysis Pathways in Acute Myeloid Leukemia --Review].Zhongguo Shi Yan Xue Ye Xue Za Zhi. 2020 Apr;28(2):690-694. doi: 10.19746/j.cnki.issn.1009-2137.2020.02.056. Zhongguo Shi Yan Xue Ye Xue Za Zhi. 2020. PMID: 32319418 Review. Chinese.
References
-
- Satta T., Li L., Chalasani S.L., Hu X., Nkwocha J., Sharma K., Kmieciak M., Rahmani M., Zhou L., Grant S. Dual mTORC1/2 Inhibition Synergistically Enhances AML Cell Death in Combination with the BCL2 Antagonist Venetoclax. Clin. Cancer Res. 2023;29:1332–1343. doi: 10.1158/1078-0432.CCR-22-2729. - DOI - PMC - PubMed
MeSH terms
Substances
Grants and funding
- 2021R1C1C10123971331482092640103, RS-2023-00238188/National Research Foundation of Korea (NRF) grant funded by the Korea government (MSIT)
- HI22C1212, HR20C0025/Korea Health Technology R&D Project through the Korea 19 Health Industry Development Institute (KHIDI), funded by the Ministry of Health & Welfare, Republic of 20 Korea
LinkOut - more resources
Full Text Sources
Medical
Molecular Biology Databases
