

Reduced Glycolysis and Cytotoxicity in Staphylococcus aureus Isolates from Chronic Rhinosinusitis as Strategies for Host Adaptation
- PMID: 38396905
- PMCID: PMC10888669
- DOI: 10.3390/ijms25042229
Reduced Glycolysis and Cytotoxicity in Staphylococcus aureus Isolates from Chronic Rhinosinusitis as Strategies for Host Adaptation
Abstract
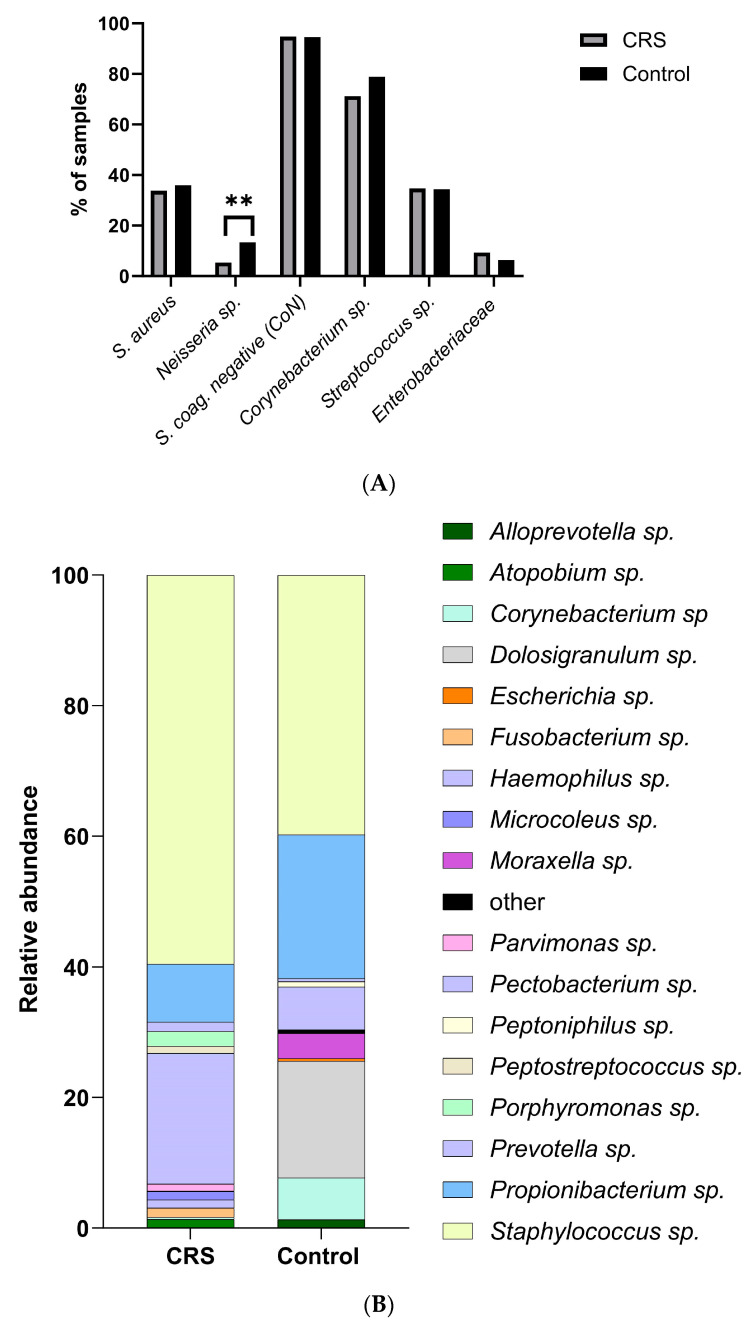
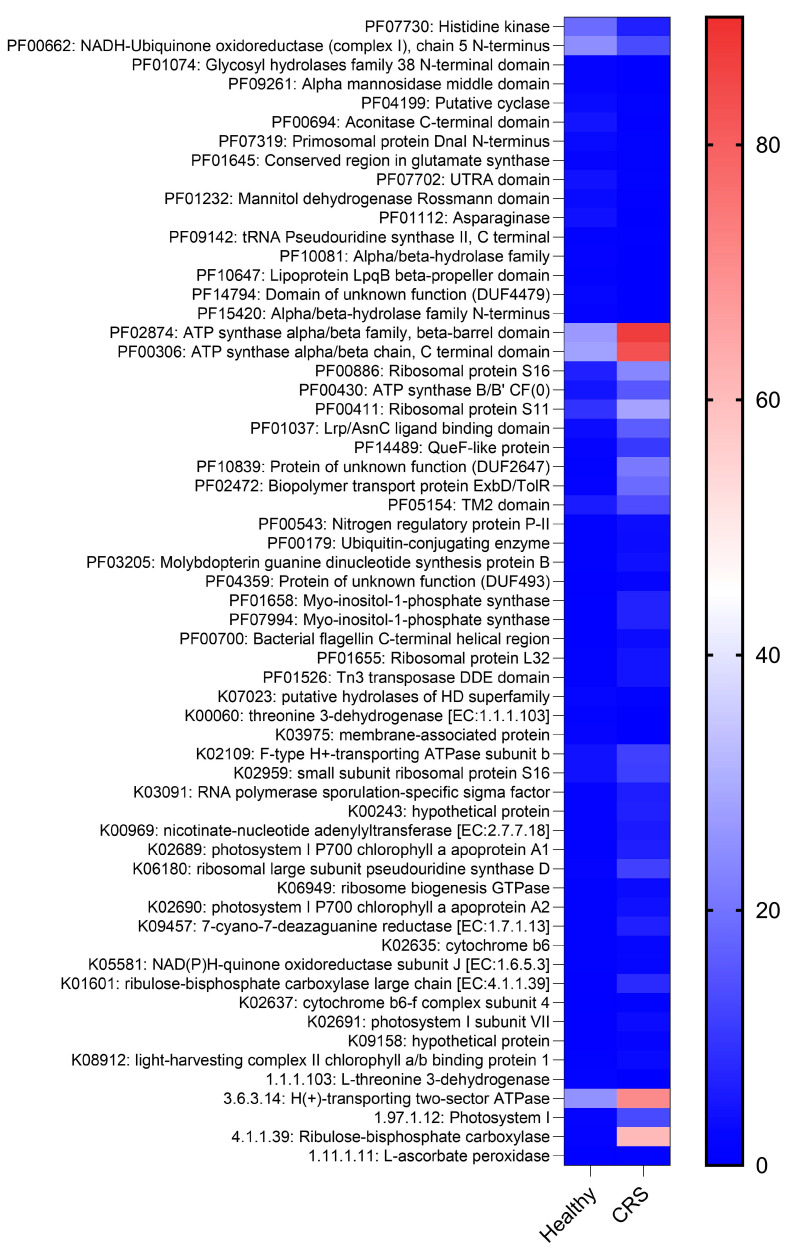
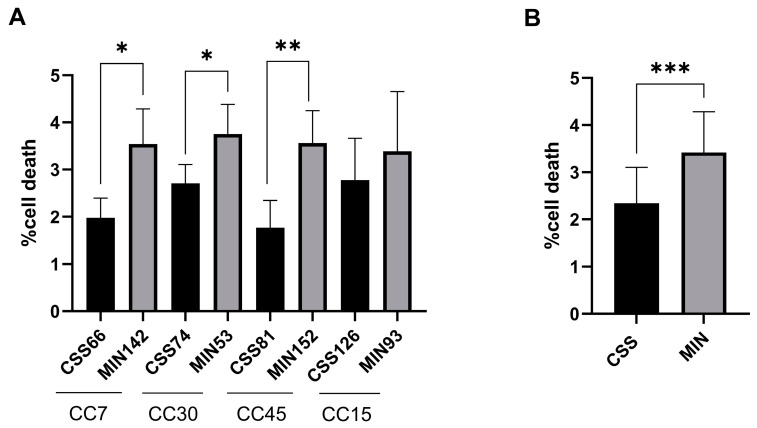
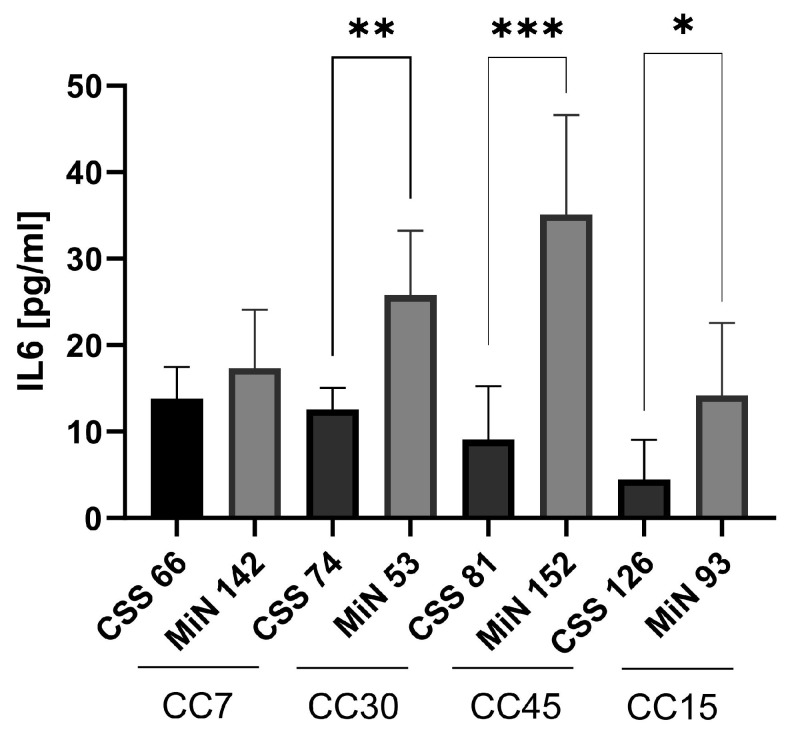
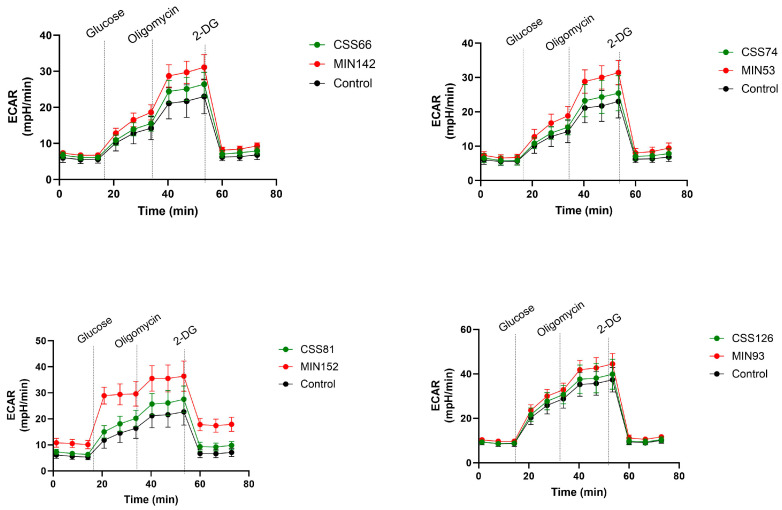
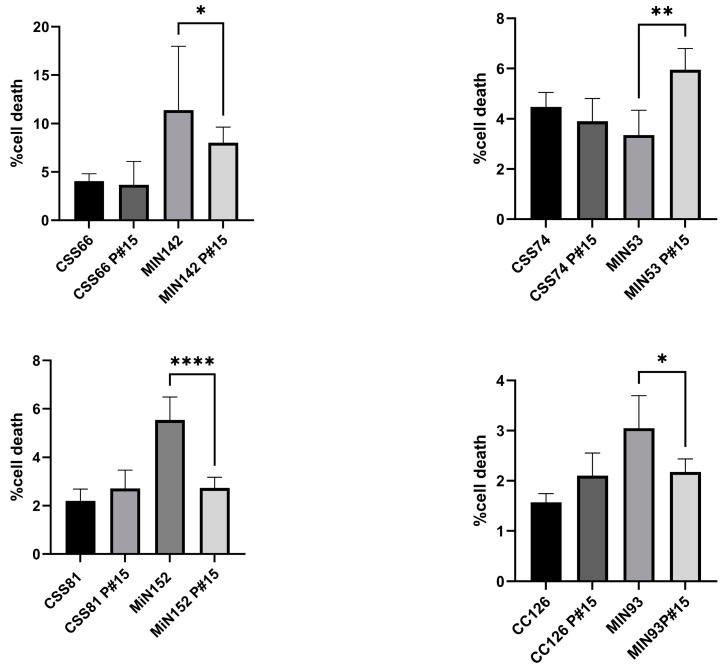
Chronic rhinosinusitis (CRS) is a multifactorial infection of the nasal cavity and sinuses. In this study, nasal swabs from control donors (N = 128) and patients with CRS (N = 246) were analysed. Culture methods and metagenomics revealed no obvious differences in the composition of the bacterial communities between the two groups. However, at the functional level, several metabolic pathways were significantly enriched in the CRS group compared to the control group. Pathways such as carbohydrate transport metabolism, ATP synthesis, cofactors and vitamins, photosynthesis and transcription were highly enriched in CRS. In contrast, pathways related to lipid metabolism were more representative in the control microbiome. As S. aureus is one of the main species found in the nasal cavity, staphylococcal isolates from control and CRS samples were analysed by microarray and functional assays. Although no significant genetic differences were detected by microarray, S. aureus from CRS induced less cytotoxicity to lung cells and lower rates of glycolysis in host cells than control isolates. These results suggest the differential modulation of staphylococcal virulence by the environment created by other microorganisms and their interactions with host cells in control and CRS samples. These changes were reflected in the differential expression of cytokines and in the expression of Agr, the most important quorum-sensing regulator of virulence in S. aureus. In addition, the CRS isolates remained stable in their cytotoxicity, whereas the cytotoxic activity of S. aureus isolated from control subjects decreased over time during in vitro passage. These results suggest that host factors influence the virulence of S. aureus and promote its adaptation to the nasal environment during CRS.
Keywords: Staphylococcus aureus; chronic rhinosinusitis; microbiome.
Conflict of interest statement
The authors declare no conflicts of interest.
Figures
Similar articles
-
The characteristics of intramucosal bacteria in chronic rhinosinusitis: a prospective cross-sectional analysis.Int Forum Allergy Rhinol. 2013 May;3(5):349-54. doi: 10.1002/alr.21117. Epub 2012 Nov 28. Int Forum Allergy Rhinol. 2013. PMID: 23193001
-
Detection and quantification of Staphylococcus in chronic rhinosinusitis.Int Forum Allergy Rhinol. 2019 Dec;9(12):1462-1469. doi: 10.1002/alr.22425. Epub 2019 Sep 4. Int Forum Allergy Rhinol. 2019. PMID: 31483577
-
Prophages encoding human immune evasion cluster genes are enriched in Staphylococcus aureus isolated from chronic rhinosinusitis patients with nasal polyps.Microb Genom. 2021 Dec;7(12):000726. doi: 10.1099/mgen.0.000726. Microb Genom. 2021. PMID: 34907894 Free PMC article.
-
Staphylococcus aureus and endoscopic sinus surgery.Curr Opin Otolaryngol Head Neck Surg. 2006 Feb;14(1):19-22. doi: 10.1097/01.moo.0000193172.69697.08. Curr Opin Otolaryngol Head Neck Surg. 2006. PMID: 16467633 Review.
-
Bacterial biofilms and chronic rhinosinusitis.Allergy Asthma Proc. 2013 Jul-Aug;34(4):335-341. doi: 10.2500/aap.2013.34.3665. Epub 2013 Mar 7. Allergy Asthma Proc. 2013. PMID: 23484638 Review.
References
-
- Dietz de Loos D., Lourijsen E.S., Wildeman M.A.M., Freling N.J.M., Wolvers M.D.J., Reitsma S., Fokkens W.J. Prevalence of chronic rhinosinusitis in the general population based on sinus radiology and symptomatology. J. Allergy Clin. Immunol. 2019;143:1207–1214. doi: 10.1016/j.jaci.2018.12.986. - DOI - PubMed
MeSH terms
Grants and funding
LinkOut - more resources
Full Text Sources
Medical
Research Materials
Miscellaneous
