. 2024 Feb 13;25(4):2231.
doi: 10.3390/ijms25042231.

Sex-Dependent Differences in the Ischemia/Reperfusion-Induced Expression of AMPA Receptors

Affiliations

Sex-Dependent Differences in the Ischemia/Reperfusion-Induced Expression of AMPA Receptors

Lindsay M Achzet et al. Int J Mol Sci. .

Abstract

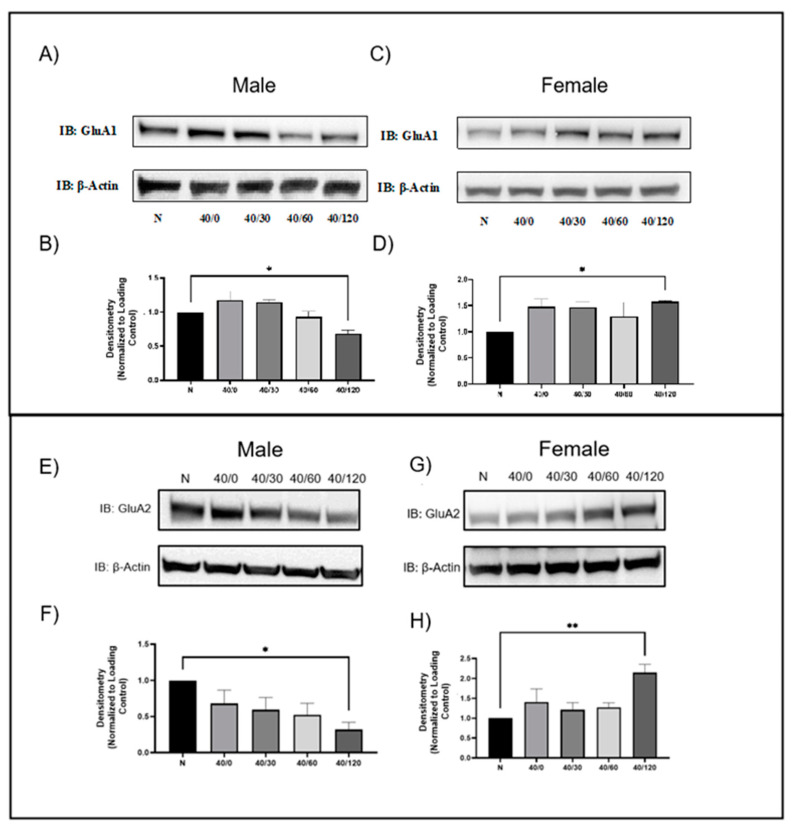
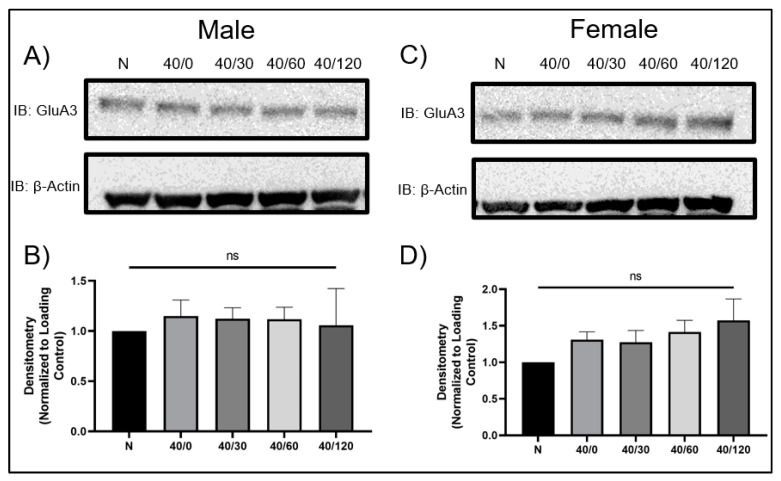
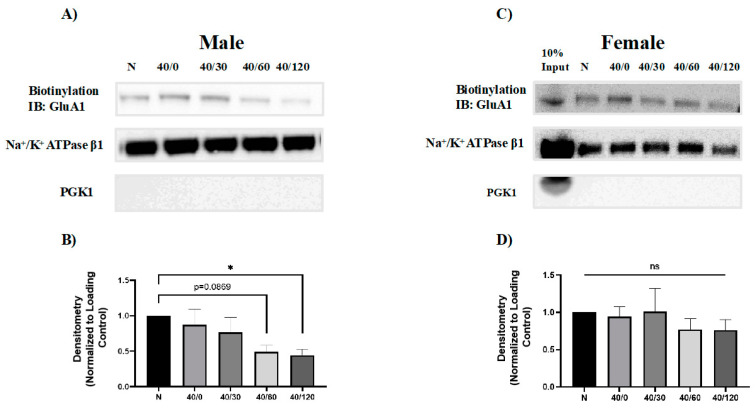
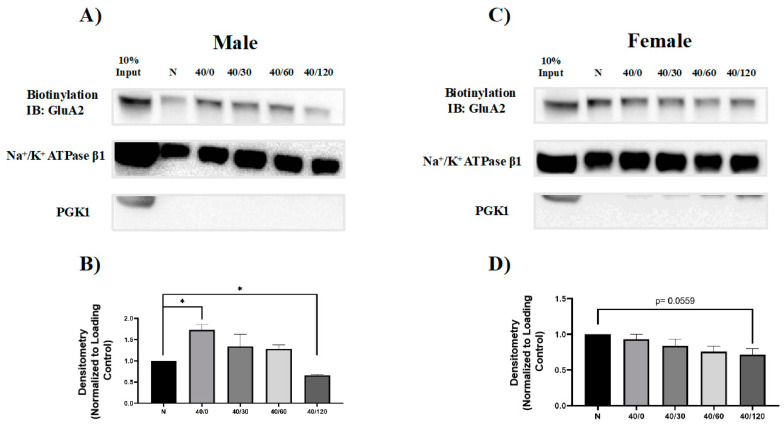
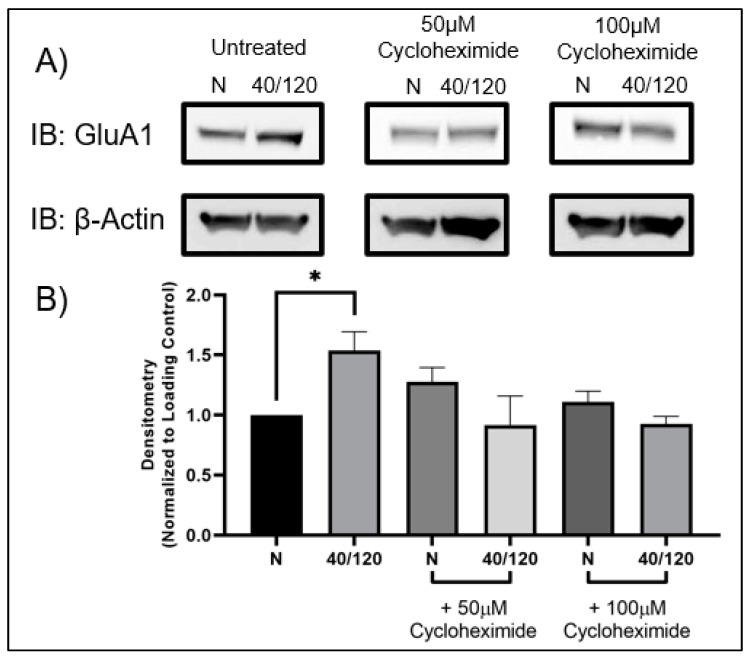
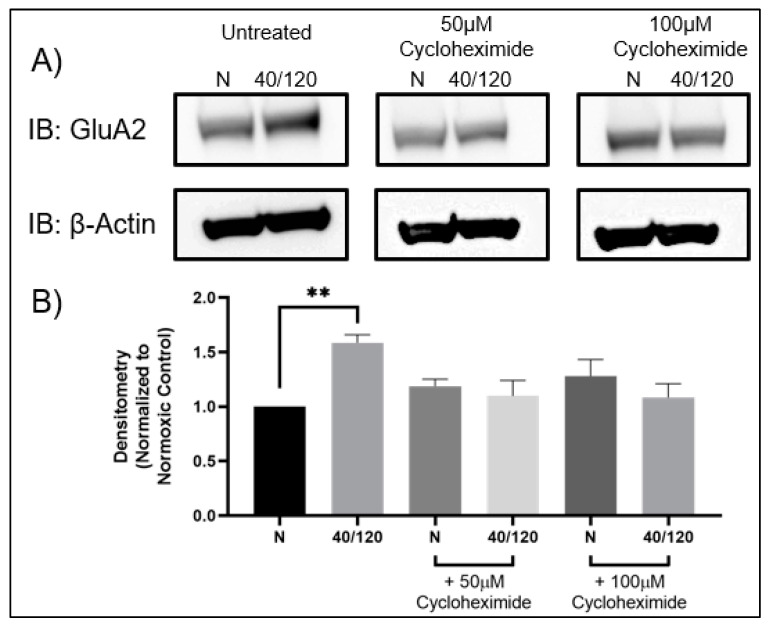
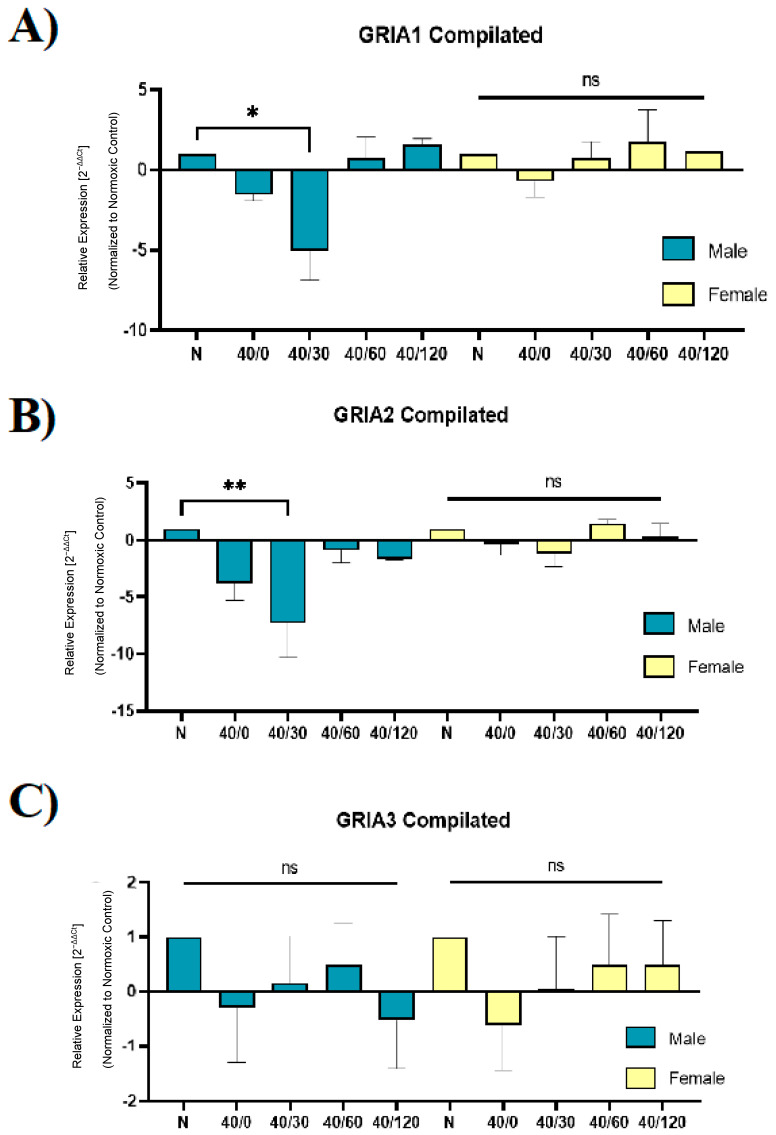
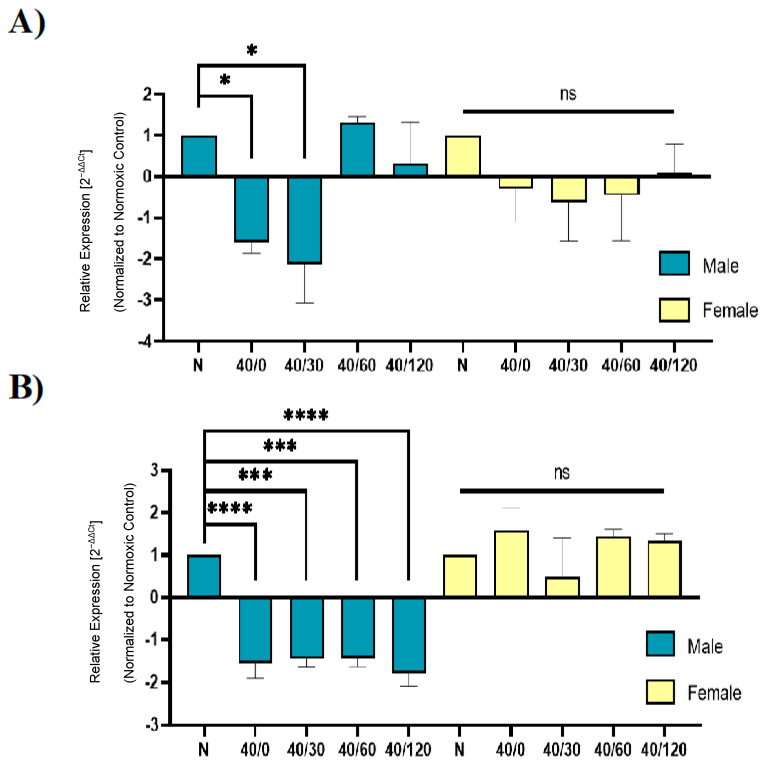
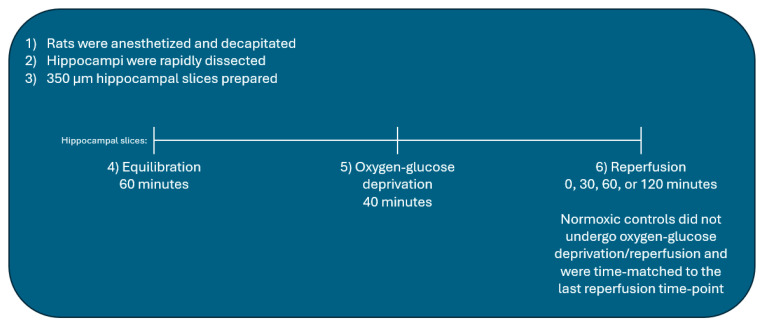
Following ischemia/reperfusion, AMPA receptors (AMPARs) mediate pathologic delayed neuronal death through sustained expression of calcium-permeable AMPARs, leading to excitotoxicity. Preventing the surface removal of GluA2-containing AMPARs may yield new therapeutic targets for the treatment of ischemia/reperfusion. This study utilized acute organotypic hippocampal slices from aged male and female Sprague Dawley rats and subjected them to oxygen-glucose deprivation/reperfusion (OGD/R) to examine the mechanisms underlying the internalization and degradation of GluA2-containing AMPARs. We determined the effect of OGD/R on AMPAR subunits at the protein and mRNA transcript levels utilizing Western blot and RT-qPCR, respectively. Hippocampal slices from male and female rats responded to OGD/R in a paradoxical manner with respect to AMPARs. GluA1 and GluA2 AMPAR subunits were degraded following OGD/R in male rats but were increased in female rats. There was a rapid decrease in GRIA1 (GluA1) and GRIA2 (GluA2) mRNA levels in the male hippocampus following ischemic insult, but this was not observed in females. These data indicate a sex-dependent difference in how AMPARs in the hippocampus respond to ischemic insult, and may help explain, in part, why premenopausal women have a lower incidence/severity of ischemic stroke compared with men of the same age.

Keywords: AMPA receptor; GluA2; degradation; hippocampus; ischemic/reperfusion injury; mRNA; oxygen glucose deprivation.


Conflict of interest statement

The authors declare no conflicts of interest.

Figures

Figure 1
Figure 1
GluA1 and GluA2 decreased with OGD/R in male hippocampal slices, but GluA1 and GluA2 increased in female hippocampal slices following OGD/R. (A) Representative Western blot demonstrating that GluA1 decreases in male hippocampal slices following OGD/R, maximally at 120 min of reperfusion. (B) Quantification of (A) of total GluA1 protein levels normalized to β-Actin and normoxic control group (N = 4). (C) Representative Western blot demonstrating that GluA1 increases in female hippocampal slices following OGD/R, maximally at 120 min of reperfusion. (D) Quantification of (C) of total GluA1 protein levels normalized to β-Actin and normoxic control group (N = 4). (E) Representative Western blot demonstrating that GluA2 decreases in male hippocampal slices following OGD/R, maximally at 120 min of reperfusion. (F) Quantification of (E) of total GluA2 protein levels normalized to β-Actin and normoxic control group (N = 4). (G) Representative Western blot demonstrating that GluA2 increases in female hippocampal slices following OGD/R, maximally at 120 min of reperfusion. (H) Quantification of (G) of total GluA2 protein levels normalized to β-Actin and normoxic control group (N = 4). * p < 0.05; ** p < 0.01; ANOVA with Sidak post hoc test comparing OGD/R conditions corresponding to control (normoxic). Data are expressed as mean ± SEM.
Figure 2
Figure 2
OGD/R induces degradation of GluA2 in male hippocampal slices and increases GluA2 protein levels in female hippocampal slices. (A) Representative Western blot demonstrating that GluA2 decreases in male hippocampal slices following OGD/R, maximally at 120 min of reperfusion. (B) Quantification of (A) of total GluA2 protein levels normalized to β-Actin and normoxic control group (N = 4). (C) Representative Western blot demonstrating that GluA2 increases in female hippocampal slices following OGD/R, maximally at 120 min of reperfusion. (D) Quantification of (C) of total GluA2 protein levels normalized to β-Actin and normoxic control group (N = 4). ANOVA with Sidak post hoc test comparing OGD/R conditions corresponding to control (normoxic). Data are expressed as mean ± SEM.
Figure 3
Figure 3
OGD/R reduces surface levels of GluA1 AMPAR subunits in male hippocampal slices but does not alter surface levels of GluA1 in female hippocampal slices. Surface proteins were biotinylated and resolved by immunoblotting to examine the amount of GluA1 AMPAR protein at the membrane surface. (A) Representative Western blot demonstrating that surface GluA1 decreases in male hippocampal slices with OGD/R. (B) Quantification of (A) of surface GluA1 protein levels normalized to Na/K ATPase β1 and normoxic control group (N = 4). (C) Representative Western blot demonstrating that surface GluA1 does not change in female hippocampal slices following OGD/R. (D) Quantification of (C) of surface GluA1 protein levels normalized to Na/K ATPase β1 and normoxic control group (N = 4). * p < 0.05; ANOVA with Sidak post hoc test comparing OGD/R conditions corresponding to control (normoxic). Data are expressed as mean ± SEM.
Figure 4
Figure 4
Sex-dependent differences in amount of surface GluA2 with OGD/R treatment in male and female hippocampal slices. Surface proteins were biotinylated and resolved by immunoblotting to examine the amount of GluA2 AMPAR protein at the membrane surface. (A) Representative Western blot demonstrating an initial increase in surface GluA2 levels with OGD, and then a significant decrease in surface GluA2 with reperfusion at 120 min in male hippocampal slices. (B) Quantification of (A) of surface GluA2 protein levels normalized to Na/K ATPase β1 and normoxic control group (N = 4). (C) Representative Western blot demonstrating that surface GluA2 trends toward decreasing in female hippocampal slices following OGD/R. (D) Quantification of (C) of surface GluA2 protein levels normalized to Na/K ATPase β1 and normoxic control group (N = 4). * p < 0.05; ANOVA with Sidak post hoc test comparing OGD/R conditions corresponding to control (normoxic). Data are expressed as mean ± SEM.
Figure 5
Figure 5
OGD/R-induced increase in GluA1 is due to increased protein translation in female hippocampal slices. Female hippocampal slices were exposed to 40 min of OGD and then reperfused for 120 min in the presence or absence of cycloheximide [50 µM] or [100 µM], an inhibitor for protein synthesis. (A) Representative Western blot demonstrating that pre-treatment with cycloheximide prevents the OGD/R-induced increase in GluA1 AMPAR subunits in female hippocampal slices. (B) Quantification of (A) of total GluA1 protein levels normalized to β-Actin and normoxic control group (N = 3). * p < 0.05; ANOVA with Sidak post hoc test comparing OGD/R and drug treatments corresponding to control (normoxic). Data are expressed as mean ± SEM.
Figure 6
Figure 6
OGD/R-induced increase in GluA2 is due to increased protein translation in female hippocampal slices. Female hippocampal slices were exposed to 40 min of OGD and then reperfused for 120 min in the presence or absence of cycloheximide [50 µM] or [100 µM], an inhibitor for protein synthesis. (A) Representative Western blot demonstrating that pre-treatment with cycloheximide prevents the OGD/R-induced increase in GluA2 AMPAR subunits in female hippocampal slices. (B) Quantification of (A) of total GluA2 protein levels normalized to β-Actin and normoxic control group (N = 3). ** p < 0.01; ANOVA with Sidak post hoc test comparing OGD/R and drug treatments corresponding to control (normoxic). Data are expressed as mean ± SEM.
Figure 7
Figure 7
OGD/R decreases GRIA1 and GRIA2 expression following OGD/R in male hippocampal slices, but OGD/R does not significantly affect female GRIA1 and GRIA2 expression in hippocampal slices. Utilizing rt-qPCR, we examined the expression of GRIA1 (GluA1), GRIA2 (GluA2), and GRIA3 (GluA3) with OGD/R treatment. (A) Expression of GRIA1 in male and female hippocampal slices with OGD/R treatment, normalized to normoxic control group and ActB (β-Actin) (N = 3). (B) Expression of GRIA2 in male and female hippocampal slices with OGD/R treatment, normalized to normoxic control group and ActB (β-Actin) (N = 3). (C) Expression of GRIA3 in male and female hippocampal slices with OGD/R treatment, normalized to normoxic control group and ActB (β-Actin) (N = 3). * p < 0.05; ** p < 0.01; ns denotes no significance. ANOVA with Sidak post hoc test comparing OGD/R values (2−ΔΔCt ) corresponding to normoxic control. Data are expressed as mean ± SEM.
Figure 8
Figure 8
OGD/R decreases ADARB2 expression and GRIA2Q/R edited (Q/R GluA2) following OGD/R in male hippocampal slices. ADARB2 and Q/R-edited GRIA2 expression levels are unaffected with OGD/R in female hippocampal slices. Utilizing rt-qPCR, we examined the expression of ADARB2 (ADAR2) and GRIA2Q/R (Q/R-edited GluA2) with OGD/R treatment. (A) Expression of ADARB2 in male and female hippocampal slices with OGD/R treatment, normalized to normoxic control group and ActB (β-Actin) (N = 3). (B) Expression of Q/R-edited GRIA2 in male and female hippocampal slices with OGD/R treatment, normalized to normoxic control group and ActB (β-Actin) (N = 3). * p < 0.05; *** p < 0.001; **** p < 0.0001; ns denotes no significance. ANOVA with Sidak post hoc test comparing OGD/R values (2−ΔΔCt ) corresponding to normoxic control. Data are expressed as mean ± SEM.
Figure 9
Figure 9
Hippocampal slice experimental methodology.

Similar articles

References

    1. Yang Q., Tong X., Shieb L., Vaughan A., Gillespie C., Wiltz J.L., King S.C., Odom E., Merritt R., Hong Y. Recent trends in stroke death rates-United States, 2000–2015. MMWR Morb. Mortal. Wkly. Rep. 2017;66:933–939. doi: 10.15585/mmwr.mm6635e1. - DOI - PMC - PubMed
    1. Marier J. Tissue plasminogen activator for acute ischemic stroke. N. Engl. J. Med. 1995;333:1581–1587. - PubMed
    1. Faden A., Demediuk P., Panter S.S., Vink R. The role of excitatory amino acids in traumatic brain injury. Science. 1989;244:798–800. doi: 10.1126/science.2567056. - DOI - PubMed
    1. Mcintosh T.K., Vink R., Soares H., Hayes R., Simon R. Effects of the N-methyl-D-aspartate receptor blocker MK-801 on neurologic function after experimental brain injury. J. Neurotrauma. 1989;6:247–259. doi: 10.1089/neu.1989.6.247. - DOI - PubMed
    1. Takagi N., Shinno K., Teves L., Bissoon N., Wallace M.C., Gurd J.W. Transient ischemia differentially increases tyrosine phosphorylation of NMDAR receptor subunits 2A and 2B. J. Neurochem. 1997;69:1060–1065. doi: 10.1046/j.1471-4159.1997.69031060.x. - DOI - PubMed

LinkOut - more resources