

Untargeted Metabolomic Profiling Reveals Differentially Expressed Serum Metabolites and Pathways in Type 2 Diabetes Patients with and without Cognitive Decline: A Cross-Sectional Study
- PMID: 38396924
- PMCID: PMC10889568
- DOI: 10.3390/ijms25042247
Untargeted Metabolomic Profiling Reveals Differentially Expressed Serum Metabolites and Pathways in Type 2 Diabetes Patients with and without Cognitive Decline: A Cross-Sectional Study
Abstract
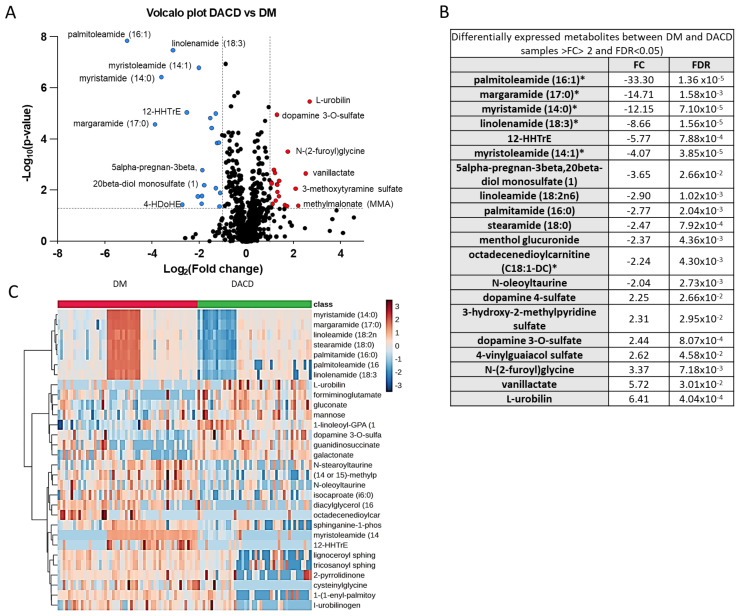
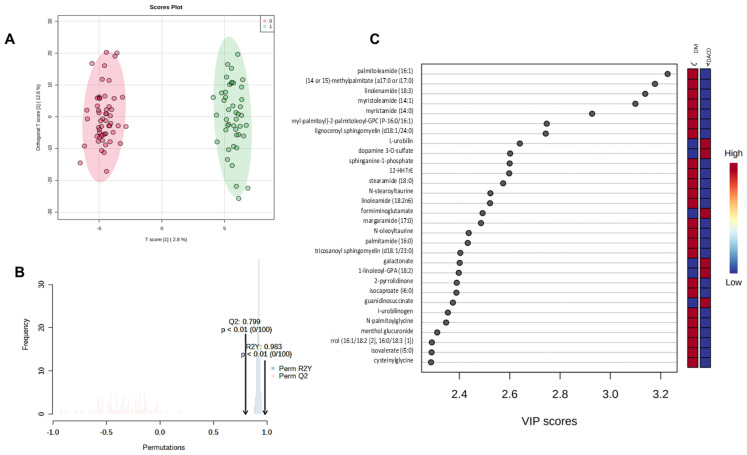
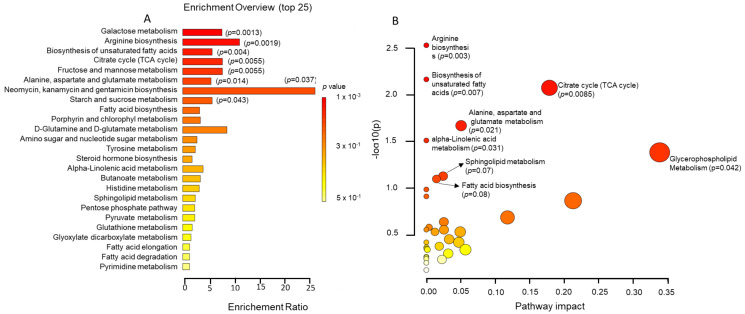
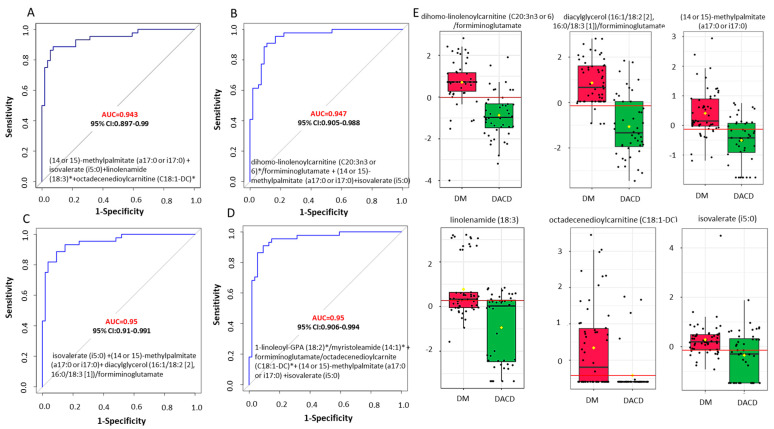
Diabetes is recognized as a risk factor for cognitive decline, but the underlying mechanisms remain elusive. We aimed to identify the metabolic pathways altered in diabetes-associated cognitive decline (DACD) using untargeted metabolomics. We conducted liquid chromatography-mass spectrometry-based untargeted metabolomics to profile serum metabolite levels in 100 patients with type 2 diabetes (T2D) (54 without and 46 with DACD). Multivariate statistical tools were used to identify the differentially expressed metabolites (DEMs), and enrichment and pathways analyses were used to identify the signaling pathways associated with the DEMs. The receiver operating characteristic (ROC) analysis was employed to assess the diagnostic accuracy of a set of metabolites. We identified twenty DEMs, seven up- and thirteen downregulated in the DACD vs. DM group. Chemometric analysis revealed distinct clustering between the two groups. Metabolite set enrichment analysis found significant enrichment in various metabolite sets, including galactose metabolism, arginine and unsaturated fatty acid biosynthesis, citrate cycle, fructose and mannose, alanine, aspartate, and glutamate metabolism. Pathway analysis identified six significantly altered pathways, including arginine and unsaturated fatty acid biosynthesis, and the metabolism of the citrate cycle, alanine, aspartate, glutamate, a-linolenic acid, and glycerophospholipids. Classifier models with AUC-ROC > 90% were developed using individual metabolites or a combination of individual metabolites and metabolite ratios. Our study provides evidence of perturbations in multiple metabolic pathways in patients with DACD. The distinct DEMs identified in this study hold promise as diagnostic biomarkers for DACD patients.
Keywords: dementia; diabetes-associated cognitive decline; metabolomics; mild cognitive impairment; type 2 diabetes.
Conflict of interest statement
Authors declare that the research was conducted in the absence of any commercial or financial relationships that could be construed as a potential conflict of interest.
Figures
Similar articles
-
Plasma metabolomic profiling of patients with diabetes-associated cognitive decline.PLoS One. 2015 May 14;10(5):e0126952. doi: 10.1371/journal.pone.0126952. eCollection 2015. PLoS One. 2015. PMID: 25974350 Free PMC article.
-
Serum Untargeted Metabolomics Reveal Potential Biomarkers of Progression of Diabetic Retinopathy in Asians.Front Mol Biosci. 2022 Jun 9;9:871291. doi: 10.3389/fmolb.2022.871291. eCollection 2022. Front Mol Biosci. 2022. PMID: 35755823 Free PMC article.
-
Untargeted metabolomic profiling reveals molecular signatures associated with type 2 diabetes in Nigerians.Genome Med. 2024 Mar 5;16(1):38. doi: 10.1186/s13073-024-01308-5. Genome Med. 2024. PMID: 38444015 Free PMC article.
-
Metabolomics of Type 1 and Type 2 Diabetes.Int J Mol Sci. 2019 May 18;20(10):2467. doi: 10.3390/ijms20102467. Int J Mol Sci. 2019. PMID: 31109071 Free PMC article. Review.
-
Metabolomics Signatures in Type 2 Diabetes: A Systematic Review and Integrative Analysis.J Clin Endocrinol Metab. 2020 Apr 1;105(4):dgz240. doi: 10.1210/clinem/dgz240. J Clin Endocrinol Metab. 2020. PMID: 31782507
Cited by
-
1H-NMR-Based Metabolomic Profiles of Zucchini (Cucurbita pepo L.) Grown with Different Agricultural Practices for Sustainable Crop Production.Foods. 2025 Mar 7;14(6):919. doi: 10.3390/foods14060919. Foods. 2025. PMID: 40231901 Free PMC article.
-
Advances in Metabolomics: A Comprehensive Review of Type 2 Diabetes and Cardiovascular Disease Interactions.Int J Mol Sci. 2025 Apr 10;26(8):3572. doi: 10.3390/ijms26083572. Int J Mol Sci. 2025. PMID: 40332079 Free PMC article. Review.
-
Metformin Activation of Sirtuin 3 Signaling Regulates Mitochondrial Function Improves Diabetes-Associated Cognitive Impairment.Diabetes Metab Syndr Obes. 2025 Jul 12;18:2317-2330. doi: 10.2147/DMSO.S516173. eCollection 2025. Diabetes Metab Syndr Obes. 2025. PMID: 40672059 Free PMC article.
References
-
- Clasen F., Nunes P.M., Bidkhori G., Bah N., Boeing S., Shoaie S., Anastasiou D. Systematic diet composition swap in a mouse genome-scale metabolic model reveals determinants of obesogenic diet metabolism in liver cancer. iScience. 2023;26:106040. doi: 10.1016/j.isci.2023.106040. - DOI - PMC - PubMed
-
- Gottesman R.F., Albert M.S., Alonso A., Coker L.H., Coresh J., Davis S.M., Deal J.A., McKhann G.M., Mosley T.H., Sharrett A.R., et al. Associations Between Midlife Vascular Risk Factors and 25-Year Incident Dementia in the Atherosclerosis Risk in Communities (ARIC) Cohort. JAMA Neurol. 2017;74:1246–1254. doi: 10.1001/jamaneurol.2017.1658. - DOI - PMC - PubMed
MeSH terms
Substances
Grants and funding
LinkOut - more resources
Full Text Sources
Medical
