Review
. 2024 Feb 13;25(4):2251.
doi: 10.3390/ijms25042251.

The Metabolic Syndrome, a Human Disease

Affiliations
Review

The Metabolic Syndrome, a Human Disease

Marià Alemany. Int J Mol Sci. .

Abstract

This review focuses on the question of metabolic syndrome (MS) being a complex, but essentially monophyletic, galaxy of associated diseases/disorders, or just a syndrome of related but rather independent pathologies. The human nature of MS (its exceptionality in Nature and its close interdependence with human action and evolution) is presented and discussed. The text also describes the close interdependence of its components, with special emphasis on the description of their interrelations (including their syndromic development and recruitment), as well as their consequences upon energy handling and partition. The main theories on MS's origin and development are presented in relation to hepatic steatosis, type 2 diabetes, and obesity, but encompass most of the MS components described so far. The differential effects of sex and its biological consequences are considered under the light of human social needs and evolution, which are also directly related to MS epidemiology, severity, and relations with senescence. The triggering and maintenance factors of MS are discussed, with especial emphasis on inflammation, a complex process affecting different levels of organization and which is a critical element for MS development. Inflammation is also related to the operation of connective tissue (including the adipose organ) and the widely studied and acknowledged influence of diet. The role of diet composition, including the transcendence of the anaplerotic maintenance of the Krebs cycle from dietary amino acid supply (and its timing), is developed in the context of testosterone and β-estradiol control of the insulin-glycaemia hepatic core system of carbohydrate-triacylglycerol energy handling. The high probability of MS acting as a unique complex biological control system (essentially monophyletic) is presented, together with additional perspectives/considerations on the treatment of this 'very' human disease.

Keywords: adipose organ; connective tissue; dietary nutrient handling; energy partition; inflammation; insulin; metabolic syndrome; protein-fueled anaplerosis; testosterone; β estradiol.


Conflict of interest statement

The author declares no conflicts of interests.

Figures

Figure 3
Figure 3
Energy balance. In black, explanation of the component; in red, expression of the component as part of the global energy balance equation. The components of the energy balance listed correspond to the management of energy taken from the medium and that returned to it, including the net gain/loss of energy accrued, but introduce an ‘extracorporeal’ element which we can define as biological contribution to the social group.
Figure 5
Figure 5
The ‘Krebs Cycle Anaplerotic Intermediates’ (KCAI). Most KCAI are generated by normal amino acid catabolism in human tissues. Other KCAI, such as propionate, are produced by the microbiota or as catabolites of odd-number carbons or methyl-branched fatty acids through β-oxidation. Krebs cycle: pale green rectangles and black solid arrows. Other intermediate metabolism: white rectangles, purple arrows. Lipid metabolism: yellow squares and purple arrows (AcAc = acetoacetate; FA = fatty acids). Amino acid catabolism: blue rectangles and blue arrows (alternative paths are marked with dashed lines). 1C represents the one-carbon pool metabolism. The amino acids susceptible to directly generate KCAI are marked with a green star (Hyp = hydroxyproline). In all, two/three-thirds of amino acid structures can generate KCAI. Those producing pyruvate, however, may eventually provide KCAI via pyruvate carboxylation.
Figure 6
Figure 6
Nutrient-related differences in the time needed for the substrates released through digestion to reach the portal or systemic blood. This graph has not been generated using hard homogeneous published data, but only textbook and scattered information on the time taken for digestion of the dietary nutrients derived from (an extremely wide range of) diets containing carbohydrates (largely sugars, starches, and resistant starches), proteins (of relatively high digestibility, low, or resistant), and fats. Ethanol (exogenous) is a 2C included as comparison. The time periods presented are lax and imprecise, but include the stay within the stomach and gut, as well as the time taken for lymph to be transported along the large thoracic conduct to the cava vein. The time taken for blood-carried substrates to travel from the intestinal wall to the liver has not been considered, given the extreme lassitude of the time marks used compared with the shortness of the cava and its high blood flow. The last two lines include an appreciation of the large amount of fluid moved along the process of digestion between the complete digestive tract and the rest of the body: first, facilitating an adequate milieu for blending, hydration, digestion, dissolution, absorption/triage, and deposition within the gut; second, the reabsorption of water (and electrolytes), together with nutrients and (soluble) waste molecules, with the final dehydration and conditioning of feces for smooth expulsion. The lines at the bottom of the graph show the main (arbitrarily established) period of absorption of carbohydrates, protein catabolites (mainly amino acids), and products of fat digestion. Despite all the caveats and extreme variability in the processes studied, a gap exists between the peak of carbohydrate-derived nutrients and that of protein-derived nutrients, which may be higher for dissociated diets (even when this dissociation does not refer to days but to meals).
Figure 9
Figure 9
Causal interrelationships between the different pathologies that integrate MS. The core of the MS is the establishment of an inflamed state in the CT–obesity relation (marked in the graph with a wider connection line). The different disorders, symptoms, mechanisms, and diseases are marked by rectangles. Titles in blue represent the organs or tissues, and the pathologies are in black. The “mass effect” stands for the consequences of obesity directly attributable to an increased body or organ/tissue mass (i.e., circulatory resistance, higher cardiovascular capacity, oxygen demand, and energy cost of movement). Up arrows (↑) represent increases, and down arrows (↓) decreases. Abbreviations: T = testosterone; E2 = 17β–estradiol, GC = glucocorticoids; AHT = arterial hypertension. Green arrows represent known causal or mechanistic interrelationships between the pathologic traits within the context of MS. The brown arrow represents a possible causal relationship, so far not proven.
Figure 1
Figure 1
Main relationships between the most common MS-constituent diseases/disorders. The graph is focused on the core of energy metabolism and its regulation in humans and the direct relationships between the different MS traits/pathologies, with regard to the main known mechanisms of endocrine/metabolic regulation. A few organs/tissues are shown as small rectangles with pale tan background. Pathologies and groups of disorders are shown in blue; main regulatory agents are presented in purple; and metabolic changes, effects, or processes are shown in black lettering. Inhibitions or blockages are represented by red arrows, activation or enhancements in green, and more complex regulatory or control effects are depicted with brown arrows. Black arrows show the direct production, secretion, or synthesis relationships. For clarity of the graph, not all known interrelations have been represented. Small arrows in the text (↑ and ↓) represent the modulation up or down of the parameter. This scheme is only a simplified (incomplete) presentation of the relationships hinted at in the text.
Figure 2
Figure 2
Gross mechanisms of ‘Clinical Inflammation’. The inflammatory processes are shown as black rectangles linked by arrows. Brown attached labels show the correspondences with Celsus-defined components of classic inflammation. Blue attached rectangles explain the agents and mechanisms responsible for the described effect. The actions developed during the recovery phase (i.e., after ceasing the inflammatory phase) are shown as green arrows.
Figure 4
Figure 4
Shift in the composition of digested food in the intestinal lumen to systemic blood due to the combined triage of molecules carried out by the intestine and liver. The main classes of nutrients present in the liver of a human omnivore (protein, fiber, carbohydrates [CH], and lipid). The arrows’ sizes represent the relative relevance of a number of processes related to the usual composition of human diets. The processes shown require a ‘signal-armored’ vein (the porta) because of the presence of bioactive compounds and usually high concentrations of common metabolites. This load of compounds requires homeostatic regulation of the liver (via modification, catabolism, and dilution), as well as taking-up, storing, or metabolizing compounds (when already in the partition mode) to minimize changes, as best as possible, iwithin the physiological range in the levels and distribution of systemic blood nutrients. Abbreviations used (from left intestine to right, and from the highest line to lowest): “NH” = small N-containing molecules, such as ammonia; AA = amino acid; KCAIs = Krebs cycle anaplerotic intermediate catabolites of amino acid metabolism (Figure 5); d3C = 3-hydrocarbon fragments with D conformation, such as D-lactate; 3C = 3-hydrocarbon fragments, with gluconeogenic potential, such as L-lactate, pyruvate, glycerol, alanine, serine, etc.; 2C = 2-carbon fragments (derived from 3C oxidative decarboxylation or generated in the β-oxidation of fatty acids, i.e., acetyl-CoA or acetate); 6C = 6-carbon carbohydrate units, i.e., hexoses, largely glucose ((or fructose, galactose) but also pentoses, obviously containing 5C, but catabolically restructured to 3C or 6C via the pentose-P pathway and confluent pathways); FA = fatty acids, essentially formed by the sequential incorporation of 2C units and oxidized via β-oxidation; scFA = short-chain fatty acids, such as propionate (a KCAI, but not in fact a canonical 3C) and butyrate, largely microbiota products of high regulatory importance; Cho = cholesterol (and some of its derivatives, essentially sterols); N2 = nitrogen gas, the ultimate excreta of the ‘alternative’ amino-disposal pathway; UREA = urea; TAGs = triacylglycerols; KB = ‘ketone bodies’, i.e., 3OH-butyrate, acetoacetate (and acetone); Cho* = cholesterol, including both dietary (i.e., that brought in with the portal blood) and that synthesized in the liver from 2C via the mevalonate pathway; LP(TAG-Cho) = lipoproteins, mainly VLDL, containing TAGs and cholesterol.
Figure 7
Figure 7
Simplified representation of the process of assimilation of nutrients, substrates partition, and their relationship with organ metabolism and body energy reserves. The core of partition is the programmed efficient use of available amino acids (AA), fatty acids (FAs), and carbohydrate units (6C) to fuel the tissues’ needs via the breakup and oxidative catabolism of (a) TAG and FA, (b) 6C and 3C, and (c) protein-derived amino acids. This is complemented by the elimination of catabolites (CO2, urea, N2, and water, not depicted in the graph). The essential path for the generation of energy from the available substrates is marked with a red border: the transition of 3C (i.e., lactate/pyruvate) to 2C (acetyl CoA, via pyruvate dehydrogenase complex) and, finally, to CO2 (through the whole Krebs cycle) inside the mitochondria. In this graph, this process represents the metabolic changes taking place in the liver, as the first recipient of the nutrient load discharged from the gut, but this mechanism is mimicked (with a few variations) by almost every other tissue/organ/cell of the body. The necessary conjoint catabolism of amino acids and that of 3C/2C units in the mitochondria is first facilitated by the anaplerotic effect of KCAI (dotted green line) and is a highly regulated and resilient system by which most of our energy needs are covered.
Figure 8
Figure 8
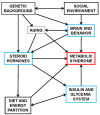
Main factors implied in the development of MS.

References

    1. Miranda P.J., DeFronzo R.A., Califf R.M., Guyton J.R. Metabolic syndrome: Definition, pathophysiology, and mechanisms. Am. Heart J. 2005;149:33–45. doi: 10.1016/j.ahj.2004.07.013. - DOI - PubMed
    1. Hanefeld M., Leonhardt W. Das metabolische syndrom. Dtsch. Gesundheitsw. Z. Klin. Med. 1981;36:545–551. doi: 10.1055/s-2006-947258. - DOI
    1. Cornier M.-A., Dabelea D., Hernandez T.L., Lindstrom R.C., Steig A.J., Stob N.R., Van Pelt R.E., Wang H., Eckel R.H. The metabolic syndrome. Endocr. Rev. 2008;29:777–822. doi: 10.1210/er.2008-0024. - DOI - PMC - PubMed
    1. Chopra A.K. Metabolic syndrome or insulin resistance: Evolution, controversies and association with cardiovascular disease risk. Indian J. Clin. Cardiol. 2020;1:77–85. doi: 10.1177/2632463620935030. - DOI
    1. Alemany M. Metabolic syndrome: A multifaceted disease of affluence. J. Endocrinol. Metab. 2012;2:155–165. doi: 10.4021/jem116w. - DOI