. 2024 Feb 15;25(4):2300.
doi: 10.3390/ijms25042300.

Serotonergic and Adrenergic Neuroreceptor Manipulation Ameliorates Core Symptoms of ADHD through Modulating Dopaminergic Receptors in Spontaneously Hypertensive Rats

Affiliations

Serotonergic and Adrenergic Neuroreceptor Manipulation Ameliorates Core Symptoms of ADHD through Modulating Dopaminergic Receptors in Spontaneously Hypertensive Rats

Sampath Madhyastha et al. Int J Mol Sci. .

Abstract

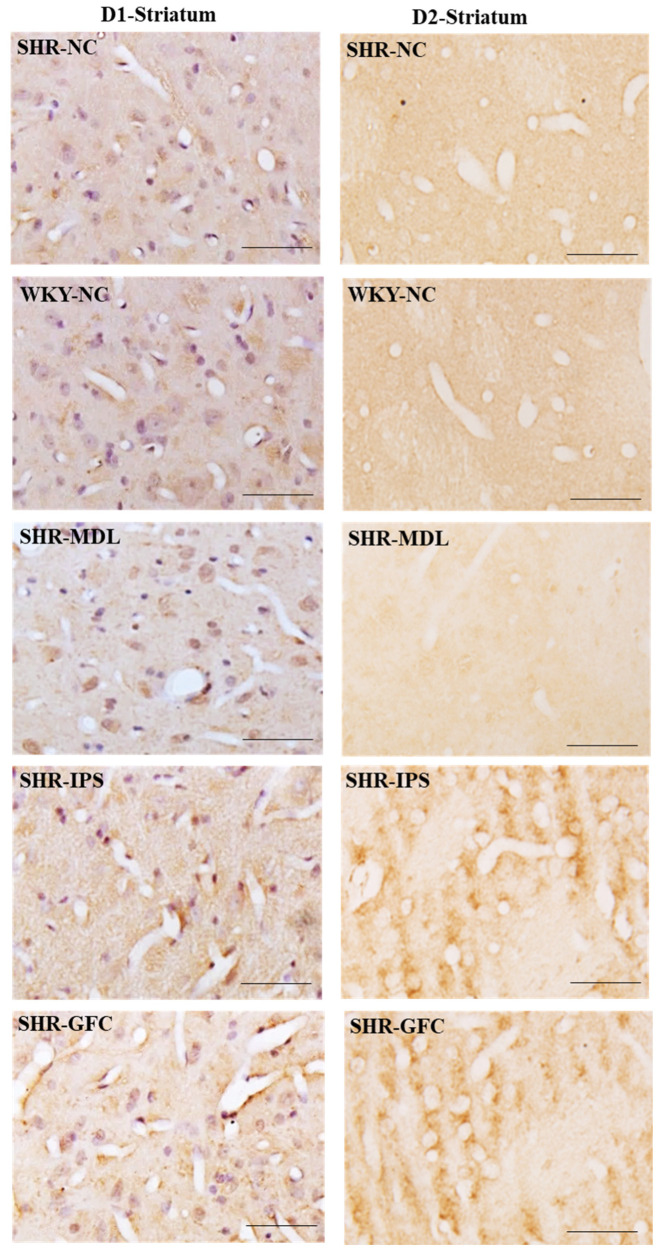
The core symptoms of attention deficit hyperactivity disorder (ADHD) are due to the hypofunction of the brain's adrenergic (NE) and dopamine (DA) systems. Drugs that enhance DA and NE neurotransmission in the brain by blocking their transporters or receptors are the current therapeutic strategies. Of late, the emerging results point out the serotonergic (5-HT) system, which indirectly modulates the DA activity in reducing the core symptoms of ADHD. On this basis, second-generation antipsychotics, which utilize 5-HT receptors, were prescribed to children with ADHD. However, it is not clear how serotonergic receptors modulate the DA activity to minimize the symptoms of ADHD. The present study investigates the efficacy of serotonergic and alpha-2 adrenergic receptor manipulation in tackling the core symptoms of ADHD and how it affects the DA neuroreceptors in the brain regions involved in ADHD. Fifteen-day-old male spontaneously hypertensive rats (SHRs) received 5-HT1A agonist (ipsapirone) or 5-HT2A antagonist (MDL 100907) (i.p.) or alpha-2 agonist (GFC) from postnatal days 15 to 42 along with age-matched Wistar Kyoto rats (WKY) (n = 8 in each group). ADHD-like behaviors were assessed using a battery of behavioral tests during postnatal days 44 to 65. After the behavioral tests, rat brains were processed to estimate the density of 5-HT1A, 5-HT2A, DA-D1, and DA-D2 neuroreceptors in the prefrontal cortex, the striatum, and the substantia nigra. All three neuroreceptor manipulations were able to minimize the core symptoms of ADHD in SHRs. The positive effect was mainly associated with the upregulation of 5-HT2A receptors in all three areas investigated, while 5-HT1A was in the prefrontal cortex and the substantia nigra. Further, the DA-D1 receptor expression was downregulated by all three neuroreceptor manipulations except for alpha-2 adrenergic receptor agonists in the striatum and 5-HT2A antagonists in the substantia nigra. The DA-D2 expression was upregulated in the striatum while downregulated in the prefrontal cortex and the substantia nigra. In this animal model study, the 5-HT1A agonist or 5-HT2A antagonist monotherapies were able to curtail the ADHD symptoms by differential expression of DA receptors in different regions of the brain.

Keywords: 5-HT1A; 5-HT2A; ADHD; DA-D1; DA-D2; alpha-2 adrenergic receptor; attention; impulsivity; prefrontal cortex; striatum and substantia nigra.


Conflict of interest statement

The authors declare no conflicts of interest.

Figures

Figure 1
Figure 1
(A,B): Total distance traveled (A), movement velocity (B) of rats in different groups in open field test. Note significantly increased total distance traveled and movement velocity in SHR-NC compared to WKY-NC rats and they were significantly decreased in SHR-MDL, SHR-IPS, and SHR-GFC groups compared to SHR-NC group. (C,D): Distance traveled (C) and time spent (B) in the peripheral and central zones by rats in different groups in open field test. Note significantly increased distance traveled and time spent in the peripheral zone by SHR-NC compared to WKY-NC rats and they were significantly decreased in SHR-MDL, SHR-IPS, and SHR-GFC groups compared to SHR-NC group. (E): Representative video tracking of rats in different groups in open field test. Note significantly more movements in SHR-NC compared to WKY-NC rats. Movements in central and peripheral zones decreased in SHR-MDL, SHR-IPS, and SHR-GFC groups compared to SHR-NC group. (Red: peripheral zone, yellow: central zone).
Figure 2
Figure 2
(A,B) Distance traveled (A) and movement velocity (B) of rats in different groups in locomotor activity test. Note significantly increased distance traveled and movement velocity of SHR-NC compared to WKY-NC rats, and they were significantly decreased in SHR-MDL, SHR-IPS, and SHR-GFC groups compared to SHR-NC group. (C,D): Movement time and movement numbers (D) of rats in different groups in locomotor activity test. Note significantly increased movement time and movement numbers in SHR-NC compared to WKY-NC rats and they were significantly decreased in SHR-MDL, SHR-IPS, and SHR-GFC groups compared to SHR-NC group. (E): Representative video tracking of rats in different groups in locomotor activity test. Note significantly increased movement in SHR-NC compared to WKY-NC rats and it was significantly decreased in SHR-MDL, SHR-IPS, and SHR-GFC groups compared to SHR-NC group.
Figure 3
Figure 3
(A). % time spent in the open and closed arms of the elevated plus maze apparatus during elevated plus maze test by rats in different groups. Note significantly increased % time spent by SHR-NC in closed arm compared to WKY-NC rats and it was significantly decreased in SHR-MDL, SHR-IPS, and SHR-GFC groups compared to SHR-NC group. (B). Representative video tracking of rats in different groups during elevated plus maze test. Note significantly increased exploration by SHR-NC in closed arm (red) compared to WKY-NC rats and it was significantly decreased in SHR-MDL, SHR-IPS, and SHR-GFC groups compared to SHR-NC group (yellow: open arm).
Figure 4
Figure 4
(A). Mean % choices of large reward arm during learning sessions on days 1, 2, and 3 and (B). mean % choice of large but delayed reward arm during test session by rats in different groups in modified T-maze test for impulsivity. There was a progressive increase in the choice of large, rewarded arm from day 1 to day 3 during learning phase in all groups. Note significantly fewer choices of large but delayed reward arm by SHR-NC rats in test session compared to WKY-NC rats and significantly increased choice of large but delayed reward arm by SHR-MDL, SHR-IPS, and SHR-GFC groups on test day compared to SHR-NC group.
Figure 5
Figure 5
(A). Water area entry frequency during training sessions 1 and 2 and during impulsive drinking test session in impulsivity test in aversive electro foot shock apparatus. During 2nd training sessions, rats in all groups entered the water area in more than 90% of trials. Note significantly higher frequency of entry into water area (and impulsive water drinking) in spite of foot shock for each drinking act by SHR-NC rats in test session compared to WKY-NC rats. However, no such impulsivity was found in SHR-MDL, SHR-IPS, and SHR-GFC groups on test day compared to SHR-NC group. (B). Representative video tracking of rats in different groups in impulsivity test session in aversive electro foot shock apparatus during last training session, and (C). test session. During 2nd training sessions, rats in all groups entered the water area in more than 90% of trials. (Blue: start area, green: choice area, red: water area, yellow: no water area).
Figure 6
Figure 6
(A): Immunoblots of 5-HT2A, 5-HT1A, DA-D1, and DA-D2 receptors in the prefrontal cortical tissues. (BE): Mean gray intensity of 5-HT2A (B) and 5-HT1A (C), DA-D1 (D), and DA-D2 (E) receptor immunobands normalized to actin band gray intensity. # SHR-NC vs. SHR-MDL, p < 0.05; $ SHR-NC vs. SHR-IPS, p < 0.05; £ SHR-NC vs. SHR-GFC, p < 0.05.
Figure 7
Figure 7
Photomicrographs of prefrontal cortical sections immunostained for 5-HT2A (left panel) and 5-HT1A (right panel) receptors. Note the expression pattern of 5-HT2A and 5-HT1A receptors in different groups which agrees with mean gray intensity of immunoblot of Western blot analysis shown in Figure 6B,C. Scale bar = 50 µm.
Figure 8
Figure 8
Photomicrographs of prefrontal cortical sections immunostained for DA-D1 (left panel) and DA-D2 (right panel) receptors. Note the expression pattern DA-D1 and DA-D2 receptors in different groups which agrees with mean gray intensity of immunoblot of Western blot analysis shown in Figure 6C,D. Scale bar = 50 µm.
Figure 9
Figure 9
(A): Immunoblots of 5-HT2A, 5-HT1A, DA-D1, and DA-D2 receptors in the striatal tissues. (BE): Mean gray intensity of 5-HT2A (B) and 5-HT1A (C), DA-D1 (D), and DA-D2 (E) receptor immunobands normalized to actin band gray intensity. # SHR-NC vs. SHR-MDL, p < 0.05; $ SHR-NC vs. SHR-IPS, p < 0.05; £ SHR-NC vs. SHR-GFC, p < 0.05.
Figure 10
Figure 10
Photomicrographs of prefrontal striatal sections immunostained for 5-HT2A (left panel) and 5-HT1A (right panel) receptors. Note the expression pattern 5-HT2A and 5-HT1A receptors in different groups which agrees with mean gray intensity of immunoblot of Western blot analysis shown in Figure 9B,C. Scale bar = 50 µm.
Figure 11
Figure 11
Photomicrographs of striatal sections immunostained for DA-D1 (left panel) and DA-D2 (right panel) receptors. Note the expression pattern DA-D1 and DA-D2 receptors in different groups which agrees with mean gray intensity of immunoblot of Western blot analysis shown in Figure 9C,D. Scale bar = 50 µm.
Figure 12
Figure 12
(A): Immunoblots of 5-HT2A, 5-HT1A, DA-D1, and DA-D2 receptors in the substantia nigra tissues. (BE): Mean gray intensity of 5-HT2A (B) and 5-HT1A (C), DA-D1 (D), and DA-D2 (E) receptor immunobands normalized to actin band gray intensity. # SHR-NC vs. SHR-MDL, p < 0.05; $ SHR-NC vs. SHR-IPS, p < 0.05; £ SHR-NC vs. SHR-GFC, p < 0.05.
Figure 13
Figure 13
Photomicrographs of substantia nigra sections immunostained for 5-HT2A (left panel) and 5-HT1A (right panel) receptors. Note the expression pattern of 5-HT2A and 5-HT1A receptors in different groups which agrees with mean gray intensity of immunoblot of Western blot analysis shown in Figure 12B,C. Scale bar = 50 µm.
Figure 14
Figure 14
Photomicrographs of substantia nigra sections immunostained for DA-D1 (left panel) and DA-D2 (right panel) receptors. Note the expression pattern DA-D1 and DA-D2 receptors in different groups which agrees with mean gray intensity of immunoblot of Western blot analysis shown in Figure 12C,D. Scale bar = 50 µm.

Similar articles

Cited by

  • Maternal vitamin D levels during pregnancy and offspring schizophrenia.
    Sourander A, Upadhyaya S, Surcel HM, Hinkka-Yli-Salomäki S, Cheslack-Postava K, Silwal S, McKeague IW, Brown AS. Sourander A, et al. Schizophr Res. 2024 Aug;270:289-294. doi: 10.1016/j.schres.2024.06.039. Epub 2024 Jun 29. Schizophr Res. 2024. PMID: 38944975 Free PMC article.
  • Serotonin dysfunction in ADHD.
    Jackson EF, Riley TB, Overton PG. Jackson EF, et al. J Neurodev Disord. 2025 Apr 22;17(1):20. doi: 10.1186/s11689-025-09610-y. J Neurodev Disord. 2025. PMID: 40264019 Free PMC article. Review.

References

    1. Visser S., Danielson M., Bitsko R., Holbrook J., Kogan M., Ghandour R., Perou R., Blumberg S. Trends in the parent-report of health care provider-diagnosed and medicated attention-deficit/hyperactivity disorder: United States, 2003–2011. J. Am. Acad Child Adolesc. Psychiatry. 2014;53:34–46. doi: 10.1016/j.jaac.2013.09.001. - DOI - PMC - PubMed
    1. Levy F. Dopamine vs. noradrenaline: Inverted-U effects and ADHD theories. Aust. N. Z. J. Psychiatry. 2009;43:101–108. doi: 10.1080/00048670802607238. - DOI - PubMed
    1. Oades R.D. Dopamine-serotonin interactions in attention-deficit hyperactivity disorder. Prog. Brain Res. 2008;172:543–565. - PubMed
    1. Pattij T., Schoffelmeer A.N. Serotonin and inhibitory response control: Focusing on the role of 5-HT(1A) receptors. Eur. J. Pharmacol. 2015;15:140–145. doi: 10.1016/j.ejphar.2014.05.064. - DOI - PubMed
    1. National Institute for Health and Care Excellence NICE Guideline (2020)—Attention Deficit Hyperactivity Disorder: Diagnosis and Management. [(accessed on 1 December 2022)]. Available online: https://www.nice.org.uk/guidance/ng87/resources/attention-deficit-hypera.... - PubMed