. 2024 Feb 15;25(4):2319.
doi: 10.3390/ijms25042319.

CSDE1 Intracellular Distribution as a Biomarker of Melanoma Prognosis

Affiliations

CSDE1 Intracellular Distribution as a Biomarker of Melanoma Prognosis

Alberto Indacochea et al. Int J Mol Sci. .

Abstract

RNA-binding proteins are emerging as critical modulators of oncogenic cell transformation, malignancy and therapy resistance. We have previously found that the RNA-binding protein Cold Shock Domain containing protein E1 (CSDE1) promotes invasion and metastasis of melanoma, the deadliest form of skin cancer and also a highly heterogeneous disease in need of predictive biomarkers and druggable targets. Here, we design a monoclonal antibody useful for IHC in the clinical setting and use it to evaluate the prognosis potential of CSDE1 in an exploratory cohort of 149 whole tissue sections including benign nevi and primary tumors and metastasis from melanoma patients. Contrary to expectations for an oncoprotein, we observed a global decrease in CSDE1 levels with increasing malignancy. However, the CSDE1 cytoplasmic/nuclear ratio exhibited a positive correlation with adverse clinical features of primary tumors and emerged as a robust indicator of progression free survival in cutaneous melanoma, highlighting the potential of CSDE1 as a biomarker of prognosis. Our findings provide a novel feature for prognosis assessment and highlight the intricacies of RNA-binding protein dynamics in cancer progression.

Keywords: CSDE1; RNA-binding protein; biomarker; cytoplasmic–nuclear ratio; melanoma; prognosis.


Conflict of interest statement

The authors declare no conflicts of interest.

Figures

Figure 1
Figure 1
Characterization of the G10 monoclonal antibody. (A) Comparison of the G10 (left panel) and ab96124 (right panel) reactivities in melanoma SK-Mel-147 cells depleted (siCSDE1) or not (siCtrl) of CSDE1. Actin is shown as loading control. Full blots of actin are shown in Figure S1A. (B) Immunohistochemistry of a nodular melanoma. Staining with secondary antibody alone is shown as control. Magnification is indicated on the lower left corner.
Figure 2
Figure 2
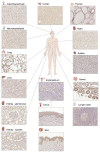
CSDE1 expression in healthy human tissues. IHC with the G10 monoclonal antibody is shown.
Figure 3
Figure 3
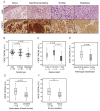
Reduced CSDE1 levels correlate with adverse clinical features. (A) Representative IHC images of nevi, primary and metastatic tumors. Hematoxylin and Eosin (H&E) staining is shown at the top and anti-CSDE1 staining at the bottom. Scale bar, 20 µm. (B) Global CSDE1 protein levels decrease with malignancy. Each dot represents the mean intensity of up to five fields within the same sample. (CF) Correlation of CSDE1 levels in primary tumors with the indicated clinical features. Note that the Y-axis has been cut to emphasize differences (dashed line). Statistical significance was evaluated using one-way ANOVA with Bonferroni correction (B,C) or independent t-test (DF).
Figure 4
Figure 4
CSDE1 cytoplasmic/nuclear ratio is a marker of prognosis. (A) Representative images of nevi, primary and metastatic tumors, with augmented insets (dotted squares) to visualize intracellular distribution of CSDE1. Scale bar, 20 µm. (B) H-score quantification of CSDE1 levels in the nucleus and cytoplasm of cells in nevi, primary tumors and metastasis. (CF) Cytoplasmic/nuclear CSDE1 ratios and correlation with the indicated clinical features of primary tumors. Log10 and *100 calculations have been applied to de-compact and better visualize the data on the graphical representations. (G) Kaplan–Meier curve of progression free survival of patients with primary cutaneous melanoma. Metastatic samples naïve for treatment with PFS data were included in the analysis (cut point = 1.93; n = 23; C/N low arm, n = 8; C/N high arm, n = 15). Statistical differences were evaluated using Kruskal–Wallis with Bonferroni correction (B,C), Mann–Whitney U (DF) and Log Rank (G).

References

    1. Schadendorf D., van Akkooi A.C.J., Berking C., Griewank K.G., Gutzmer R., Hauschild A., Stang A., Roesch A., Ugurel S. Melanoma. Lancet. 2018;392:971. doi: 10.1016/S0140-6736(18)31559-9. - DOI - PubMed
    1. Swe T., Kim K.B. Update on systemic therapy for advanced cutaneous melanoma and recent development of novel drugs. Clin. Exp. Metastasis. 2018;35:503–520. doi: 10.1007/s10585-018-9913-y. - DOI - PubMed
    1. Olbryt M., Rajczykowski M., Widłak W. Biological Factors behind Melanoma Response to Immune Checkpoint Inhibitors. Int. J. Mol. Sci. 2020;21:4071. doi: 10.3390/ijms21114071. - DOI - PMC - PubMed
    1. Ng M.F., Simmons J.L., Boyle G.M. Heterogeneity in Melanoma. Cancers. 2022;14:3030. doi: 10.3390/cancers14123030. - DOI - PMC - PubMed
    1. Eisenstein A., Gonzalez E.C., Raghunathan R., Xu X., Wu M., McLean E.O., McGee J., Ryu B., Alani R.M. Emerging Bi-omarkers in Cutaneous Melanoma. Mol. Diagn. Ther. 2018;22:203–218. doi: 10.1007/s40291-018-0318-z. - DOI - PubMed