Transcriptome Analysis Reveals the Molecular Mechanisms Underlying Growth Superiority in a Novel Gymnocypris Hybrid, Gymnocypris przewalskii ♀ × Gymnocypris eckloni ♂
- PMID: 38397172
- PMCID: PMC10888472
- DOI: 10.3390/genes15020182
Transcriptome Analysis Reveals the Molecular Mechanisms Underlying Growth Superiority in a Novel Gymnocypris Hybrid, Gymnocypris przewalskii ♀ × Gymnocypris eckloni ♂
Abstract
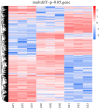
Artificial hybrid breeding can optimize parental traits to cultivate excellent hybrids with enhanced economic value. In this study, we investigated the growth performance and transcriptomes of Gymnocypris przewalskii (♀) and Gymnocypris eckloni (♂) and their F1 hybrid fishes. Hatched individuals of G. przewalskii (GP) and G. eckloni (GE) of the same size and their F1 hybrids (GH) were separately cultured for eight months in three cement tanks (n = 3). The growth indexes were measured, which showed that the growth rate of the groups was GE > GH > GP, while the survival rate was GH > GE > GP. The RNA-Seq data analysis of the muscles from the three Gymnocypris fish strains revealed that gene transcription has a significant impact on F1 hybrid fish and its parents. The differentially expressed genes (DEGs) in GH show less differences with GP, but more with GE. qRT-PCR was used to confirm the expression profiles of the chosen DEGs, and the results showed positive correlations with the RNA-seq data. KEGG enrichment results indicated that the DEGs were related to a variety of molecular functions, such as glycolysis/gluconeogenesis, arachidonic acid formation, citrate cycle, and the MAPK, PI3K-Akt, or mTOR signal pathways. Subsequent analysis indicated that there may be a significant correlation between the differential expression of IGF2 and a difference in the growth of GE and GP.
Keywords: Gymnocypris przewalskii; Gymnocypris eckloni; growth performance; hybrid F1; transcriptome.
Conflict of interest statement
The authors declare no conflict of interest.
Figures


Comment on
-
Transcriptome analysis reveals the molecular mechanisms underlying growth superiority in a novel grouper hybrid (Epinephelus fuscogutatus♀ × E. lanceolatus♂).BMC Genet. 2016 Jan 19;17:24. doi: 10.1186/s12863-016-0328-y. BMC Genet. 2016. PMID: 26785614 Free PMC article.
Similar articles
-
Transcriptomic profiling reveals molecular regulation of seasonal reproduction in Tibetan highland fish, Gymnocypris przewalskii.BMC Genomics. 2019 Jan 3;20(1):2. doi: 10.1186/s12864-018-5358-6. BMC Genomics. 2019. PMID: 30606119 Free PMC article.
-
Comparative transcriptome analysis of scaled and scaleless skins in Gymnocypris eckloni provides insights into the molecular mechanism of scale degeneration.BMC Genomics. 2020 Nov 27;21(1):835. doi: 10.1186/s12864-020-07247-w. BMC Genomics. 2020. PMID: 33246415 Free PMC article.
-
Transcriptomic and proteomic strategies to reveal the mechanism of Gymnocypris przewalskii scale development.BMC Genomics. 2024 Feb 3;25(1):140. doi: 10.1186/s12864-024-10047-1. BMC Genomics. 2024. PMID: 38310220 Free PMC article.
-
Transcriptomic profiling of Tibetan highland fish (Gymnocypris przewalskii) in response to the infection of parasite ciliate Ichthyophthirius multifiliis.Fish Shellfish Immunol. 2017 Nov;70:524-535. doi: 10.1016/j.fsi.2017.09.003. Epub 2017 Sep 4. Fish Shellfish Immunol. 2017. PMID: 28882799
-
Comparative transcriptome analysis provides molecular insights into heterosis of waterlogging tolerance in Chrysanthemum indicum.BMC Plant Biol. 2024 Apr 10;24(1):259. doi: 10.1186/s12870-024-04954-4. BMC Plant Biol. 2024. PMID: 38594635 Free PMC article. Review.
References
-
- Chandhini S., Rejish K.V.J. Transcriptomics in aquaculture: Current status and applications. Rev. Aquac. 2019;11:1379–1397. doi: 10.1111/raq.12298. - DOI
-
- Waiho K., Ikhwanuddin M., Afiqah-Aleng N., Shu-Chien A.C., Wang Y.J., Ma H.Y., Fazhan H. Transcriptomics in advancing portunid aquaculture: A systematic review. Rev. Aquac. 2022;14:2064–2088. doi: 10.1111/raq.12689. - DOI
-
- Sun Y., Guo C.Y., Wang D.D., Li X.F., Shi Q., Hu G.J., Fang C., Lin H.R., Zhang Y. Transcriptome analysis reveals the molecular mechanisms underlying growth superiority in a novel grouper hybrid (Epinephelus fuscogutatus ♀ × Epinephelus lanceolatus ♂) BMC Genet. 2016;17:24. doi: 10.1186/s12863-016-0328-y. - DOI - PMC - PubMed
-
- Gomes F., Watanabe L., Vianez J., Nunes M., Cardoso J., Lima C., Schneider H., Sampaio I. Comparative analysis of the transcriptome of the Amazonian fish species Colossoma macropomum (tambaqui) and hybrid tambacu by next generation sequencing. PLoS ONE. 2019;14:e0212755. doi: 10.1371/journal.pone.0212755. - DOI - PMC - PubMed
Publication types
MeSH terms
Substances
Grants and funding
LinkOut - more resources
Full Text Sources
Miscellaneous

