. 2024 Jan 30;15(2):191.
doi: 10.3390/genes15020191.

Exploring the Micro-Mosaic Landscape of FGFR3 Mutations in the Ageing Male Germline and Their Potential Implications in Meiotic Differentiation

Affiliations

Exploring the Micro-Mosaic Landscape of FGFR3 Mutations in the Ageing Male Germline and Their Potential Implications in Meiotic Differentiation

Yasmin Striedner et al. Genes (Basel). .

Abstract

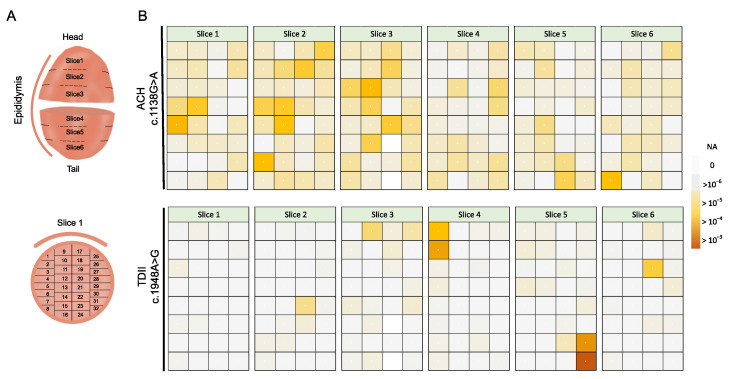
Advanced paternal age increases the risk of transmitting de novo germline mutations, particularly missense mutations activating the receptor tyrosine kinase (RTK) signalling pathway, as exemplified by the FGFR3 mutation, which is linked to achondroplasia (ACH). This risk is attributed to the expansion of spermatogonial stem cells carrying the mutation, forming sub-clonal clusters in the ageing testis, thereby increasing the frequency of mutant sperm and the number of affected offspring from older fathers. While prior studies proposed a correlation between sub-clonal cluster expansion in the testis and elevated mutant sperm production in older donors, limited data exist on the universality of this phenomenon. Our study addresses this gap by examining the testis-expansion patterns, as well as the increases in mutations in sperm for two FGFR3 variants-c.1138G>A (p.G380R) and c.1948A>G (p.K650E)-which are associated with ACH or thanatophoric dysplasia (TDII), respectively. Unlike the ACH mutation, which showed sub-clonal expansion events in an aged testis and a significant increase in mutant sperm with the donor's age, as also reported in other studies, the TDII mutation showed focal mutation pockets in the testis but exhibited reduced transmission into sperm and no significant age-related increase. The mechanism behind this divergence remains unclear, suggesting potential pleiotropic effects of aberrant RTK signalling in the male germline, possibly hindering differentiation requiring meiosis. This study provides further insights into the transmission risks of micro-mosaics associated with advanced paternal age in the male germline.

Keywords: FGFR3; achondroplasia; congenital disorders; driver mutations; germline mutagenesis; receptor tyrosine kinase; thanatophoric dysplasia.


Conflict of interest statement

The authors declare no competing interests.

Figures

Figure 1
Figure 1
Variants and associated information. (A) Phenotype data, mainly retrieved from ClinVar. The effect on signalling was as reported by VarMap [50]. Predicted pathogenicity scores like the CADD (Combined Annotation Dependent Depletion) score [51] and REVEL score [52] (ranging from 0 to 1, with 1 being the most pathogenic) are according to GRCh38-v1.6 and represent the level of deleteriousness. The fold increase in the signalling of the mutant compared to the wild-type protein on the cell surface was determined without and with the addition of ligand (value in parenthesis) reported in [29]. COSMIC (Catalogue of Somatic Mutations in Cancer) data were based on version 94 [53]. All are is according to transcript ENST00000440486, FGFR3 isoform IIIc. ACH: achondroplasia; TDII: thanatophoric dysplasia II; CS: craniosynostosis; TM: transmembrane domain. TK: tyrosine Kinase domain; fgf1: fibroblast growth factor I; SS: spermatocytic seminoma; MM: multiple myeloma; C: carcinoma; EN: epidermal nevus. The color of the asterisks matches the respective mutation in panel B. (B) Schematic illustration of functional domains in FGFR3. The position of the amino acid substitution associated with ACH (orange) or TDII (blue) is indicated in the respective domains.
Figure 2
Figure 2
Schematics of the bead-emulsion amplification (BEA) process. In Step 1, regions including sites c.1138 and c.1948 undergo multiplex PCR from testis or sperm genomic DNA. In step 2, single amplicons are hybridized with microscopic beads covered with a dual-biotinylated primer complementary to the amplicons (overhang tail). PCR products are produced on the bead within an emulsion droplet. In step 3, the beads are washed and labelled using allele-specific extensions of fluorescent probes specific for the locus and the mutant or the wild-type (WT) site. The wild-type and mutant for c.1138 and c.1948 can be distinguished during the scanning using four different specific probes, each labelled with a different Alexa dye [33]. Only two colours are shown, as exemplified in green and red. In step 4, un-extended probes are washed off, and the fluorescent beads are arrayed on a slide. The array is scanned with an inverted fluorescence microscope (Zeiss Axio Observer.Z1, Munich, Germany) with a 20× objective followed by a subsequent washing, probing, and imaging cycle to confirm the mutants with a dye switch. A series of imaging and data analysis steps are performed to assess the mutation frequency in ~105 molecules, as elaborated in [32]. Note that both sites were screened in the same experiment, but mutant and wild-type counts are measured independently for each site using the different probes. Details on the protocol steps are published in [31].
Figure 3
Figure 3
Validation of estimated ACH (c.1138G>A) and TDII (c.1948A>G) mutation frequencies measured with BEA. Different ratios of mutant to WT were reconstructed by mixing distinct amounts of genomic DNA from either an ACH or a TDII carrier DNA with WT genomic DNA. Data points represent individual and median measurements (small and larger circles, respectively). The measured ratios match the known input ratios ranging from 1 mutant to 100, 1000, and 10,000 WT with Pearson’s correlation coefficient (r), r = 0.99 and 0.98 for c.1138 and c.11948, respectively. Negative controls (triangles) are 300,000 copies of WT plasmid mixed with E. coli as carrier DNA. Note that the negative controls with an observed VAF of 0 are displayed with a slight vertical offset to prevent overlapping data points. Data for positive and negative controls can be found in Supplementary Table S1. Data on the ACH are published in [19] and are shown here only for comparative purposes.
Figure 4
Figure 4
Spatial analysis of sub-clonal expansions in a human testis. (A) Strategy for a testis-cutting scheme as described previously [20,21,24,25]. In brief, the testis was dissected into six slices, and each slice was dissected into 32 individual pieces (total n = 192 pieces). The thin, curved line next to the testis denotes the position of the epididymis for orientation purposes. (B) Spatial distribution of the two variants across each testis piece. The colour-coded scheme refers to the variant allele frequency (VAF) of each piece in a range of >10−3 to 0. NA: Not available. The data can be found in Supplementary Table S2.
Figure 5
Figure 5
Variant allele frequencies (VAF) of the ACH and TDII mutation measured in sperm DNA. (A) Correlation between VAF and the donor’s age (23 to 59 years old). The coloured areas represent the confidence bands, and the black line shows the linear regression. Spearman’s correlation test (ρ) was used to assess a positive correlation between mutation frequency and donor’s age. The data can be found in Supplementary Table S3. Sperm data for ACH were taken from [19]. (B) Comparison of differences in the accumulation of mutations in sperm between ACH and TDII with the p-value estimated using the Mann–Whitney-U test (p-value < 10−10, Z-score = 6.8). IQR: Interquartile range. (C) Percentage of sperm samples without or with mutations for the two variants. The number of total donors screened for each locus was n = 56 and 55, respectively. Percentages are rounded with no decimal numbers.

Similar articles

Cited by

References

    1. Jamal-Hanjani M., Wilson G.A., McGranahan N., Birkbak N.J., Watkins T.B.K., Veeriah S., Shafi S., Johnson D.H., Mitter R., Rosenthal R., et al. Tracking the Evolution of Non-Small-Cell Lung Cancer. N. Engl. J. Med. 2017;376:2109–2121. doi: 10.1056/NEJMoa1616288. - DOI - PubMed
    1. Turajlic S., Xu H., Litchfield K., Rowan A., Horswell S., Chambers T., O’Brien T., Lopez J.I., Watkins T.B.K., Nicol D., et al. Deterministic Evolutionary Trajectories Influence Primary Tumor Growth: TRACERx Renal. Cell. 2018;173:595–610.e511. doi: 10.1016/j.cell.2018.03.043. - DOI - PMC - PubMed
    1. Yates L.R., Gerstung M., Knappskog S., Desmedt C., Gundem G., Van Loo P., Aas T., Alexandrov L.B., Larsimont D., Davies H., et al. Subclonal diversification of primary breast cancer revealed by multiregion sequencing. Nat. Med. 2015;21:751–759. doi: 10.1038/nm.3886. - DOI - PMC - PubMed
    1. Tomasetti C., Vogelstein B. Cancer etiology. Variation in cancer risk among tissues can be explained by the number of stem cell divisions. Science. 2015;347:78–81. doi: 10.1126/science.1260825. - DOI - PMC - PubMed
    1. Wood K.A., Goriely A. The impact of paternal age on new mutations and disease in the next generation. Fertil. Steril. 2022;118:1001–1012. doi: 10.1016/j.fertnstert.2022.10.017. - DOI - PubMed

Publication types

Substances

LinkOut - more resources