. 2024 Feb 2;15(2):201.
doi: 10.3390/genes15020201.

Genome-Wide Classification of Myb Domain-Containing Protein Families in Entamoeba invadens

Affiliations

Genome-Wide Classification of Myb Domain-Containing Protein Families in Entamoeba invadens

Patricia Cuellar et al. Genes (Basel). .

Abstract

Entamoeba histolytica, the causative agent of amebiasis, is the third leading cause of death among parasitic diseases globally. Its life cycle includes encystation, which has been mostly studied in Entamoeba invadens, responsible for reptilian amebiasis. However, the molecular mechanisms underlying this process are not fully understood. Therefore, we focused on the identification and characterization of Myb proteins, which regulate the expression of encystation-related genes in various protozoan parasites. Through bioinformatic analysis, we identified 48 genes in E. invadens encoding MYB-domain-containing proteins. These were classified into single-repeat 1R (20), 2R-MYB proteins (27), and one 4R-MYB protein. The in-silico analysis suggests that these proteins are multifunctional, participating in transcriptional regulation, chromatin remodeling, telomere maintenance, and splicing. Transcriptomic data analysis revealed expression signatures of eimyb genes, suggesting a potential orchestration in the regulation of early and late encystation-excystation genes. Furthermore, we identified probable target genes associated with reproduction, the meiotic cell cycle, ubiquitin-dependent protein catabolism, and endosomal transport. In conclusion, our findings suggest that E. invadens Myb proteins regulate stage-specific proteins and a wide array of cellular processes. This study provides a foundation for further exploration of the molecular mechanisms governing encystation and unveils potential targets for therapeutic intervention in amebiasis.

Keywords: MYB-DBD-containing proteins; Myb recognition element; encystation–excystation; protozoan; transcriptional regulation.


Conflict of interest statement

The authors declare no conflicts of interest.

Figures

Figure 1
Figure 1
1R-MYB proteins of E. invadens. (A) ClustalW alignment of the MYB-DBD region. Arrowheads indicate conserved tryptophan residues. The acidic patch is underlined. Groups are indicated on the right. Numbers indicate the MYB-DBD position of each protein shown in the alignment. (B) Phylogenetic tree of the 1R-MYB proteins obtained in FastTree. The numerical values in the figure represent the reliability of the clades. The closer the value of the clade is to 1.0, the higher the confidence. Highlighted colors represent proteins belonging to the same ortholog group. EiTRF-like I (EIN_023650), EiTRF-like II (EIN_079420), EiMybS1 (EIN_086260), EiMybS2 (EIN_087120), EiMybS3 (EIN_031252), EiMybS4 (EIN_095950), EiMybS5 (EIN_224050), EiMybS6 (EIN_020720), EiMybS7 (EIN_469690), EiMybS8 (EIN_081930), EiMybS9 (EIN_407300), EiAda2-like 1 (EIN_359680), EiAda2-like 2 (EIN_390470), EiMyb-related 1 (EIN_020090), EiZuotin-like (EIN_182440), EiBdp1-like 1 (EIN_223710), EiBdp1-like 2 (EIN_034860), EiBdp1-like 3 (EIN_314460), EiBdp1-like 4 (EIN_096130), and EiBdp1-like 5 (EIN_059360). (C) Schematic representation of 1R-EiMyb proteins according to their size and domains. Blue, MYB-DBD; green, ADA2-lize ZZ; pink, DNAJ; purple, TRF 1 domain; and yellow, TFIIIB B”. c-Myb and EhMyb10 are used as reference.
Figure 2
Figure 2
Sequence logos of the E. invadens Myb proteins. Multiple alignments of MYB domains were performed with ClustalW software 2.1 and visualized with WebLogo 3. (A) Logo of the MYB domain of EiTRF-like, EiCCA1-like, EiAda2-like, EiBdp1-like, Zuotin-like, R2 Myb repeat, and R3 Myb repeat. The Y-axis score indicates the probability for each position in the sequence. Black lines illustrate the position of the three α-helices in MYB-DBD. Blue: conserved hydrophobic residues; yellow: acidic patch; purple: amino-linker; green: telebox; red: SHAQKYF; and magenta: conserved cysteine of the KQCRER motif. (B) Molecular structures of the MYB domain of 1R and 2R-MYB proteins obtained by AlphaFold and visualized with PyMOL.
Figure 3
Figure 3
2R-MYB proteins of E. invadens. (A) ClustalW alignment of the MYB-DBD region. Arrowheads indicate conserved tryptophans. Numbers indicate the MYB-DBD position of each protein shown in the alignment. The acidic patch is underlined, and R2 and R3 repeats are indicated as dotted lines. The black circle indicates the conserved cysteine residue in the R2 repeat. (B) Phylogenetic tree of the 1R-MYB proteins obtained in FastTree. The numerical values in the figure represent the reliability of the clades. The closer the value of the clade is to 1.0, the higher the confidence. Highlighted colors represent proteins belonging to the same ortholog group. EiMyb1 (EIN_284910), EiMyb2 (EIN_178740), EiMyb3 (EIN_047330), EiMyb4 (EIN_206260), EiMyb5 (EIN_169560), EiMyb6 (EIN_168610), EiMyb7 (EIN_207200), EiMyb8 (EIN_022390), EiMyb9 (EIN_080130), EiMyb10 (EIN_276810), EiMyb11 (EIN_307410), EiMyb12 (EIN_308550), EiMyb13 (EIN_308550), EiMyb14 (EIN_095310), EiMyb15 (EIN_399710), EiMyb16 (EIN_490880), EiMyb17 (EIN_310240), EiMyb18 (EIN_425382), EiMyb19 (EIN_046410), EiMyb20 (EIN_183110), EiMyb21 (EIN_183730), EiMyb22 (EIN_169190), EiMyb23 (EIN_359630), EiMyb24 (EIN_379820), EiMyb25 (EIN_168860), EiMyb26 (EIN_405040), and EiCdc5-like (EIN_248780). (C) Schematic representation of Myb proteins according to their size and domains. Blue, MYB-DBD. c-Myb and EhMyb10 are used as references.
Figure 4
Figure 4
4R-MYB protein of E. invadens. (A) ClustalW alignment of the amino-terminal region of EiSnap-like and SNAPc orthologs from A. thaliana, H. sapiens, and Mus musculus. Arrowheads indicate the conserved tryptophans, and the dotted line indicates the four adjacent MYB repeats, Ra, Rb, Rc, and Rd (red, green, brown, and yellow dotted boxes), with an additional half MYB repeat (Rh) in front of Ra (blue dotted box). (B) Sequence logos generated from the multiple sequence alignment of the analyzed ortholog 4R-MYB proteins. (C) Schematic diagram of EiSnap-like visualized with Dog 2.0 (D) Three-dimensional structure of EiSnap-like protein performed in AlphaFold and visualized with PyMOL.
Figure 5
Figure 5
Expression profile of E. invadens Myb genes during encystation and excystation. (A) Boxplot showing the number of eimyb genes expressed in each condition analyzed during trophozoite–cyst differentiation. The middle lines in the boxplot represent the median, and circles represent outliers. (B) Hierarchical clustering heatmap of eimyb genes; each column represents a gene and each row represents a condition. The colors in the graph represent the sample’s level of gene expression [Log2 (TPM)]. Blue signifies that the gene expression is low in the sample, whereas red shows that the gene is strongly expressed. Data were obtained from AmoebaDB.
Figure 6
Figure 6
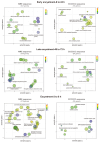
GO annotations of upregulated genes during cyst differentiation in E. invadens. Biological process annotations associated with genes containing the MRE and the C-element in their promoters are visualized using a two-dimensional semantic space scatterplot. The spatial organization is based on semantic similarity. The number of node labels is minimized to allow visualization of the node colors on the scatterplot. The score equals the p-value for each GO annotation term node. Blue nodes indicate more significant p-values and red nodes indicate less significant p-values.
Figure 7
Figure 7
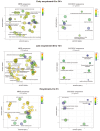
GO annotations of downregulated genes during cyst differentiation in E. invadens. Biological process annotations associated with genes containing the MRE and the C-element in their promoters are visualized using a two-dimensional semantic space scatterplot. The spatial organization is based on semantic similarity. The number of node labels is minimized to allow visualization of the node colors on the scatterplot. The score equals the p-value for each GO annotation term node. Blue nodes indicate more significant p-values and red nodes indicate less significant p-values.

Similar articles

References

    1. Shirley D.-A.T., Farr L., Watanabe K., Moonah S. A Review of the Global Burden, New Diagnostics, and Current Therapeutics for Amebiasis. Open Forum Infect. Dis. 2018;5:ofy161. doi: 10.1093/ofid/ofy161. - DOI - PMC - PubMed
    1. Haque R., Huston C.D., Hughes M., Houpt E., Petri W.A. Amebiasis. N. Engl. J. Med. 2003;348:1565–1573. doi: 10.1056/NEJMra022710. - DOI - PubMed
    1. Eichinger D. Encystation in Parasitic Protozoa. Curr. Opin. Microbiol. 2001;4:421–426. doi: 10.1016/S1369-5274(00)00229-0. - DOI - PubMed
    1. Eichinger D. Encystation of Entamoeba Parasites. BioEssays. 1997;19:633–639. doi: 10.1002/bies.950190714. - DOI - PubMed
    1. Wesel J., Shuman J., Bastuzel I., Dickerson J., Ingram-Smith C. Encystation of Entamoeba Histolytica in Axenic Culture. Microorganisms. 2021;9:873. doi: 10.3390/microorganisms9040873. - DOI - PMC - PubMed

Publication types

LinkOut - more resources