. 2024 Feb 4;14(2):189.
doi: 10.3390/biom14020189.

Alzheimer's Amyloid-β Accelerates Cell Senescence and Suppresses SIRT1 in Human Neural Stem Cells

Affiliations

Alzheimer's Amyloid-β Accelerates Cell Senescence and Suppresses SIRT1 in Human Neural Stem Cells

Rongyao Li et al. Biomolecules. .

Abstract

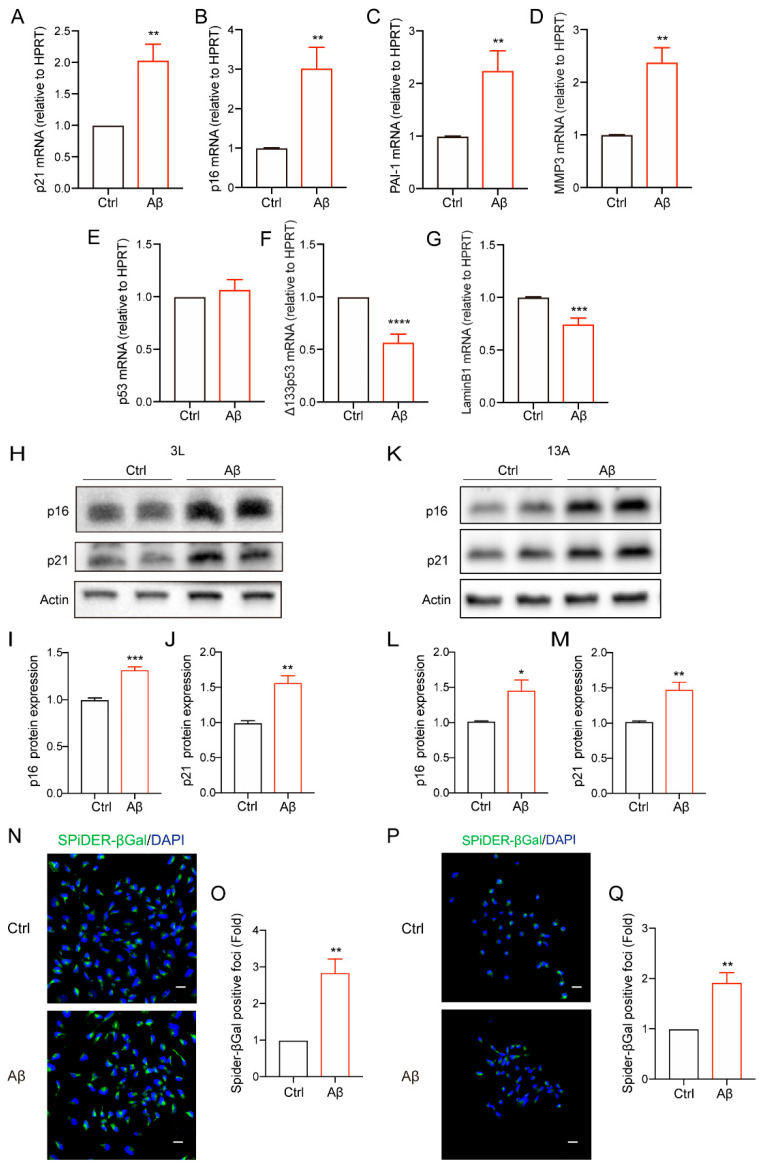
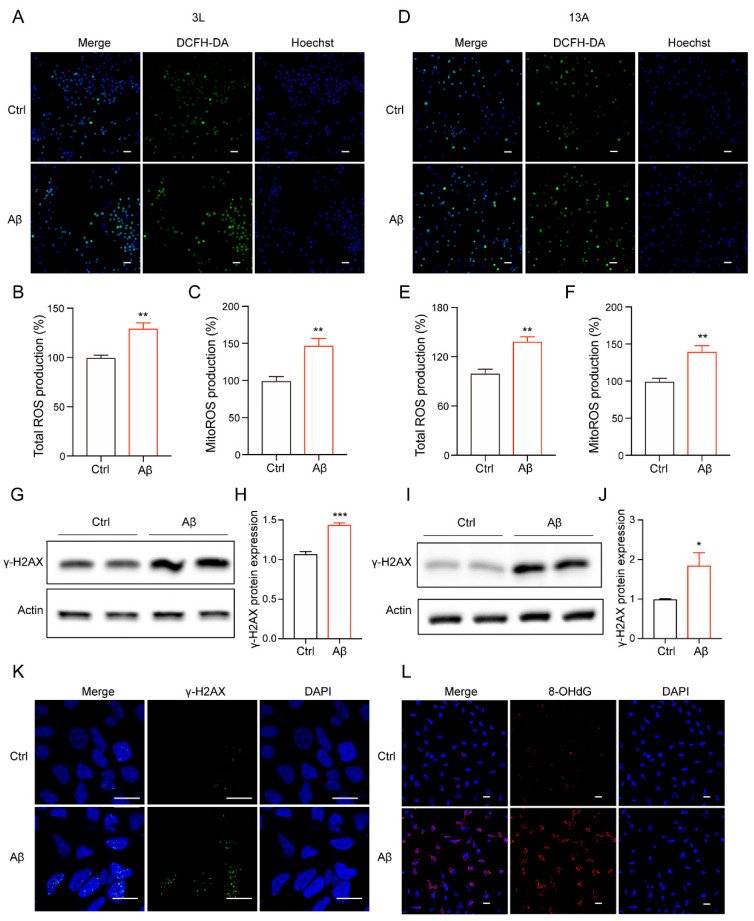
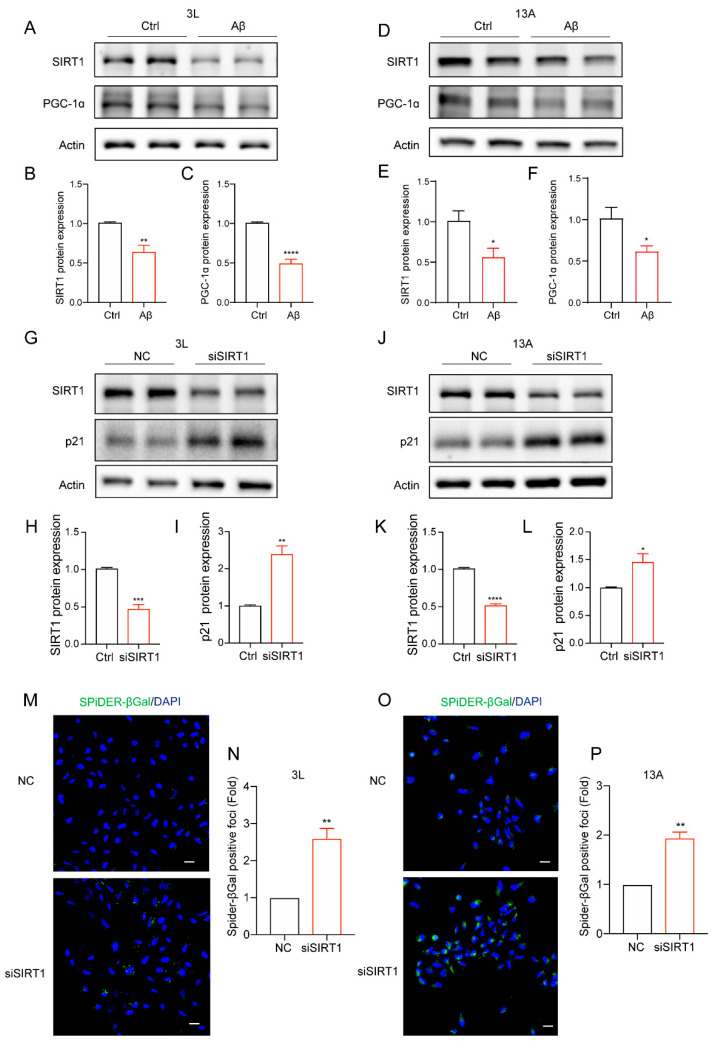
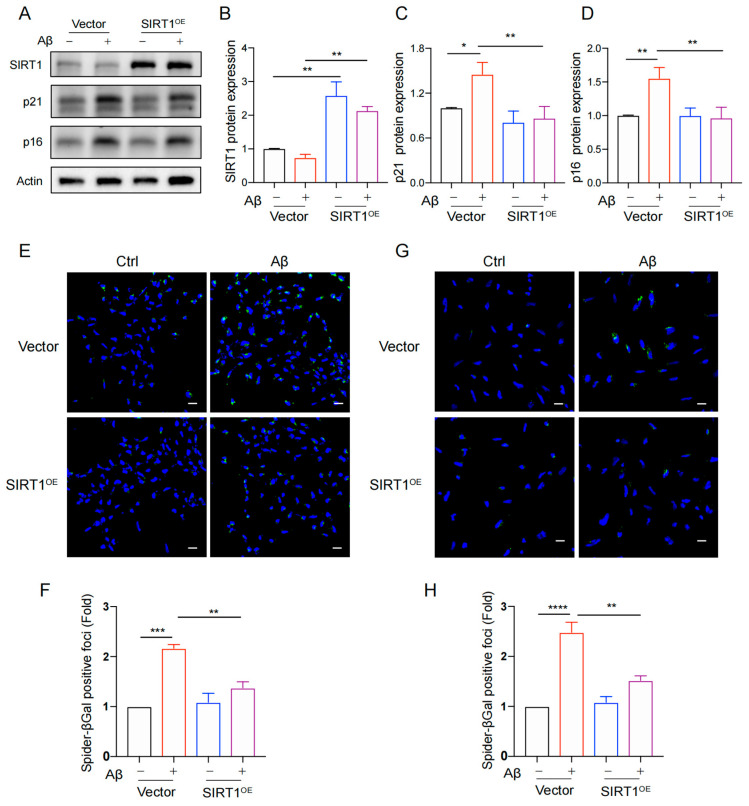
As a lifelong source of neurons, neural stem cells (NSCs) serve multiple crucial functions in the brain. The senescence of NSCs may be associated with the onset and progression of Alzheimer's disease (AD). Our study reveals a noteworthy finding, indicating that the AD-associated pathogenic protein amyloid-β (Aβ) substantially enhances senescence-related characteristics of human NSCs. These characteristics encompass the enhanced expression of p16 and p21, the upregulation of genes associated with the senescence-associated secretory phenotype (SASP), increased SA-β-gal activity, and the activation of the DNA damage response. Further studies revealed that Aβ treatment significantly downregulates the SIRT1 protein which plays a crucial role in regulating the aging process and decreases downstream PGC-1α and FOXO3. Subsequently, we found that SIRT1 overexpression significantly alleviates a range of Aβ-induced senescent markers in human NSCs. Taken together, our results uncover that Aβ accelerates cellular senescence in human NSCs, making SIRT1 a highly promising therapeutic target for senescent NSCs which may contribute to age-related neurodegenerative diseases, including AD.

Keywords: Aβ; ROS; SIRT1; cell senescence; neural stem cells.


Conflict of interest statement

The authors declare no competing financial interest.

Figures

Figure 1
Figure 1
Amyloid-β upregulated senescent markers in human NSCs. (AG) p21 (A), p16 (B), PAI-1 (C), MMP3 (D), p53 (E), Δ133p53 (F) and LaminB1 (G) mRNA levels were analyzed at 72 h after Aβ (5 µM) treatment. (H) Cells were treated with Aβ (5 µM) for 72 h in 3L NSC, and the levels of p16 and p21 were analyzed using Western blotting. (I,J) Quantification of relative p16 (I), p21 (J) protein levels in (H). (K) Cells were incubated with Aβ (5 µM) for 72 h in 13A NSC, and the levels of p16 and p21 were analyzed using Western blotting. (L,M) Quantification of relative p16 (L), p21 (M) protein levels in (K). (N) The representative images of SA-β-gal staining in 3L NSC treated with or without Aβ (5 μM) for 72 h. n = 3, scale bar, 20 μm. (O) Quantitation of (N). (P) The representative images of SA-β-gal staining in 13A NSC treated with or without Aβ (5 μM) for 72 h. n = 3, scale bar, 20 μm. (Q) Quantitation of (P). The data were presented as mean ± SEM, n ≥ 3 independent experiments, * p < 0.05, ** p < 0.01, *** p < 0.001, and **** p < 0.0001, analyzed using unpaired Student’s t-test (two-tailed). (Original western blot images can be found in Supplementary Materials Excel File S1).
Figure 2
Figure 2
Amyloid-β promoted ROS production and senescence-associated DNA damage. (A) The representative images of 3L NSC treated with Aβ (5 μM) for 48 h, then co-stained with DCFH-DA and Hoechst. The pictures were obtained via Operetta. Scale bars, 50 μm. (B) The quantification of (A), showing relative ROS generation of cells treated with Aβ (5 μM) for 48 h. (C) Mitochondrial ROS production in the cells treated with Aβ (5 μM) for 48 h. The signal of MitoSOX was normalized to Hoechst. (D) The representative images of 13A NSC treated with Aβ (5 μM) for 48 h, then co-stained with DCFH-DA and Hoechst. The pictures were obtained via Operetta. Scale bars, 50 μm. (E) The quantification of (A), showing relative ROS generation of cells treated with Aβ (5 μM) for 48 h. (F) Mitochondrial ROS production in the cells treated with Aβ (5 μM) for 48 h. The signal of MitoSOX was normalized to Hoechst. (G) Western blot analysis was performed to detect γ-H2AX. 3L NSC were treated with Aβ (5 μM) for 72 h. (H) The quantification of (G). (I) Western blot analysis was performed to detect γ-H2AX. 13A NSC were treated with Aβ (5 μM) for 72 h. (J) The quantification of (I). (K) Representative images of γ-H2AX staining in 3L NSC treated by Aβ (5 µM) at 72 h. The pictures were obtained via Olympus FV3000. Scale bar, 20 µm. (L) Representative images of 8-OHDG staining in 3L NSC treated with Aβ (5 µM) at 72 h. The pictures were obtained via Olympus FV3000. Scale bar, 20 µm. The data were presented as mean ± SEM, n ≥ 3 independent experiments, * p < 0.05, ** p < 0.01, *** p < 0.001, analyzed using unpaired Student’s t-test (two-tailed). (Original western blot images can be found in Supplementary Materials Excel File S1).
Figure 3
Figure 3
SIRT1 was decreased in amyloid-β-induced cell senescence in human NSCs. (A) Western blot analysis of SIRT1 and PCG-1α protein expression after treatment with Aβ (5 µM) in 3L NSC. (B,C) Quantification of SIRT1 (B) and PCG-1α (C) protein levels in (A). (D) Western blot analysis of SIRT1 and PCG-1α protein expression after treatment with Aβ (5 µM) in 13A NSC. (E,F) Quantification of SIRT1 (E) and PCG-1α (F) protein levels in (D). (G) The cells were subjected to transfection with a negative control (NC) and siSIRT1 in 3L NSC. After 72 h, these cells were then harvested. SIRT1 and p21 levels were analyzed with Western blotting. (H,I) Quantification of SIRT1 (H) and p21 (I) protein levels in 3L NSC. (J) The cells were subjected to transfection with a negative control (NC) and siSIRT1 in 13A NSC. After 72 h, these cells were then harvested. SIRT1 and p21 levels were analyzed with Western blotting. (K,L) Quantification of SIRT1 (K) and p21 (L) protein levels in 13A NSC. (M) The representative images of SA-β-gal staining in 3L NSC following NC or siSIRT1 treatment after 72 h. (N) The quantification analysis of relative Spider-βGal-positive foci in (M). (O) The representative images of SA-β-gal staining in 13A NSC following NC or SiSIRT1 treatment after 72 h. (P) Quantification of relative Spider-βGal-positive foci in (O). The data were presented as mean ± SEM, n ≥ 3 independent experiments, * p < 0.05, ** p < 0.01, *** p < 0.001, and **** p < 0.0001, analyzed using unpaired Student’s t-test (two-tailed). (Original western blot images can be found in Supplementary Materials Excel File S1).
Figure 4
Figure 4
Overexpression of SIRT1 rescued Aβ-induced cell senescence. (A) The 3L NSC cells were subjected to infection with either SIRT1 lentivirus or vector, followed by incubation with or without Aβ (5 µM) for a duration of 72 h. Subsequently, the protein levels of SIRT1, p21, and p16 were analyzed using Western blot analysis. (BD) Quantification of SIRT1 (B), p21 (C), and p16 (D) protein levels in (A). (E) The representative images show SA-β-gal staining in 3L NSC treated with Aβ or without for 72 h, following infection with lentivirus of SIRT1 or vector. (F) Quantification of relative Spider-βGal-positive foci in (E). (G) The representative images show SA-β-gal staining in 13A NSC treated with Aβ or without for 72 h, following infection with lentivirus of SIRT1 or vector. (H) Quantification of relative Spider-βGal-positive foci in (G). The pictures were obtained by Olympus FV3000. Scale bar, 20 µm. The data were presented as mean ± SEM, n ≥ 3 independent experiments, * p < 0.05, ** p < 0.01, *** p < 0.001, and **** p < 0.0001, analyzed by two-way ANOVA. (Original western blot images can be found in Supplementary Materials Excel File S1).

References

    1. Wang J., Tian M., Zhang H. PET molecular imaging in stem cell therapy for neurological diseases. Eur. J. Nucl. Med. Mol. Imaging. 2011;38:1926–1938. doi: 10.1007/s00259-011-1860-7. - DOI - PubMed
    1. Santos M.F.D., Roxo C., Solá S. Oxidative-Signaling in Neural Stem Cell-Mediated Plasticity: Implications for Neurodegenerative Diseases. Antioxidants. 2021;10:1088. doi: 10.3390/antiox10071088. - DOI - PMC - PubMed
    1. Zhao X., Moore D.L. Neural stem cells: Developmental mechanisms and disease modeling. Cell Tissue Res. 2018;371:1–6. doi: 10.1007/s00441-017-2738-1. - DOI - PMC - PubMed
    1. Liu L., Rando T.A. Manifestations and mechanisms of stem cell aging. J. Cell Biol. 2011;193:257–266. doi: 10.1083/jcb.201010131. - DOI - PMC - PubMed
    1. Kaise T., Fukui M., Sueda R., Piao W., Yamada M., Kobayashi T., Imayoshi I., Kageyama R. Functional rejuvenation of aged neural stem cells by Plagl2 and anti-Dyrk1a activity. Genes Dev. 2022;36:23–37. doi: 10.1101/gad.349000.121. - DOI - PMC - PubMed